Sive Morten
Special Consultant to the FPA
- Messages
- 18,673
Fundamentals
Reuters reports U.S. dollar edged up against most other major currencies Friday on data pointing to sluggish overseas economic growth, while the Australian dollar sagged to a six-year low after a Chinese manufacturing gauge fell to its weakest in 15 months.
Recent U.S. economic figures have supported the notion that the Federal Reserve sees the economy as strong enough for it to end its near-zero interest rate policy as early as September, an action that dollar bulls have betting on since last year.
"Worries about global growth have been rekindled. That has sparked a play into the dollar," said Joe Manimbo, senior market analyst at Western Union Business Solutions in Washington.
The flash Caixin/Markit China Manufacturing Purchasing Managers' Index (PMI) dropped to 48.2, the lowest since April last year, while Markit's euro zone PMI gauge fell from a four-year high to 53.7 in early July.
In late U.S. trading, the dollar index was up 0.2 percent at 97.274, reducing its weekly decline to 0.6 percent.
The greenback retreated from its earlier highs as U.S. stock prices turned lower for a fourth session.
The euro dipped 0.05 percent to $1.0977, while the greenback dipped 0.1 percent to 123.71 yen.
Fed policymakers may provide clues on a rate "lift-off" in a statement after they meet next week.
The U.S. central bank on Friday released its staff's projection which showed they expected a quarter-point increase in U.S. rates by year-end.
"Next week's meeting could be a signal meeting," said Mazen Issa, senior currency strategist at TD Securities in New York.
Some analysts said there were adequate risks to cause the Fed to not raise rates this year, including turmoil in the Chinese stock market, and a renewed drop in oil and other commodity prices.
Friday's news of a surprise 6.8 percent drop in new-home sales in June was a reminder that the U.S. economy, while faring better than many others, was far from robust.
Among other major currencies, the Aussie dollar, often used as a liquid proxy for China trades, fell more than 1 percent to $0.7280, a six-year low.
Other currencies linked to global commodities prices also were under pressure because of the weak Chinese PMI data. The New Zealand dollar was down 0.6 percent at $0.6568.
Worries about Chinese demand sent Brent crude prices in London to near a four-month low at $54.30 a barrel and copper prices to six-year low of $5,191.50 a tonne.
Since we also have CAD long-term trade in progress, here, guys, some analysts' opinions on perspectives. As you can see from text below 1.34-1.35 is nothing curious and achievable level, even by the end of summer:
The Canadian dollar finished little changed against its U.S. counterpart on Friday, but not before crashing to the lowest levels since 2004, hit by a confluence of factors including weak commodities and a dim global economic outlook. The move came as the price of oil, a major Canadian export, remained near $48 a barrel. Weaker-than-expected economic data from China, the world's biggest metals consumer, sent currencies linked to global commodity prices, such as the Canadian and Australian dollars, to multi-year lows. Momentum buying of USD/CAD and loonie selling also drove earlier moves.
David Bradley, director of foreign exchange trading at Bank of Nova Scotia, noted that the Canadian dollar crashed through its 2009 low Friday morning. "That triggered some stops, some short covering," he said, noting the quick move to C$1.31 before settling down. "Now that we're through some of the technical levels in USD/CAD, it definitely opens up the topside significantly. We could probably trade up toward C$1.34, C$1.35 by the end of the summer, or by back to school time."
The Canadian dollar finished at C$1.3035 to the greenback, or 76.72 U.S. cents, little changed from the Bank of
Canada's official close of C$1.3039, or 76.69 U.S. cents, on Thursday. The loonie cracked through the March 2009 low of C$1.3066 early in the North American session, retreating as far as C$1.3103, or 76.32 U.S. cents, a level not seen since Sept. 1, 2004.
Many strategists are eyeing around C$1.33, or 75 U.S. cents, as the next key levels, with upwards of C$1.39 and beyond marked as potential long-term possibilities. The Canadian dollar was at just above C$1.40 in May 2004.
By the end of the session, the currency was stronger against many of its peers. The divergence between U.S. and Canadian monetary policies, with the Federal Reserve expected to hike interest rates and the Bank of Canada having already cut rates twice this year, is expected to keep the Canadian dollar weaker against a stronger greenback. A rout in commodity prices, particularly over global supply and demand concerns is expected to add to the pressure. Canadian government bond prices were mixed across the maturity curve, with the two-year price down 1 Canadian cent to yield 0.430 percent and the benchmark 10-year rising 11 Canadian cents to yield 1.489 percent. The Canada-U.S. two-year bond spread narrowed to -25.2 basis points, while the 10-year spread narrowed to 77.2 basis points.
Speculators raised bullish bets on the U.S. dollar to the highest in about six weeks, according to Reuters calculations and data from the Commodity Futures Trading Commission released on Friday.
The value of the dollar's net long position rose to $29.77 billion in the week ended July 21, up from $27.29 billion in the previous week.
CFTC data shows shy increase of open interest and corresponding growth of speculative short positions. As long as shorts have dropped significantly on Greece turmoil. Right now shorts take ~73% of total speculative positions. This is not critical level and EUR theoretically could move lower. At the same time changes in sentiment data was too small and this does let us to suggest that bear trend is accelerating and investors come to EUR selling again. So, CFTC data mostly stands flat on current week and does not favor any direction.
Open Interest:
 Longs:
 Shorts:

Technicals
Monthly
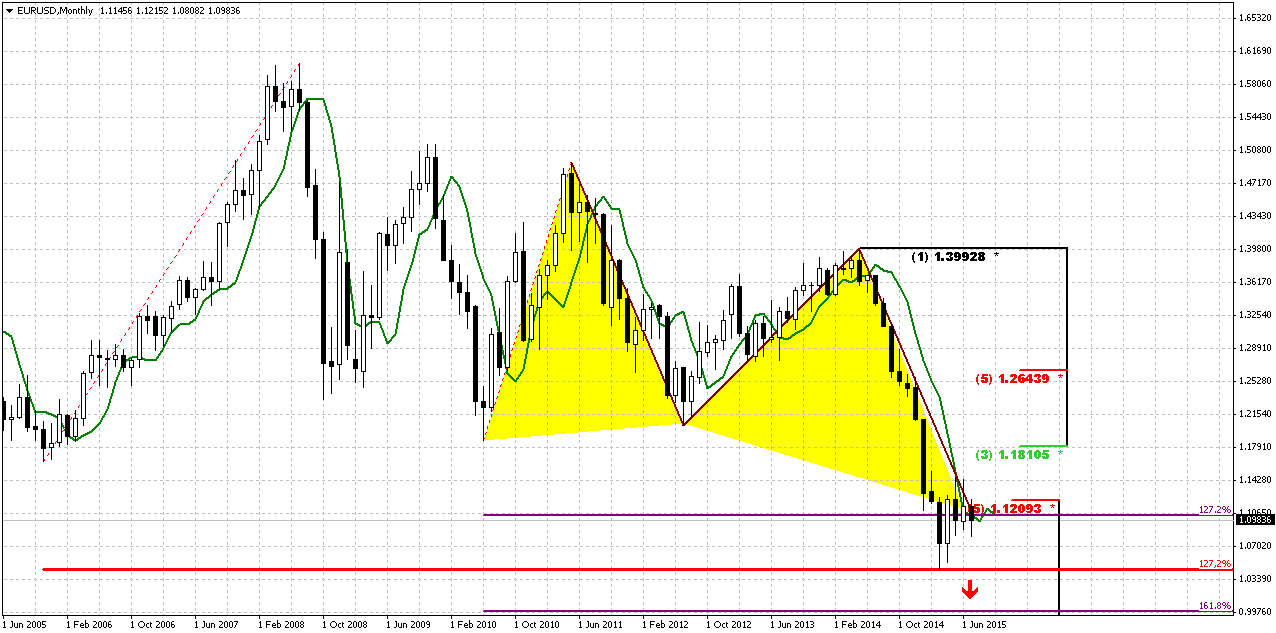
Trend is bearish on monthly chart, July action does not bring any additional information by far and does not clarify further direction. Based on character of recent activity on the market – recent 3-4 months are definitely a retracement, but it could develop differently. For example, market could return back to lows and then form DRPO Buy and trigger upside retracement or, say, it could move directly to 1.18 right now and form B&B “Sell”. Both scenarios are possible yet.
As we have estimated previously 1.05 is 1.27 extension of huge upside swing in 2005-2008 that also has created large & wide butterfly pattern. Recent action does not quite look like normal butterfly wing, but extension is valid and 1.05 is precisely 1.27 ratio. At the same time we have here another supportive targets, as most recent AB=CD, oversold and 1.27 of recent butterfly.
April has closed and confirmed nicely looking bullish engulfing pattern. We know that most probable target of this pattern is length of the bars counted upside. This will give us approximately 3/8 Fib resistance 1.1810 area. This retracement should be mostly tactical. We continue to expect downward continuation in long-term perspective.
Now about our recent talk on possible B&B or DRPO here. We’ve said that B&B seems more probable. We’ve got close above 3x3 DMA in June, but this barely has happened. July action stands flat and this is not sufficient to get B&B “Sell”. So chances on its appearing are melting as time is passing by. Still we will keep watching for DiNapoli directional patterns but probably they will appear not as fast as we have expected.
Despite whether upside retracement will happen or not our next long-term target stands the same – parity as 1.618 completion point of recent butterfly. Currently we should treat possible bounce up, even to 1.18 area, only as retracement within bear trend.
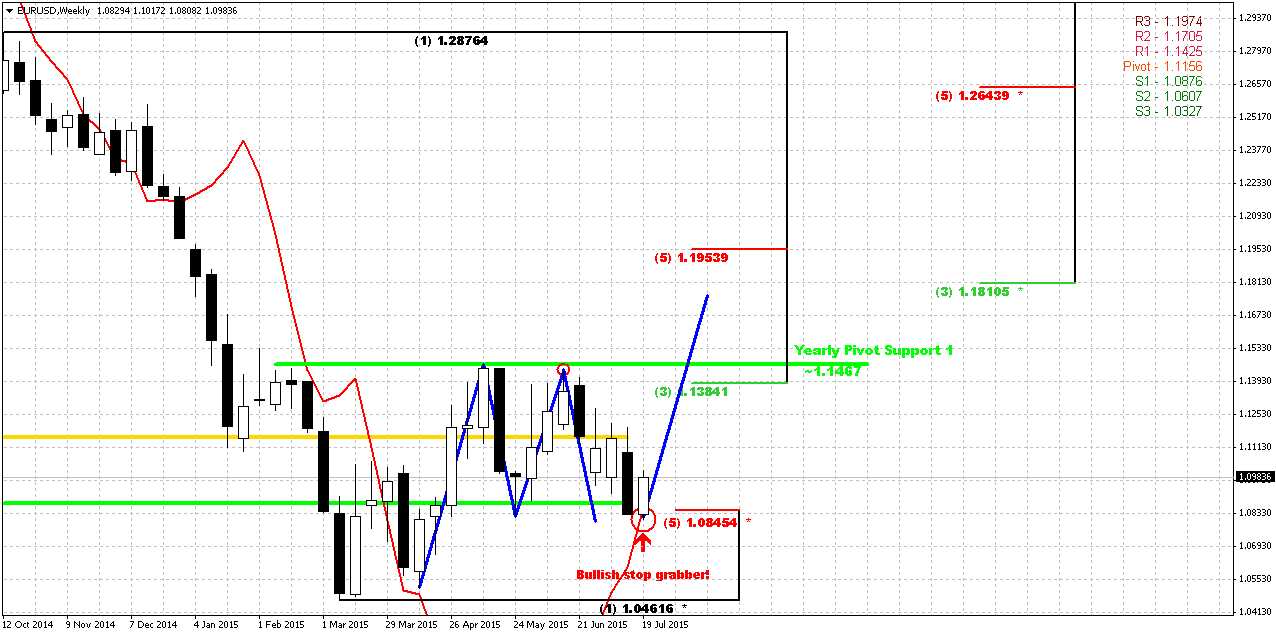
Weekly
Right now weekly chart is most important for us, since it has major patterns that could become driving factors medium-term perspective. Once we’ve said that if EUR will take 1.08 lows it will erase chance on upside butterfly, and this has happened. At the same time take a look at the picture – market has created nothing but “222” Buy pattern. Now recall puny W&R on daily chart two days ago. When I saw it I thought why it is so small. Now we understand – market just has completed downward AB=CD. As soon as it has done it – it has turned up.
Second issue is MPS1. Price has held above it. It means that bullish trend on weekly chart is still valid. And finally – last week we’ve got bullish grabber. Minimum target that market should reach based on this pattern is former highs around 1.1450 level. If we suggest possible upside AB=CD then our monthly scenario with B&B pattern @ 1.18 does not look as impossible as previously.
Don’t ask me how this should happen in current fundamental background – different rate policy Fed and EU, EU QE program, etc. I do not have answer on this question. But you can see everything by yourself – take a look at the chart.
Last week when we’ve said that CAD should reach 1.30 there also were a lot of doubts. But Bank of Canada surprisingly cut the rate and target has been achieved. May be we also will get some event that will make possible to reach the target.
Conversely, any setup could fail, and grabber is not an exception. Failure also will eliminate any concerns on “how EUR will reach 1.18” answer will be nohow. But as soon as setup is still valid we will work with it. It gives us important information that our invalidation point is last week lows. If market will break them – our setup will be destroyed.
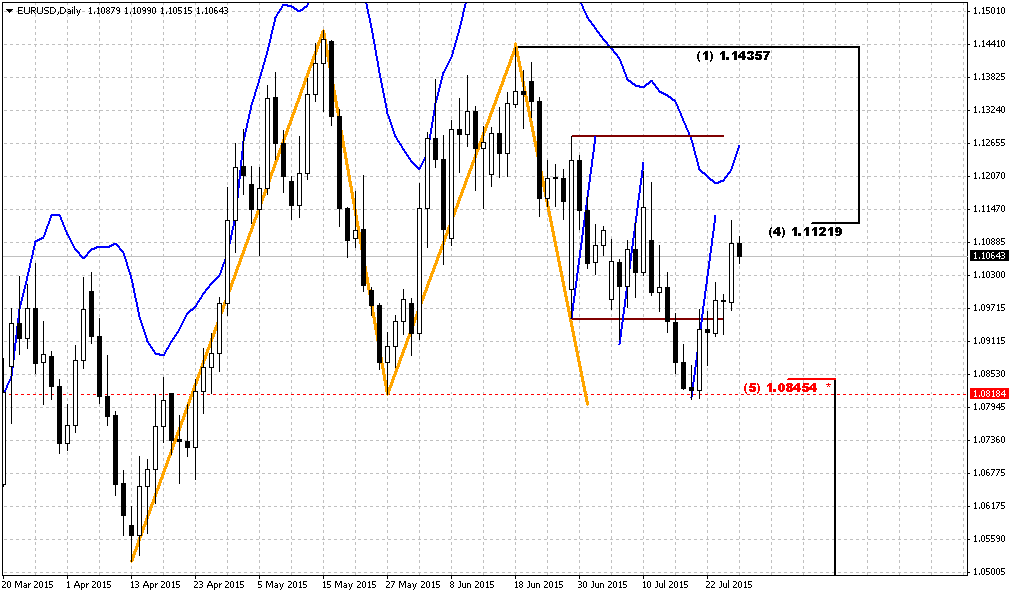
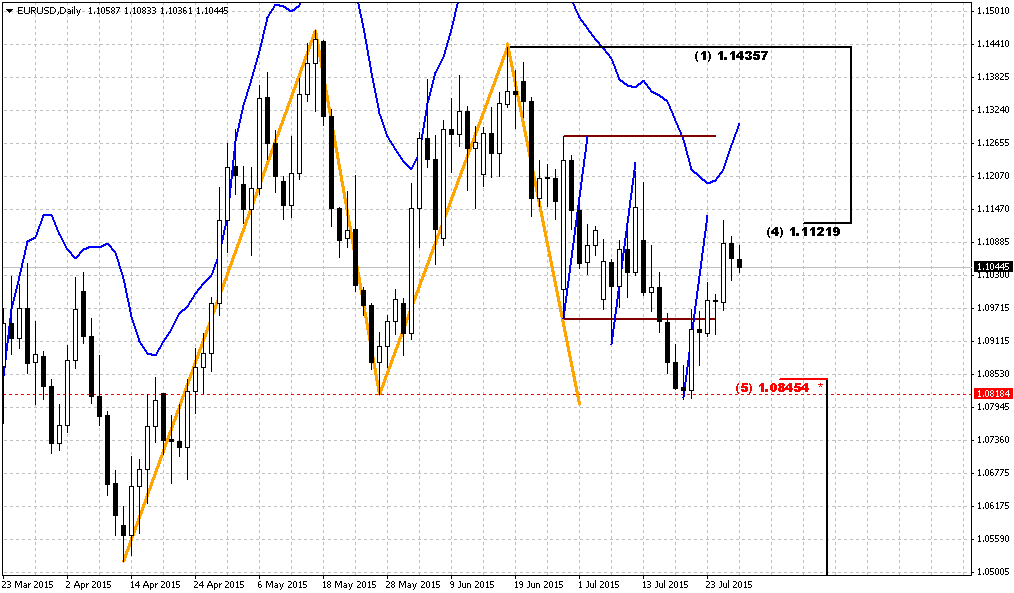
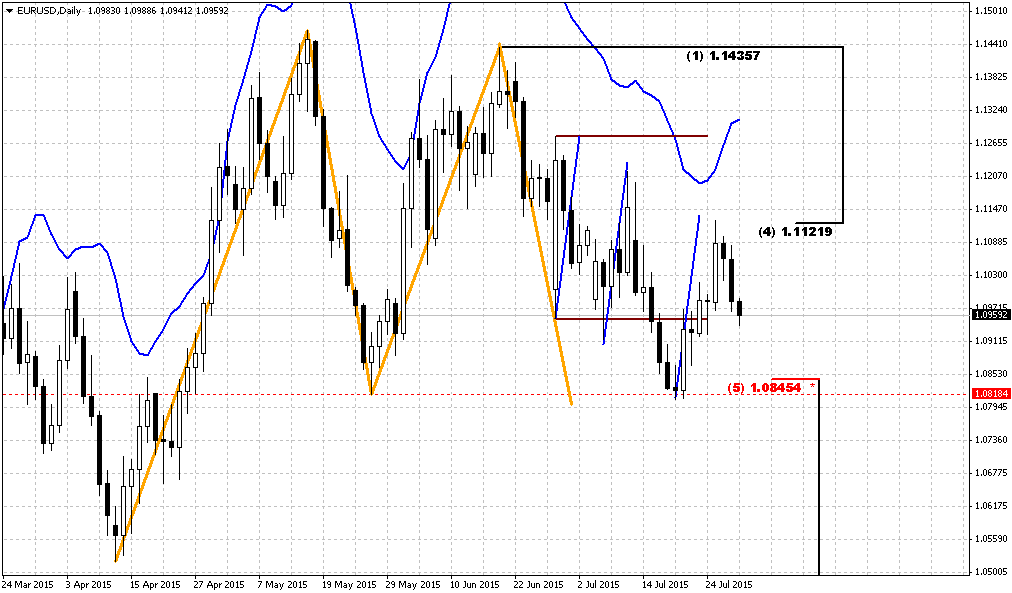
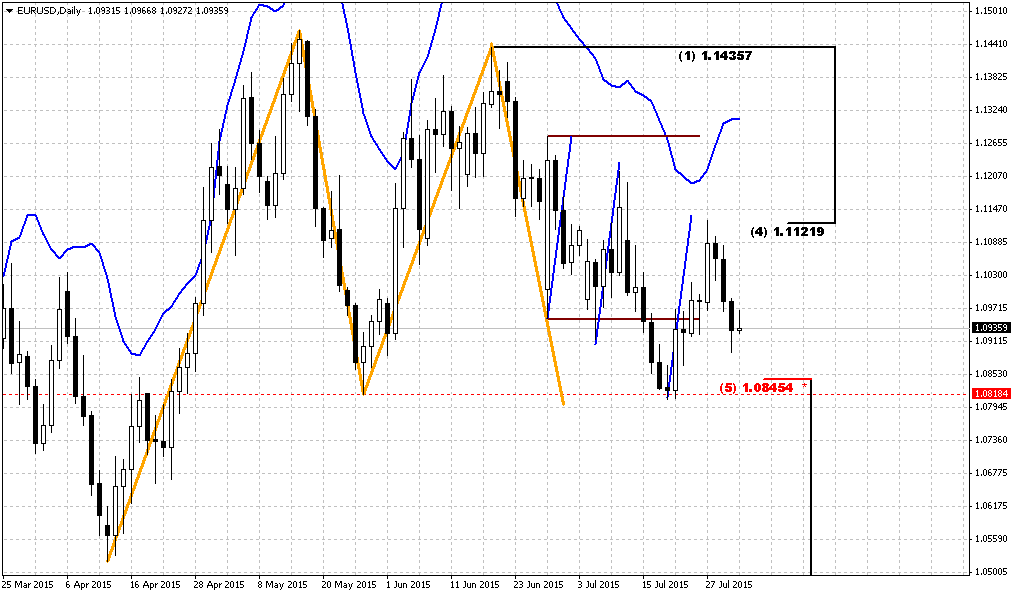
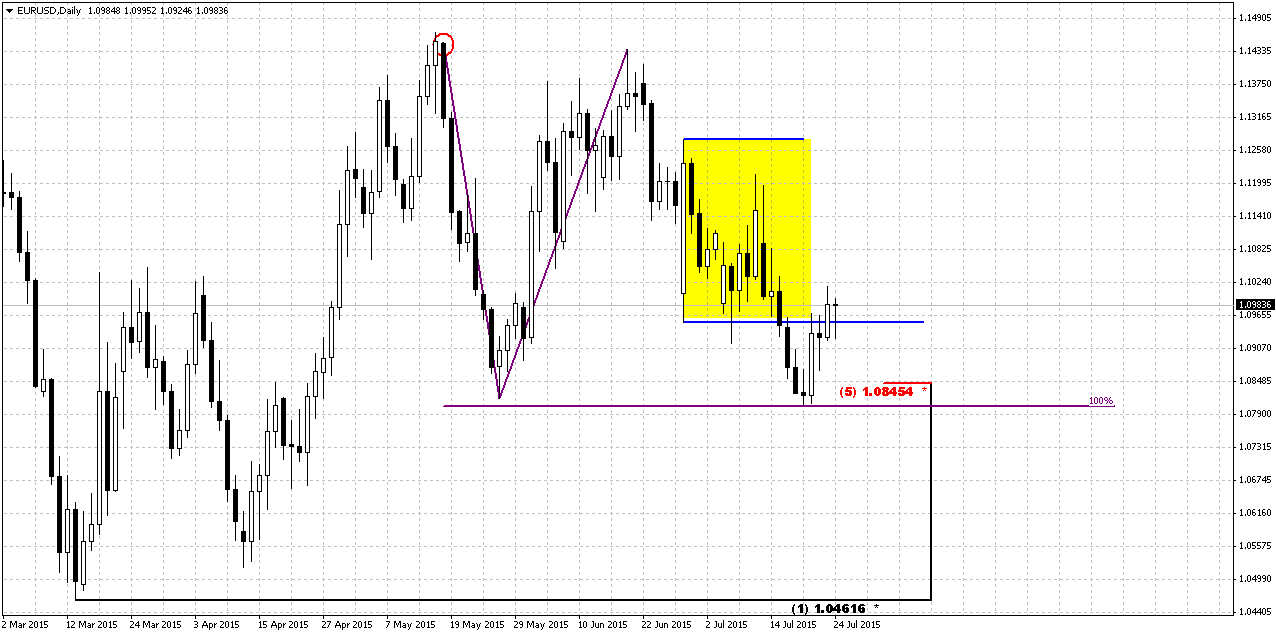
Daily
Daily analysis mostly coincides with weekly one. But it contains some important details for us. For somebody they could appear to be boring, but sometimes such moments make trader’s day. First is I would like to attract our attention to the “A” point in red circle of AB=CD. Why we’ve chosen this point but not the top. Because it was Monday. Market has open with shy gap down and started drop immediately. So, real downward action has started on Monday, but not on Friday. As a result – we have clear explanation why market has shown so shy W&R of 1.08 lows last week – it just has hit AB-CD target. Now imagine what could happen if we would use absolute top as “A” point – AB-CD pattern still stands as uncompleted and this could make significant impact on our analysis. For example we could expect grabber’s failure with greater probability rather than upside continuation, since market should hit AB-CD target before any reasonable upside action.
So, we have strong support area at 1.0850 – weekly and daily Agreement and MPS1. Market has returned back and closed inside long-ranged candle. Also market has closed above WPP. So, may be attempt to take bet on upside continuation is not as bad idea as it seems. At least it has superb risk/reward ratio and clear background of weekly and daily patterns, clear signs of failure either. Anyway, currently we could take only long position, because trends are bullish, and we have patterns. Until they are valid it is dangerous to go short.
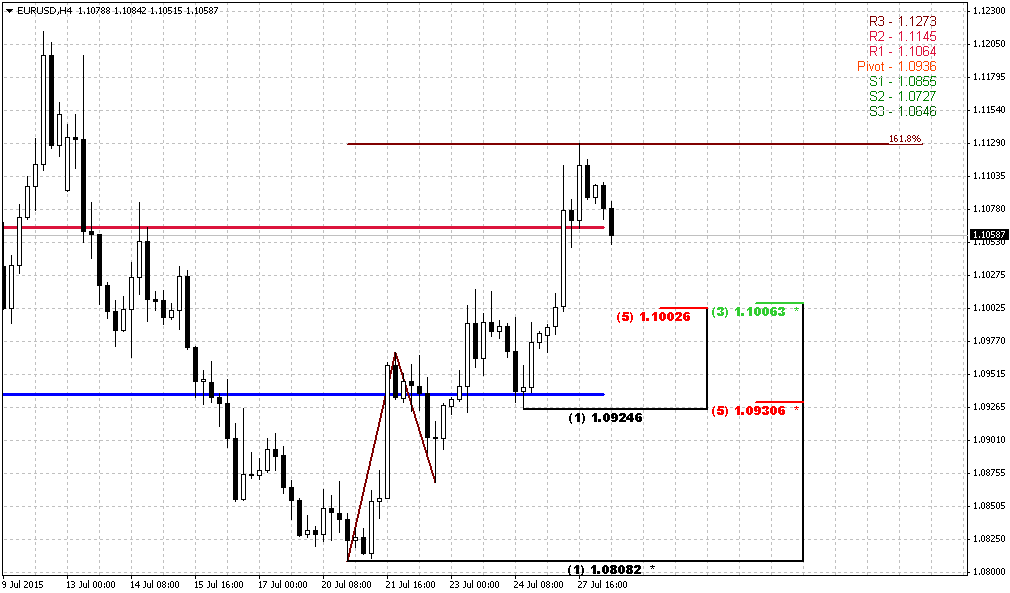
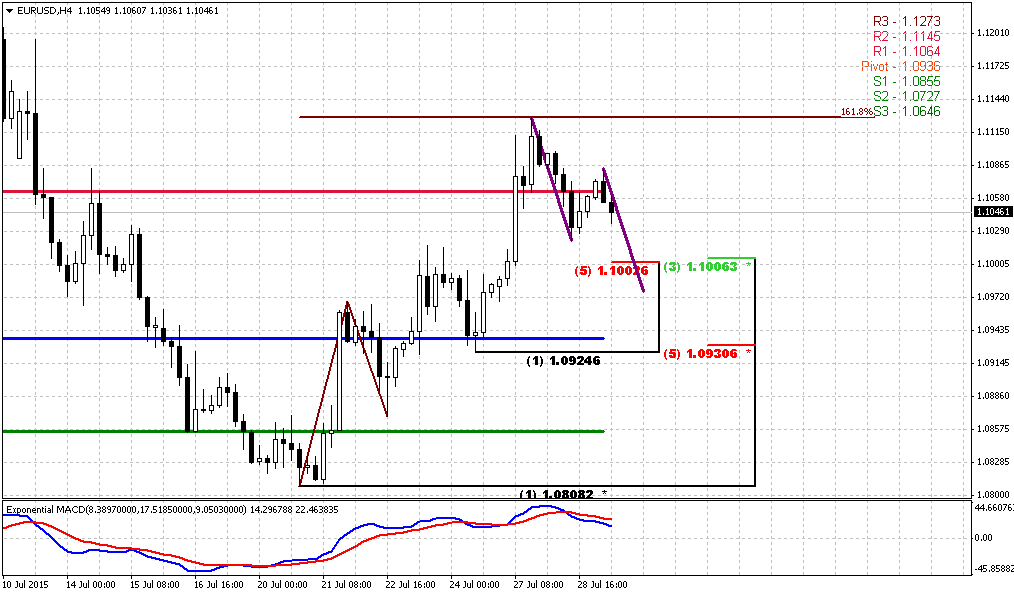
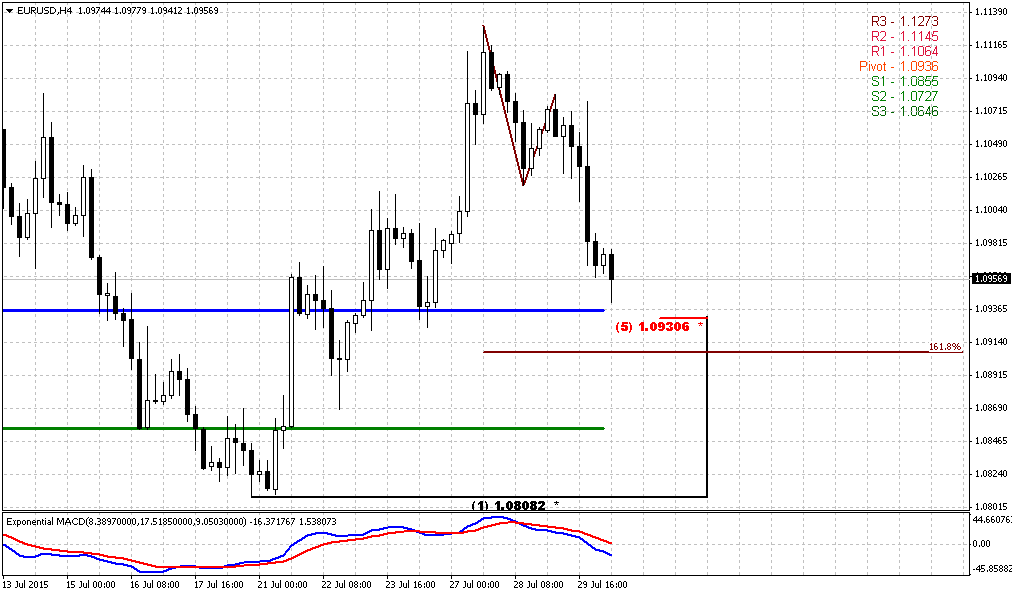
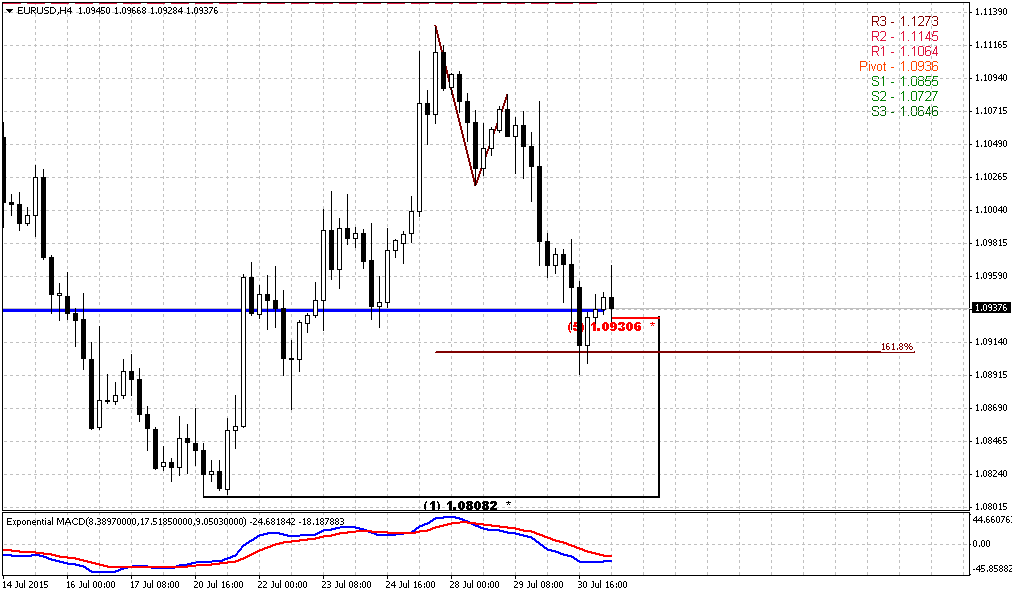
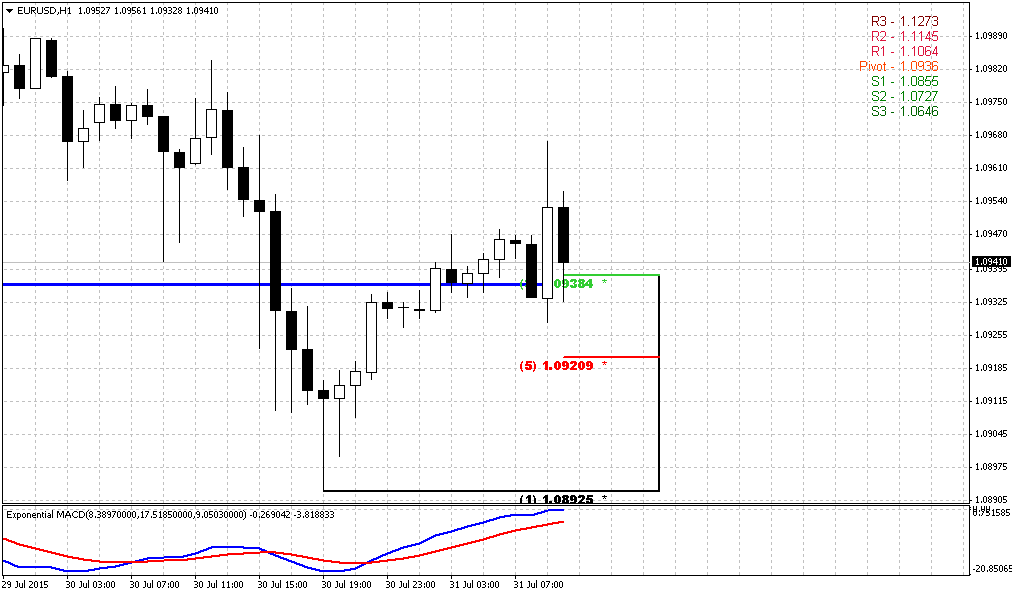
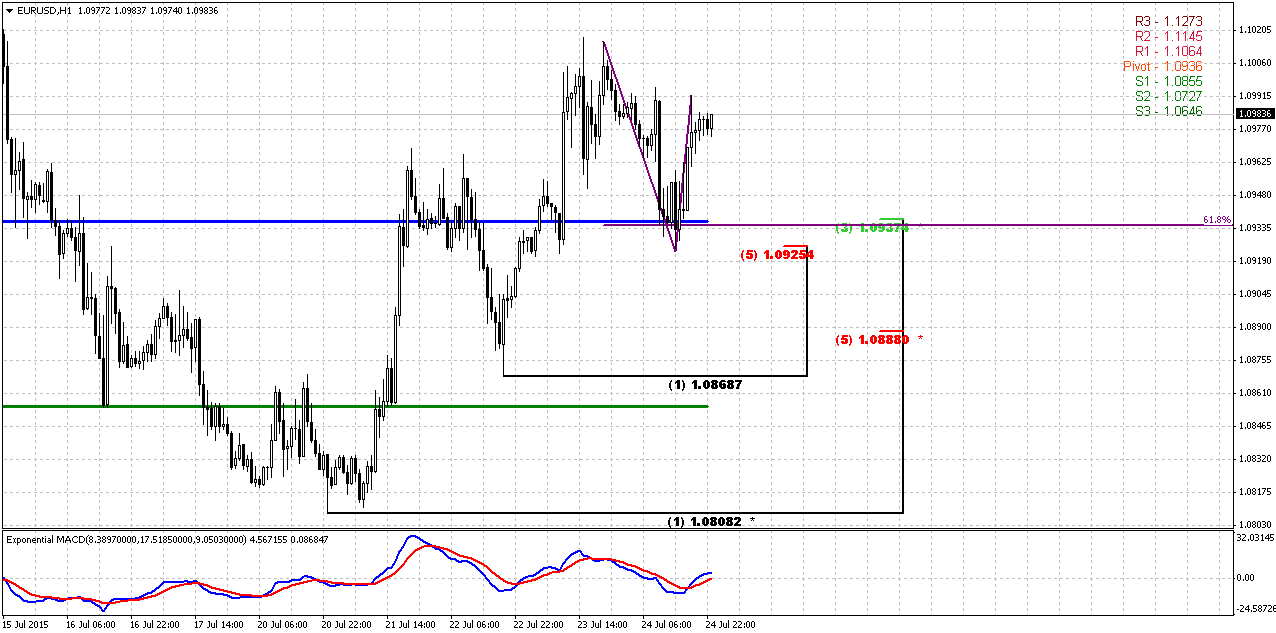
1-Hour
Now we’re coming to most responsible stage – trade planning. Since market is not at overbought we do not need too deep Fib support levels. We think that 1.0925-1.0940 area is what we’re looking for. This is hourly K-support and Agreement with 0.618 AB-CD target, WPP and lower border of consolidation on daily chart. One moment we have to keep an eye on is a pace of downward action. This should not be miserable drop – just gradual action.
Stop will be better to place below 1.0880 Fib support. Although there are few chances but EUR could complete AB=CD instead minor one and gravitate to its favorite 50% Fib support around 1.0915 level.
Traders who trade on weekly chart could place stop below grabber’s lows. Bullish setup will fail as soon as grabber and “222” pattern will fail.
Conclusion:
Despite strong bearish background and fundamentals market shows signs of possible upside retracement, initially to 1.1450, potentially to 1.18 area. Still, this retracement will be mostly tactical and not break long-term bearish trend and our expectation of parity.
In short-term perspective our major pattern is weekly grabber. If it will fail – then upside action probably will not happen and market will continue move down but currently we just can’t ignore this setup.
The technical portion of Sive's analysis owes a great deal to Joe DiNapoli's methods, and uses a number of Joe's proprietary indicators. Please note that Sive's analysis is his own view of the market and is not endorsed by Joe DiNapoli or any related companies.
Reuters reports U.S. dollar edged up against most other major currencies Friday on data pointing to sluggish overseas economic growth, while the Australian dollar sagged to a six-year low after a Chinese manufacturing gauge fell to its weakest in 15 months.
Recent U.S. economic figures have supported the notion that the Federal Reserve sees the economy as strong enough for it to end its near-zero interest rate policy as early as September, an action that dollar bulls have betting on since last year.
"Worries about global growth have been rekindled. That has sparked a play into the dollar," said Joe Manimbo, senior market analyst at Western Union Business Solutions in Washington.
The flash Caixin/Markit China Manufacturing Purchasing Managers' Index (PMI) dropped to 48.2, the lowest since April last year, while Markit's euro zone PMI gauge fell from a four-year high to 53.7 in early July.
In late U.S. trading, the dollar index was up 0.2 percent at 97.274, reducing its weekly decline to 0.6 percent.
The greenback retreated from its earlier highs as U.S. stock prices turned lower for a fourth session.
The euro dipped 0.05 percent to $1.0977, while the greenback dipped 0.1 percent to 123.71 yen.
Fed policymakers may provide clues on a rate "lift-off" in a statement after they meet next week.
The U.S. central bank on Friday released its staff's projection which showed they expected a quarter-point increase in U.S. rates by year-end.
"Next week's meeting could be a signal meeting," said Mazen Issa, senior currency strategist at TD Securities in New York.
Some analysts said there were adequate risks to cause the Fed to not raise rates this year, including turmoil in the Chinese stock market, and a renewed drop in oil and other commodity prices.
Friday's news of a surprise 6.8 percent drop in new-home sales in June was a reminder that the U.S. economy, while faring better than many others, was far from robust.
Among other major currencies, the Aussie dollar, often used as a liquid proxy for China trades, fell more than 1 percent to $0.7280, a six-year low.
Other currencies linked to global commodities prices also were under pressure because of the weak Chinese PMI data. The New Zealand dollar was down 0.6 percent at $0.6568.
Worries about Chinese demand sent Brent crude prices in London to near a four-month low at $54.30 a barrel and copper prices to six-year low of $5,191.50 a tonne.
Since we also have CAD long-term trade in progress, here, guys, some analysts' opinions on perspectives. As you can see from text below 1.34-1.35 is nothing curious and achievable level, even by the end of summer:
The Canadian dollar finished little changed against its U.S. counterpart on Friday, but not before crashing to the lowest levels since 2004, hit by a confluence of factors including weak commodities and a dim global economic outlook. The move came as the price of oil, a major Canadian export, remained near $48 a barrel. Weaker-than-expected economic data from China, the world's biggest metals consumer, sent currencies linked to global commodity prices, such as the Canadian and Australian dollars, to multi-year lows. Momentum buying of USD/CAD and loonie selling also drove earlier moves.
David Bradley, director of foreign exchange trading at Bank of Nova Scotia, noted that the Canadian dollar crashed through its 2009 low Friday morning. "That triggered some stops, some short covering," he said, noting the quick move to C$1.31 before settling down. "Now that we're through some of the technical levels in USD/CAD, it definitely opens up the topside significantly. We could probably trade up toward C$1.34, C$1.35 by the end of the summer, or by back to school time."
The Canadian dollar finished at C$1.3035 to the greenback, or 76.72 U.S. cents, little changed from the Bank of
Canada's official close of C$1.3039, or 76.69 U.S. cents, on Thursday. The loonie cracked through the March 2009 low of C$1.3066 early in the North American session, retreating as far as C$1.3103, or 76.32 U.S. cents, a level not seen since Sept. 1, 2004.
Many strategists are eyeing around C$1.33, or 75 U.S. cents, as the next key levels, with upwards of C$1.39 and beyond marked as potential long-term possibilities. The Canadian dollar was at just above C$1.40 in May 2004.
By the end of the session, the currency was stronger against many of its peers. The divergence between U.S. and Canadian monetary policies, with the Federal Reserve expected to hike interest rates and the Bank of Canada having already cut rates twice this year, is expected to keep the Canadian dollar weaker against a stronger greenback. A rout in commodity prices, particularly over global supply and demand concerns is expected to add to the pressure. Canadian government bond prices were mixed across the maturity curve, with the two-year price down 1 Canadian cent to yield 0.430 percent and the benchmark 10-year rising 11 Canadian cents to yield 1.489 percent. The Canada-U.S. two-year bond spread narrowed to -25.2 basis points, while the 10-year spread narrowed to 77.2 basis points.
Speculators raised bullish bets on the U.S. dollar to the highest in about six weeks, according to Reuters calculations and data from the Commodity Futures Trading Commission released on Friday.
The value of the dollar's net long position rose to $29.77 billion in the week ended July 21, up from $27.29 billion in the previous week.
CFTC data shows shy increase of open interest and corresponding growth of speculative short positions. As long as shorts have dropped significantly on Greece turmoil. Right now shorts take ~73% of total speculative positions. This is not critical level and EUR theoretically could move lower. At the same time changes in sentiment data was too small and this does let us to suggest that bear trend is accelerating and investors come to EUR selling again. So, CFTC data mostly stands flat on current week and does not favor any direction.
Open Interest:
Technicals
Monthly
Trend is bearish on monthly chart, July action does not bring any additional information by far and does not clarify further direction. Based on character of recent activity on the market – recent 3-4 months are definitely a retracement, but it could develop differently. For example, market could return back to lows and then form DRPO Buy and trigger upside retracement or, say, it could move directly to 1.18 right now and form B&B “Sell”. Both scenarios are possible yet.
As we have estimated previously 1.05 is 1.27 extension of huge upside swing in 2005-2008 that also has created large & wide butterfly pattern. Recent action does not quite look like normal butterfly wing, but extension is valid and 1.05 is precisely 1.27 ratio. At the same time we have here another supportive targets, as most recent AB=CD, oversold and 1.27 of recent butterfly.
April has closed and confirmed nicely looking bullish engulfing pattern. We know that most probable target of this pattern is length of the bars counted upside. This will give us approximately 3/8 Fib resistance 1.1810 area. This retracement should be mostly tactical. We continue to expect downward continuation in long-term perspective.
Now about our recent talk on possible B&B or DRPO here. We’ve said that B&B seems more probable. We’ve got close above 3x3 DMA in June, but this barely has happened. July action stands flat and this is not sufficient to get B&B “Sell”. So chances on its appearing are melting as time is passing by. Still we will keep watching for DiNapoli directional patterns but probably they will appear not as fast as we have expected.
Despite whether upside retracement will happen or not our next long-term target stands the same – parity as 1.618 completion point of recent butterfly. Currently we should treat possible bounce up, even to 1.18 area, only as retracement within bear trend.
Weekly
Right now weekly chart is most important for us, since it has major patterns that could become driving factors medium-term perspective. Once we’ve said that if EUR will take 1.08 lows it will erase chance on upside butterfly, and this has happened. At the same time take a look at the picture – market has created nothing but “222” Buy pattern. Now recall puny W&R on daily chart two days ago. When I saw it I thought why it is so small. Now we understand – market just has completed downward AB=CD. As soon as it has done it – it has turned up.
Second issue is MPS1. Price has held above it. It means that bullish trend on weekly chart is still valid. And finally – last week we’ve got bullish grabber. Minimum target that market should reach based on this pattern is former highs around 1.1450 level. If we suggest possible upside AB=CD then our monthly scenario with B&B pattern @ 1.18 does not look as impossible as previously.
Don’t ask me how this should happen in current fundamental background – different rate policy Fed and EU, EU QE program, etc. I do not have answer on this question. But you can see everything by yourself – take a look at the chart.
Last week when we’ve said that CAD should reach 1.30 there also were a lot of doubts. But Bank of Canada surprisingly cut the rate and target has been achieved. May be we also will get some event that will make possible to reach the target.
Conversely, any setup could fail, and grabber is not an exception. Failure also will eliminate any concerns on “how EUR will reach 1.18” answer will be nohow. But as soon as setup is still valid we will work with it. It gives us important information that our invalidation point is last week lows. If market will break them – our setup will be destroyed.
Daily
Daily analysis mostly coincides with weekly one. But it contains some important details for us. For somebody they could appear to be boring, but sometimes such moments make trader’s day. First is I would like to attract our attention to the “A” point in red circle of AB=CD. Why we’ve chosen this point but not the top. Because it was Monday. Market has open with shy gap down and started drop immediately. So, real downward action has started on Monday, but not on Friday. As a result – we have clear explanation why market has shown so shy W&R of 1.08 lows last week – it just has hit AB-CD target. Now imagine what could happen if we would use absolute top as “A” point – AB-CD pattern still stands as uncompleted and this could make significant impact on our analysis. For example we could expect grabber’s failure with greater probability rather than upside continuation, since market should hit AB-CD target before any reasonable upside action.
So, we have strong support area at 1.0850 – weekly and daily Agreement and MPS1. Market has returned back and closed inside long-ranged candle. Also market has closed above WPP. So, may be attempt to take bet on upside continuation is not as bad idea as it seems. At least it has superb risk/reward ratio and clear background of weekly and daily patterns, clear signs of failure either. Anyway, currently we could take only long position, because trends are bullish, and we have patterns. Until they are valid it is dangerous to go short.
1-Hour
Now we’re coming to most responsible stage – trade planning. Since market is not at overbought we do not need too deep Fib support levels. We think that 1.0925-1.0940 area is what we’re looking for. This is hourly K-support and Agreement with 0.618 AB-CD target, WPP and lower border of consolidation on daily chart. One moment we have to keep an eye on is a pace of downward action. This should not be miserable drop – just gradual action.
Stop will be better to place below 1.0880 Fib support. Although there are few chances but EUR could complete AB=CD instead minor one and gravitate to its favorite 50% Fib support around 1.0915 level.
Traders who trade on weekly chart could place stop below grabber’s lows. Bullish setup will fail as soon as grabber and “222” pattern will fail.
Conclusion:
Despite strong bearish background and fundamentals market shows signs of possible upside retracement, initially to 1.1450, potentially to 1.18 area. Still, this retracement will be mostly tactical and not break long-term bearish trend and our expectation of parity.
In short-term perspective our major pattern is weekly grabber. If it will fail – then upside action probably will not happen and market will continue move down but currently we just can’t ignore this setup.
The technical portion of Sive's analysis owes a great deal to Joe DiNapoli's methods, and uses a number of Joe's proprietary indicators. Please note that Sive's analysis is his own view of the market and is not endorsed by Joe DiNapoli or any related companies.