Sive Morten
Special Consultant to the FPA
- Messages
- 18,669
Monthly
The dollar retreated from recent highs against other major currencies and closed lower on Friday as traders braced for potentially market-moving meetings next week by the European Central Bank and other monetary policymakers. The dollar, as tracked by the U.S. dollar index of a half dozen currency pairs, was last off 0.18 percent at 80.353. Earlier this week, the index was at highs not seen since early April.
Volumes were light as currency traders tidied up books at the end of the month, according to Lane Newman, director of foreign exchange at ING Capital Markets in New York. The euro, which has lost 1.65 percent against the dollar during May, was also up on the day, 0.26 percent to $1.3637, after touching a daily low of $1.3599. "There's caution ahead of the event risk coming in the form of the central bank meetings. With May ending, that will likely make for low volatility today," said Shaun Osborne, chief foreign exchange strategist at TD Securities in Toronto. Attention in currency and other global markets is now firmly focused on next week's European Central Bank meeting, which is expected to deliver more policy easing. It comes as conviction has been shaken that the Bank of Japan would also take more action this summer, underpinning a rise for the yen to almost four-month highs against the euro.
Likewise, while the dollar has gained earlier this week, U.S. Treasury yields have fallen, and dealers said there was talk of some substantial fund option bets on the yen strengthening to as little as 98 per dollar over the next month. On Friday, the dollar traded at 101.75 yen, down 0.04 percent for the day.
The euro has fallen almost 3 percent against the dollar in just the past three weeks, hammered by expectations that the ECB will deliver a substantial blow by pumping more cash into the euro zone economy and lower market interest rates. That euro move has left the market looking divided, however, on whether the single currency can fall further, whatever the ECB does next week. Policymakers at central banks in Australia, Canada and Britain also meet next week, and America's sometimes market-rattling monthly employment data will be published on June 6.
Technical
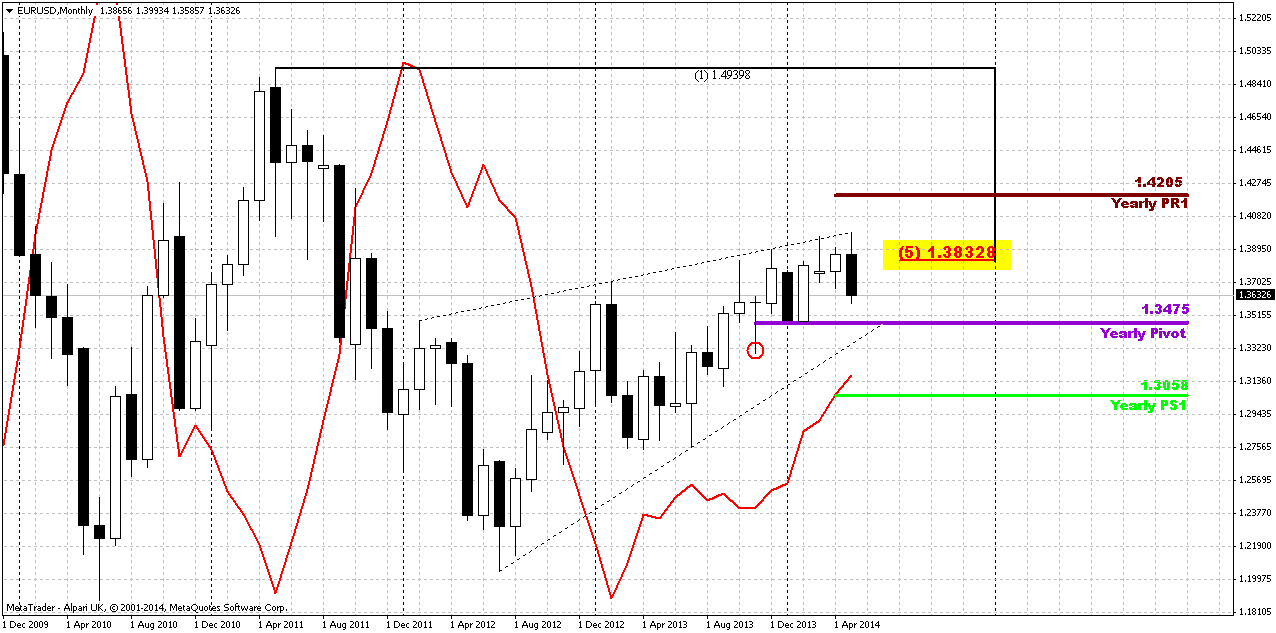
Although April was upward month, but overall action mostly should be classified as “inside” one to March range. Almost whole April price has spent in the same range. At the same time May action has shown its power and May is over now. Although this has happened not quite independently but having ECB hand in EUR dynamic, still, technically we’ve got reversal bar on monthly chart. We saw something cognate on February action, but it didn’t lead to any downward continuation. At the same time, currently situation is slightly different because there was no solid upward action in April, and now we have a month candle that has moved above April high and close below it’s low and this could lead at least to some downward continuation. Part of this work has been done already and is continued on recent week.
By looking at bigger picture, market stands in tight range since 2014. Thus, 1.33-1.3850 is an area of “indecision”. While market stands inside of it we can talk about neither upward breakout nor downward reversal. At least, reversal identification could be done with yearly pivot – if market will move below it, this could be early sign of changing sentiment. But, as you can see, nothing among this issues have happened yet.
Speaking about upward continuation, market mechanics does not allow price to show any deep retracement any more. Any move of this kind should be treated as market weakness and it will increase probability of reversal down. Take a look that as market has hit minor 0.618 AB-CD extension target right at former rock hard resistance – Fib level and Agreement and former yearly PR1, it has shown reasonable bounce down to 1.33. As retracement after 0.618 target already has happened, it is unlogical and unreasonable to see another deep bounce and if it will happen - it will look suspicious.
So, speaking about monthly upside targets... If we somehow will get finally real break through resistance, we have two major targets – AB=CD one around 1.44 and Yearly PR1 = 1.4205.
That’s being said, to change really big picture and long-term sentiment market will have to leave 1.3350-1.3850 area in one or other direction. While appearing of reversal May bar gives us confidence to suggest further downward action inside of 1.3350-1.3850 range by far.
Weekly
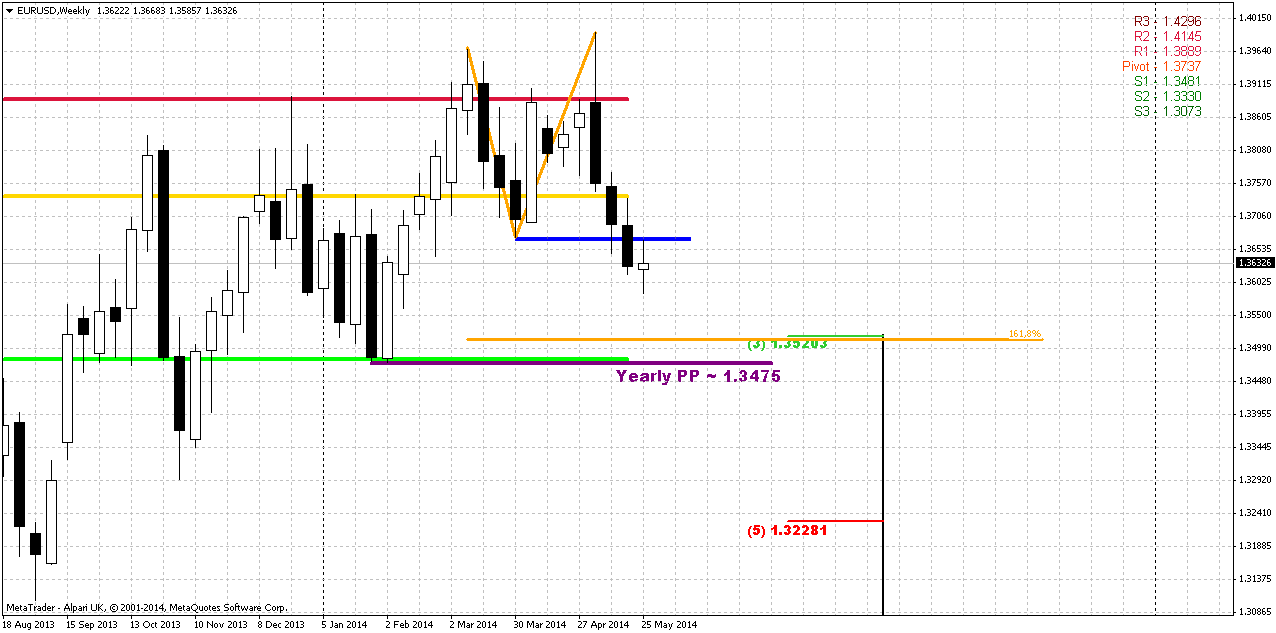
Trend is bearish on weekly frame, market is not at oversold. Recent week was some kind of pause or indecision since market has formed high wave pattern. It means that further direction will depend on breakout. The top of recent week coincides with former low and neckline of daily Double top pattern. Thus, market has re-tested neckline and bounce down. This is good sign for bears, especially with rumors on possible more ECB easing.
Another bearish sign is May pivots. Market has closed deeply below MPS1 and this means that here we have solid bearish trend. As we’ve got new pivots for June – they stand very interesting. As you can see we have rock hard support around Yearly pivot that is accompanied by Fib level 1.3520, Fib extension 1.618 support and take a look – June MPS1. This is probably nearest destination point. Currently I do not what to touch the topic of possible YPP breakout, but if this will happen – it could significantly enhance bears on long-term perspective.
That’s being said, weekly chart gives us two important issues that will be useful on coming week. First is a low if high wave pattern – breakout will lead to further downward action. Second – support around 1.35 area – this is our objective point by far.
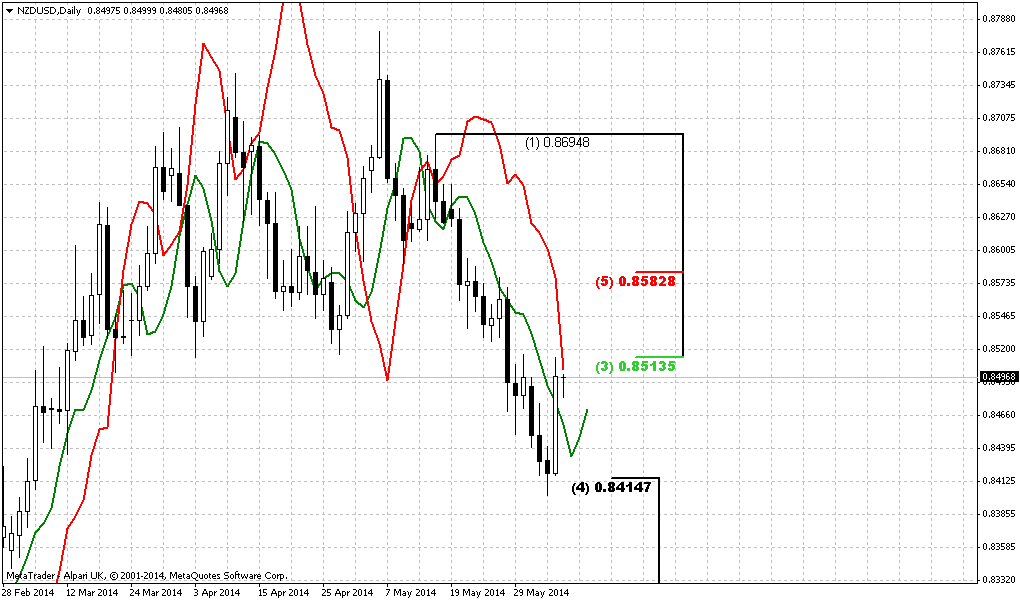
Daily
Trend is bearish here, EUR is not at daily oversold. We’ve got minor bounce up from 76.8% support as we’ve discussed guys, but this is not the point. Daily chart has a glossy secret and if we do not apply one well-known issue, that we also discussed in our Forex Military School, we will not find clear answer. Because if you take a look at current chart you can’t say – whether market will continue move up a bit more, or it will start move down, what levels will be crucial for current week, etc. We know only 1 thing here – 1.3740 is strong resistance and invalidation of Double Top. This is new MPP, Fib level and if EUR will move above it – it will create reversal swing. But this is not sufficient if you want to create solid trading plan for next week.
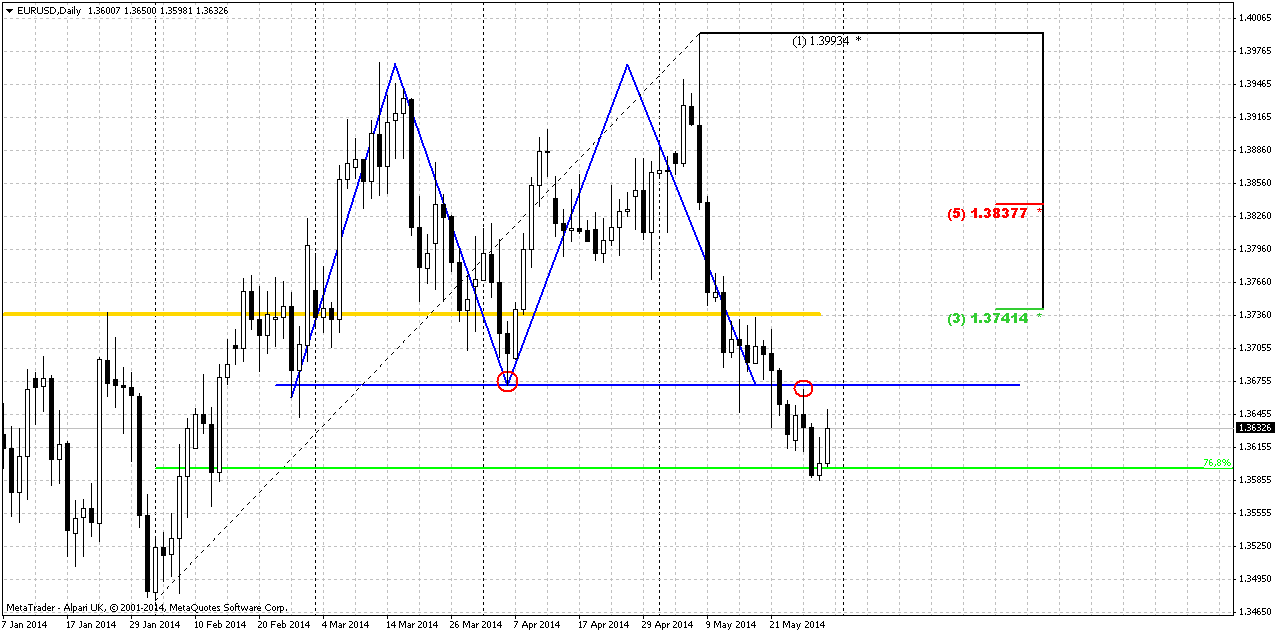
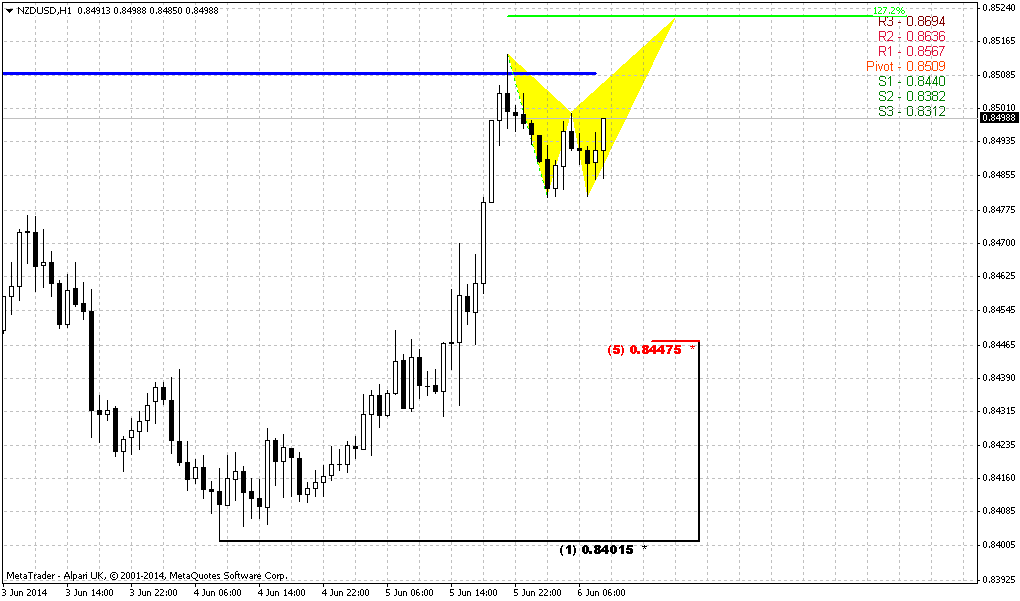
And now I’ll show you the same chart but on CHF. IT has one more detail that gives you huge advantage:
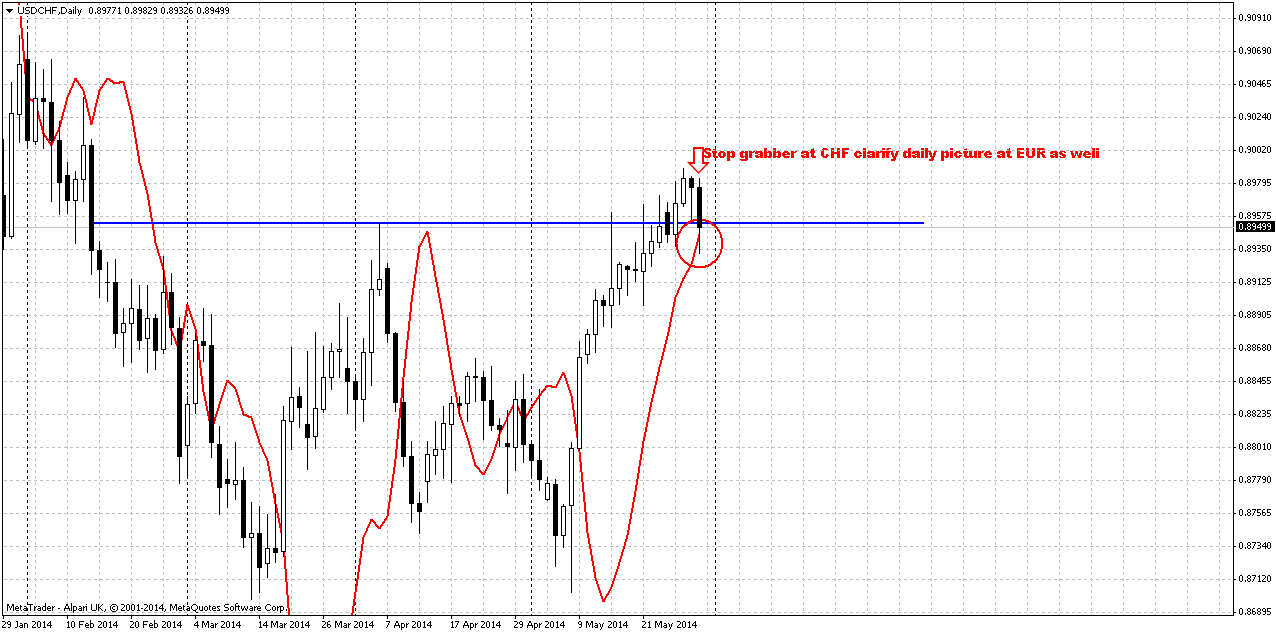
Franc has just one detail that EUR doesn’t. But this is the corner-stone of short term trading plan. This detail is bullish stop grabber. This means not just downward continuation. Recall – we have high wave on weekly. Moving below it’s low on EUR as it suggested by CHF grabber will lead to downward continuation. Another hint that grabber gives us – market will not probably show any deep retracement up (I mean EUR). Otherwise grabber will be erased. Taking into consideration these issues, looks like price is ready for downward action and this action probably will start immediately or at least without any preliminary deep upward retracement.
Finally speaking about DiNapoli framework – thrust is still suitable for direction patterns as B&B or DRPO, but it is difficult to say when it could start. The most suitable level for this is 1.35 support cluster, because market has to show solid retracement to complete DiNapoli patterns and this is possible only from strong supports. But right now market has no floor under its feet – no solid support levels till 1.3475-1.35 area.
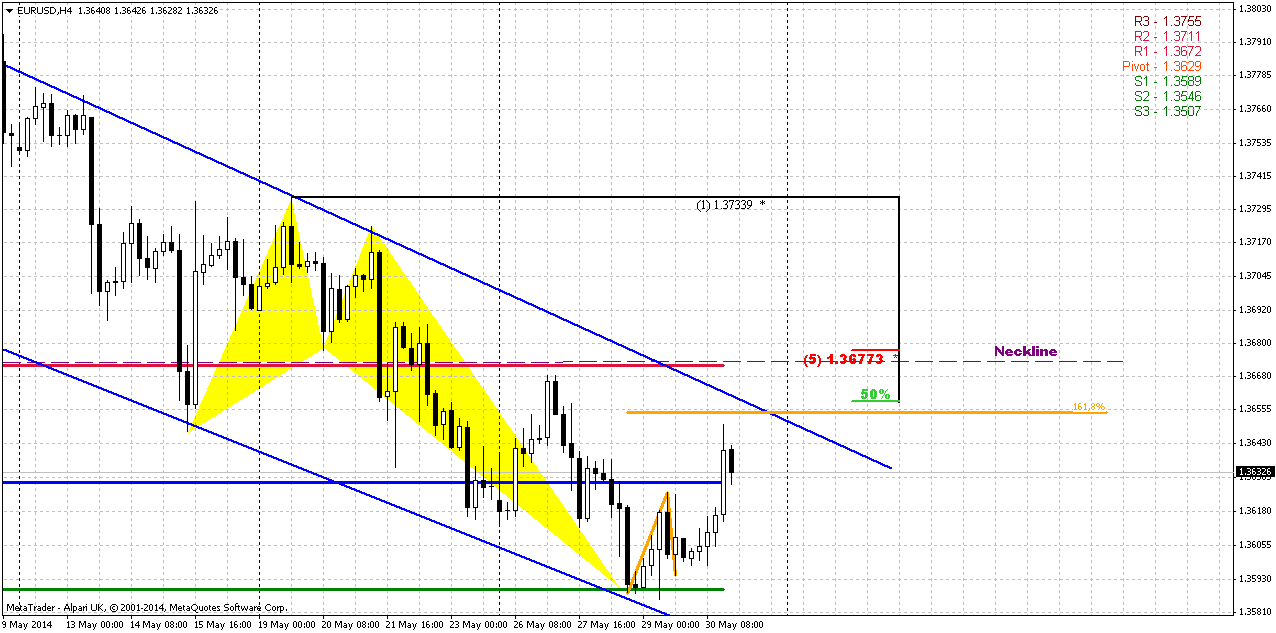
4-hour
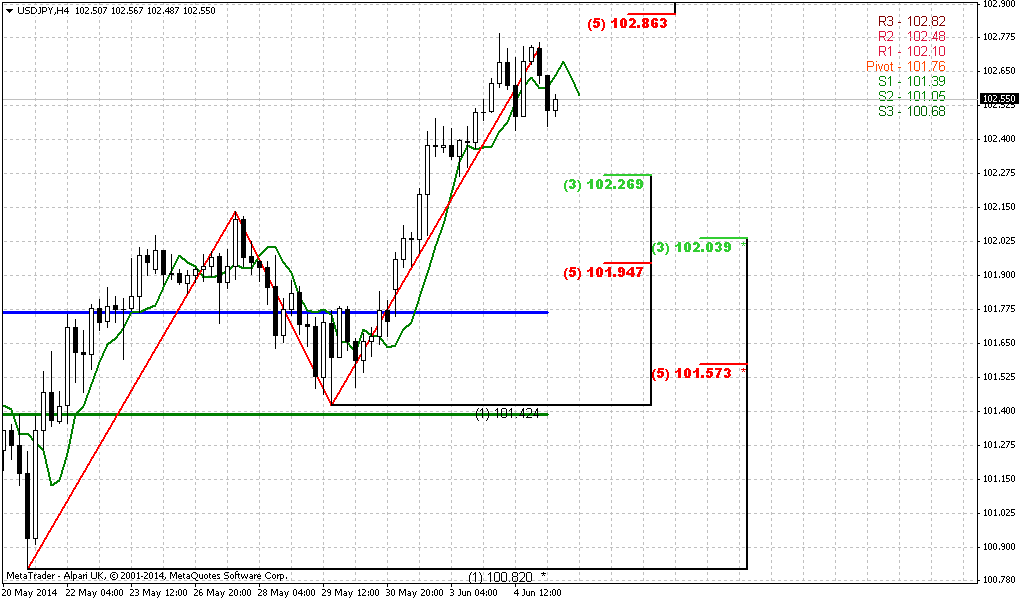
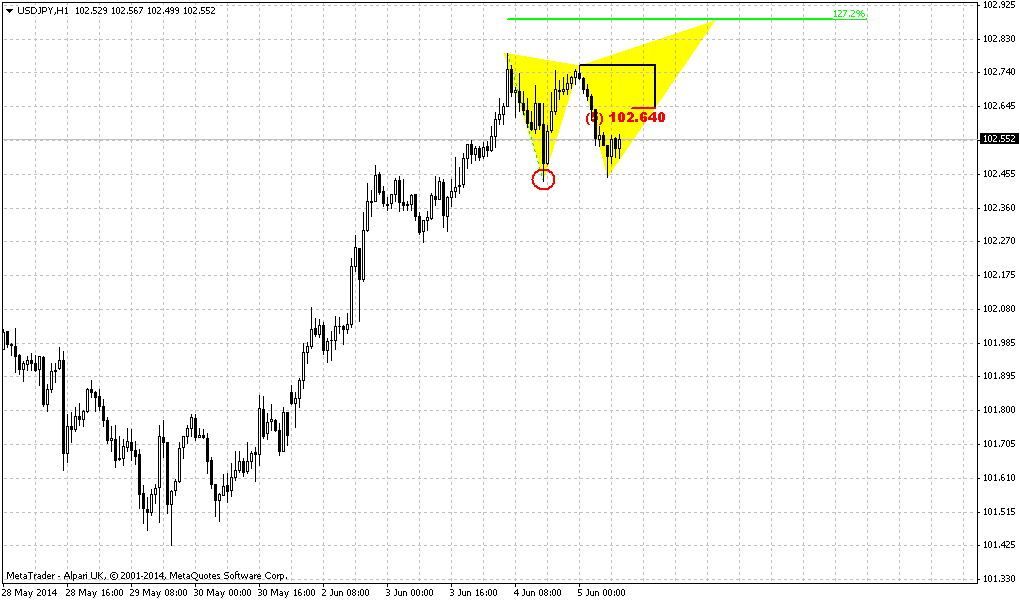
This chart sheds some light on possible action on Monday. Here is the puzzle. Recent top here around 1.3675 area is a top of weekly high wave, right? Hence market can fluctuate in this area, but not break through it – to keep bearish sentiment and solid chances on donward continuation. And we have solid protection of this area by WPR1 and neckline. And this is what we need – market could complete target of 3-Drive buy pattern here and simultaneously keep bearish sentiment, since even by completing the target – market will not break significant level.
Conversely, market could re-establish move down a bit earlier. Since price is moving inside downward channel, it is logical to suggest reaching of upper border. Current retracement up takes the shape of AB=CD and 1.618 extension coincides precisely with upper border.
This means that 1.3655-1.3685 is an area where we will be watching for possible bearish signs.
Conclusion:
While price stands in 1.33-1.38 area we can’t speak either on upward or downward breakout. To change really big picture market should have to show breakout out of it.
May has become a reversal month. This encourages us on expectation of more solid downward action inside 1.33-1.38 range.
In short-term perspective market should not show too deep retracement up right now and probably will continue move down. The only strong support around is 1.35 area. Rumors on more ECB easing will be press on EUR as well.
The technical portion of Sive's analysis owes a great deal to Joe DiNapoli's methods, and uses a number of Joe's proprietary indicators. Please note that Sive's analysis is his own view of the market and is not endorsed by Joe DiNapoli or any related companies.
The dollar retreated from recent highs against other major currencies and closed lower on Friday as traders braced for potentially market-moving meetings next week by the European Central Bank and other monetary policymakers. The dollar, as tracked by the U.S. dollar index of a half dozen currency pairs, was last off 0.18 percent at 80.353. Earlier this week, the index was at highs not seen since early April.
Volumes were light as currency traders tidied up books at the end of the month, according to Lane Newman, director of foreign exchange at ING Capital Markets in New York. The euro, which has lost 1.65 percent against the dollar during May, was also up on the day, 0.26 percent to $1.3637, after touching a daily low of $1.3599. "There's caution ahead of the event risk coming in the form of the central bank meetings. With May ending, that will likely make for low volatility today," said Shaun Osborne, chief foreign exchange strategist at TD Securities in Toronto. Attention in currency and other global markets is now firmly focused on next week's European Central Bank meeting, which is expected to deliver more policy easing. It comes as conviction has been shaken that the Bank of Japan would also take more action this summer, underpinning a rise for the yen to almost four-month highs against the euro.
Likewise, while the dollar has gained earlier this week, U.S. Treasury yields have fallen, and dealers said there was talk of some substantial fund option bets on the yen strengthening to as little as 98 per dollar over the next month. On Friday, the dollar traded at 101.75 yen, down 0.04 percent for the day.
The euro has fallen almost 3 percent against the dollar in just the past three weeks, hammered by expectations that the ECB will deliver a substantial blow by pumping more cash into the euro zone economy and lower market interest rates. That euro move has left the market looking divided, however, on whether the single currency can fall further, whatever the ECB does next week. Policymakers at central banks in Australia, Canada and Britain also meet next week, and America's sometimes market-rattling monthly employment data will be published on June 6.
Technical
Although April was upward month, but overall action mostly should be classified as “inside” one to March range. Almost whole April price has spent in the same range. At the same time May action has shown its power and May is over now. Although this has happened not quite independently but having ECB hand in EUR dynamic, still, technically we’ve got reversal bar on monthly chart. We saw something cognate on February action, but it didn’t lead to any downward continuation. At the same time, currently situation is slightly different because there was no solid upward action in April, and now we have a month candle that has moved above April high and close below it’s low and this could lead at least to some downward continuation. Part of this work has been done already and is continued on recent week.
By looking at bigger picture, market stands in tight range since 2014. Thus, 1.33-1.3850 is an area of “indecision”. While market stands inside of it we can talk about neither upward breakout nor downward reversal. At least, reversal identification could be done with yearly pivot – if market will move below it, this could be early sign of changing sentiment. But, as you can see, nothing among this issues have happened yet.
Speaking about upward continuation, market mechanics does not allow price to show any deep retracement any more. Any move of this kind should be treated as market weakness and it will increase probability of reversal down. Take a look that as market has hit minor 0.618 AB-CD extension target right at former rock hard resistance – Fib level and Agreement and former yearly PR1, it has shown reasonable bounce down to 1.33. As retracement after 0.618 target already has happened, it is unlogical and unreasonable to see another deep bounce and if it will happen - it will look suspicious.
So, speaking about monthly upside targets... If we somehow will get finally real break through resistance, we have two major targets – AB=CD one around 1.44 and Yearly PR1 = 1.4205.
That’s being said, to change really big picture and long-term sentiment market will have to leave 1.3350-1.3850 area in one or other direction. While appearing of reversal May bar gives us confidence to suggest further downward action inside of 1.3350-1.3850 range by far.
Weekly
Trend is bearish on weekly frame, market is not at oversold. Recent week was some kind of pause or indecision since market has formed high wave pattern. It means that further direction will depend on breakout. The top of recent week coincides with former low and neckline of daily Double top pattern. Thus, market has re-tested neckline and bounce down. This is good sign for bears, especially with rumors on possible more ECB easing.
Another bearish sign is May pivots. Market has closed deeply below MPS1 and this means that here we have solid bearish trend. As we’ve got new pivots for June – they stand very interesting. As you can see we have rock hard support around Yearly pivot that is accompanied by Fib level 1.3520, Fib extension 1.618 support and take a look – June MPS1. This is probably nearest destination point. Currently I do not what to touch the topic of possible YPP breakout, but if this will happen – it could significantly enhance bears on long-term perspective.
That’s being said, weekly chart gives us two important issues that will be useful on coming week. First is a low if high wave pattern – breakout will lead to further downward action. Second – support around 1.35 area – this is our objective point by far.
Daily
Trend is bearish here, EUR is not at daily oversold. We’ve got minor bounce up from 76.8% support as we’ve discussed guys, but this is not the point. Daily chart has a glossy secret and if we do not apply one well-known issue, that we also discussed in our Forex Military School, we will not find clear answer. Because if you take a look at current chart you can’t say – whether market will continue move up a bit more, or it will start move down, what levels will be crucial for current week, etc. We know only 1 thing here – 1.3740 is strong resistance and invalidation of Double Top. This is new MPP, Fib level and if EUR will move above it – it will create reversal swing. But this is not sufficient if you want to create solid trading plan for next week.
And now I’ll show you the same chart but on CHF. IT has one more detail that gives you huge advantage:
Franc has just one detail that EUR doesn’t. But this is the corner-stone of short term trading plan. This detail is bullish stop grabber. This means not just downward continuation. Recall – we have high wave on weekly. Moving below it’s low on EUR as it suggested by CHF grabber will lead to downward continuation. Another hint that grabber gives us – market will not probably show any deep retracement up (I mean EUR). Otherwise grabber will be erased. Taking into consideration these issues, looks like price is ready for downward action and this action probably will start immediately or at least without any preliminary deep upward retracement.
Finally speaking about DiNapoli framework – thrust is still suitable for direction patterns as B&B or DRPO, but it is difficult to say when it could start. The most suitable level for this is 1.35 support cluster, because market has to show solid retracement to complete DiNapoli patterns and this is possible only from strong supports. But right now market has no floor under its feet – no solid support levels till 1.3475-1.35 area.
4-hour
This chart sheds some light on possible action on Monday. Here is the puzzle. Recent top here around 1.3675 area is a top of weekly high wave, right? Hence market can fluctuate in this area, but not break through it – to keep bearish sentiment and solid chances on donward continuation. And we have solid protection of this area by WPR1 and neckline. And this is what we need – market could complete target of 3-Drive buy pattern here and simultaneously keep bearish sentiment, since even by completing the target – market will not break significant level.
Conversely, market could re-establish move down a bit earlier. Since price is moving inside downward channel, it is logical to suggest reaching of upper border. Current retracement up takes the shape of AB=CD and 1.618 extension coincides precisely with upper border.
This means that 1.3655-1.3685 is an area where we will be watching for possible bearish signs.
Conclusion:
While price stands in 1.33-1.38 area we can’t speak either on upward or downward breakout. To change really big picture market should have to show breakout out of it.
May has become a reversal month. This encourages us on expectation of more solid downward action inside 1.33-1.38 range.
In short-term perspective market should not show too deep retracement up right now and probably will continue move down. The only strong support around is 1.35 area. Rumors on more ECB easing will be press on EUR as well.
The technical portion of Sive's analysis owes a great deal to Joe DiNapoli's methods, and uses a number of Joe's proprietary indicators. Please note that Sive's analysis is his own view of the market and is not endorsed by Joe DiNapoli or any related companies.
 Now it has led to Stop Grabber & all seems very synchronous for next week! I will not be entering short hastily however as I noted AUD & GBP could yet see higher upward retracement before downward continuation.?? Sp'ba..


