Sive Morten
Special Consultant to the FPA
- Messages
- 18,699
Monthly
The dollar edged higher against a basket of major currencies on Friday after violence in Iraq triggered a safety bid for the U.S. currency, while a slight rise in U.S. bond yields underpinned the move. Escalating insurgent conflict in Iraq resulted in a cautious mood, while renewed focus on the potential for more monetary stimulus in Japan and an uptick in U.S. Treasury yields also drove demand for the dollar. "There may be a perception that the U.S. has less exposure to specific Middle East oil supply than perhaps Europe or Asia," Shahab Jalinoos, currency strategist at UBS in Stamford, Connecticut, said of the dollar's slight gains. Traders said violence in the second-largest OPEC producer has raised concerns of a sustained period of higher oil prices. They dismissed, meanwhile, data showing slightly weaker-than-expected U.S. consumer sentiment in June.
The dollar also advanced against the Japanese yen after traders reconsidered the potential for more monetary stimulus from the Bank of Japan. The central bank decided to keep monetary policy steady, but analysts said the potential for weaker economic growth in the second quarter could trigger more easing. "The market has a belief that the Bank of Japan could still come through with more monetary policy easing," said Jalinoos.
The euro, which has weakened since the European Central Bank's decision last Thursday to cut rates to record lows, edged lower against the dollar. Analysts said the ECB is likely to implement more monetary easing, while the U.S. Federal Reserve is moving toward tightening monetary policy. "The only thing that’s weighing on the euro is the promise to keep rates low for much longer than what the Fed is currently promising," said Axel Merk, president and chief investment officer of Palo Alto, California-based Merk Investments. The Fed's next policy meeting is next Tuesday and Wednesday, June 17-18.
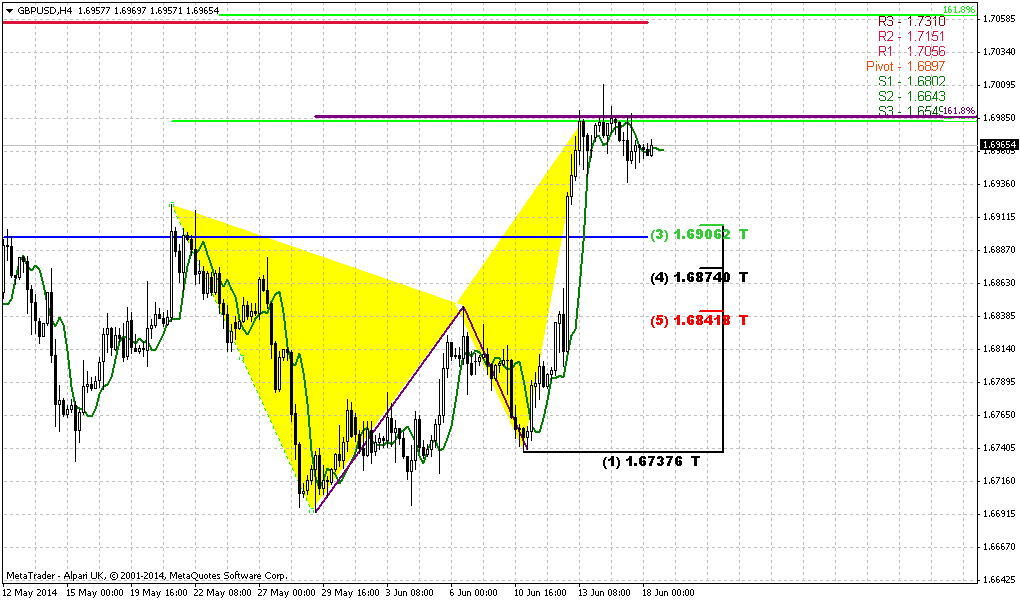
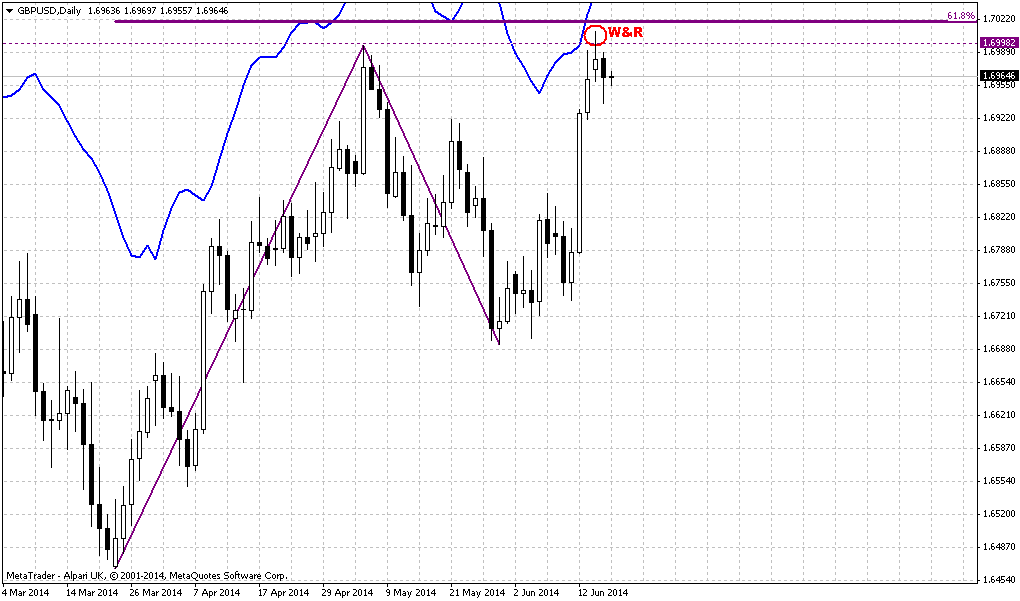
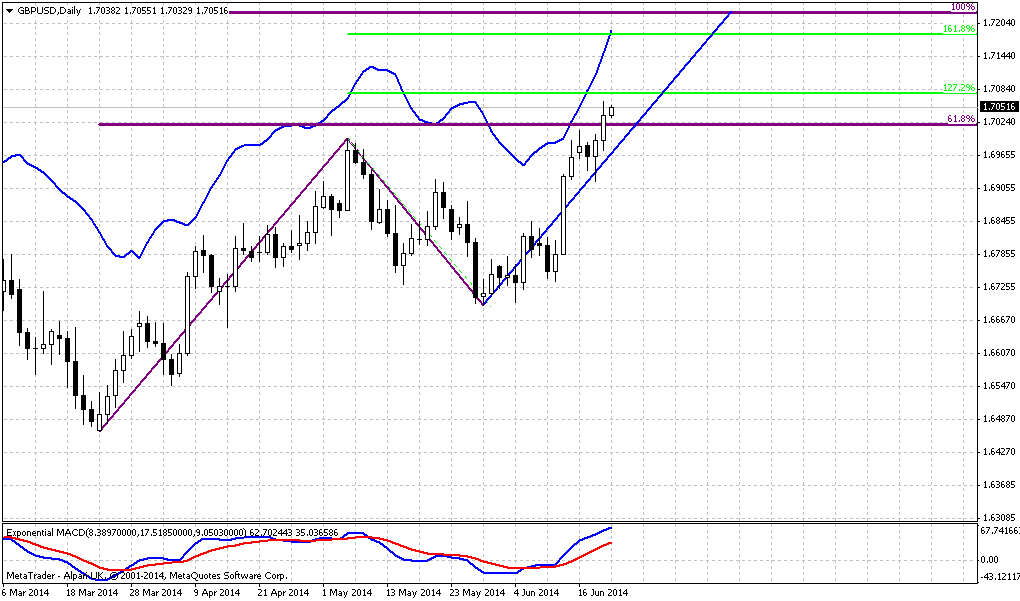
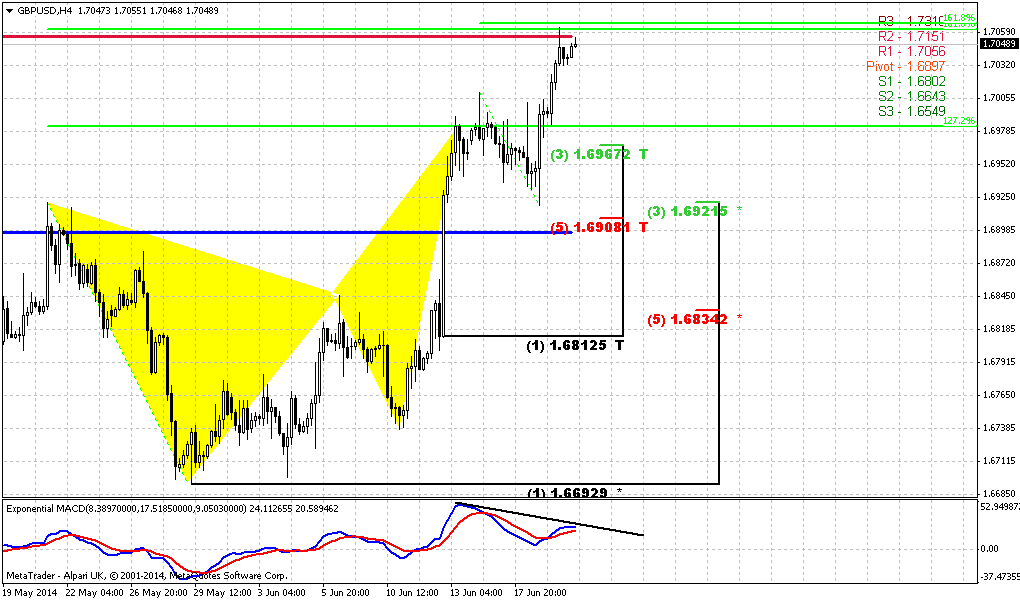
The preference for safety weighed on the New Zealand dollar , which was last down 0.22 percent at $0.8667 after having rallied to a near one-month high on Thursday. Sterling, meanwhile, extended gains after the Bank of England hinted on Thursday that interest rates could rise this year. Merk said traders took some profits in the New Zealand dollar but were reluctant to take big positions in other currencies ahead of the weekend, partly in response to the conflict in Iraq.
Benchmark 10-year U.S. Treasury notes were last down 4/32 in price to yield 2.6 percent, pressured slightly by a rise in UK gilts yields and on expectations of an earlier-than-expected Fed rate hike.
Technical
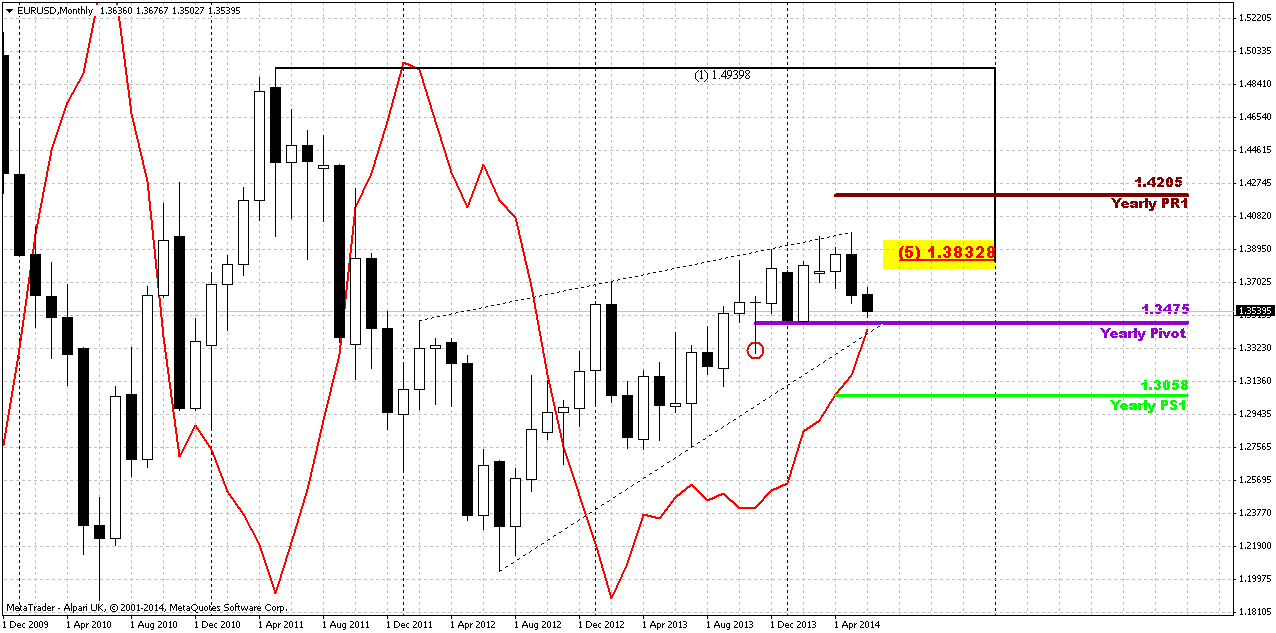
May action has shown its power. Although this has happened not quite independently but having ECB hand in EUR dynamic, still, technically we’ve got reversal bar on monthly chart. We saw something cognate on February action, but it didn’t lead to any downward continuation. At the same time, currently situation is slightly different because there was no solid upward action in April, and now we have a month candle that has moved above April high and close below it’s low and this could lead at least to some downward continuation. On recent week market has returned right back down to YPP area. Now market stands at very significant moment. It has closely approached to Yearly Pivot point and monthly MACDP. If we will get lucky, we could get clarification in June for extended period. Thus, appearing of bullish grabber right at YPP level definitely will tell us that market should exceed 1.40 level and probably even could reach YPR1~1.42 area. Conversely, failure at YPP will be great challenge on further downward action.
We’re speaking about both scenarios, because fundamental comments of current week do not show any agreement in investors’ opinion concerning EUR. Some analysts even think that until US applies dovish policy EUR depreciation will be limited despite how dovish ECB is. This also is confirmed by today’s comments on EUR. Analysts suggest that Fed will keep rates low for longer period then they hint on. The same Bernanke said on private dinners, as we once discussed on our research. Thus, with fundamental indecision we have to closely watch for definite patterns and key levels. Now they are YPP and potential grabber.
By looking at bigger picture, market stands in tight range since 2014. Thus, 1.33-1.3850 is an area of “indecision”. While market stands inside of it we can talk about neither upward breakout nor downward reversal. At least, reversal identification could be done with yearly pivot – if market will move below it, this could be early sign of changing sentiment. But, as you can see, nothing among this issues have happened yet.
That’s being said, market stands around crucial area and June could clarify what will happen next.
Weekly
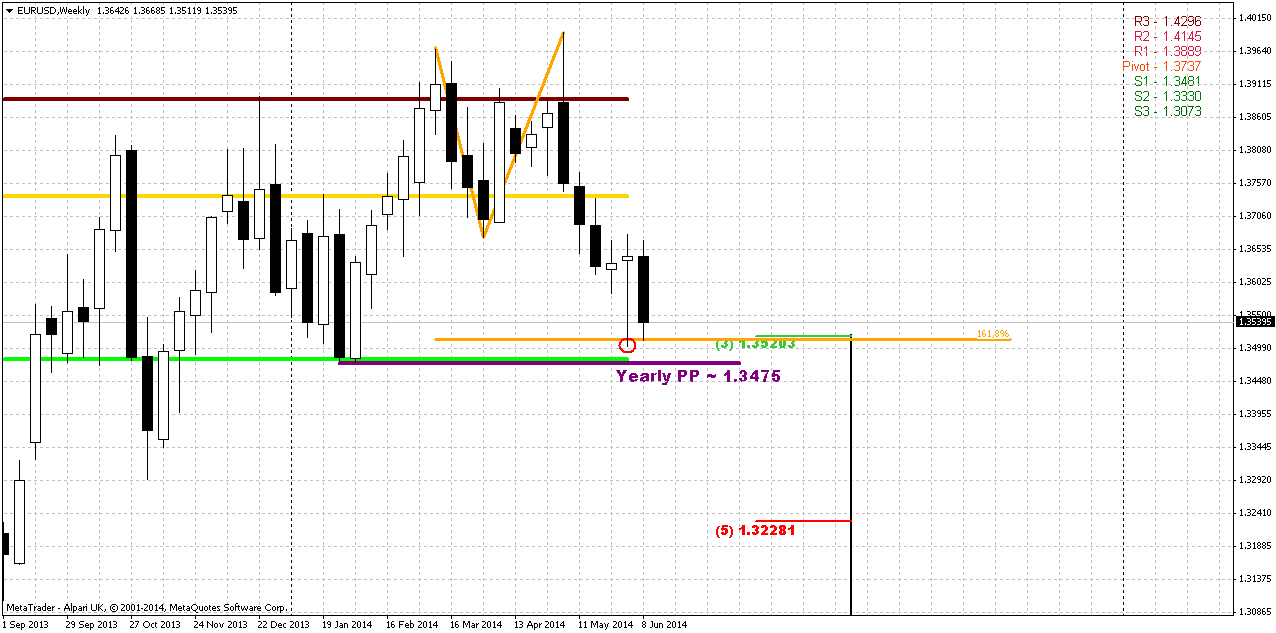
Weekly trend is bearish, but market is not at oversold. On recent week market has made an attempt to return right back down to lows and formed inside week. When market forms long candle it usually holds following price action for some time, because market needs to accustom to new range.
Right now situation on weekly chart is relatively simple. We have solid hammer pattern that stands upon strong support area – YPP, MPS1 and Fib level. Nearest perspecitve that we will deal with is respect of this level, i.e. bounce up. Medium term task is choosing a direction.
We will point on bearish trend only if market will move below YPP and take out lows of hammer pattern. This also will mean that monthly trend shifts bearish. Otherwise bullish perspective will dominate over market and there are some reasons for that. First is – weekly butterfly. Yes, market has hit 1.27 and shown 3/8 retracement, but this is not neccesary means the end of the game. As market will return right back up – it could mean that price will proceed to 1.618 target. Second – patterns on monthly, that we’ve just spoken about. I mean bullish grabber. But if even we will not get it, but market will continue move up this still will suggest existing of bullish sentiment, since price still will be above YPP and grabber has chances to appear on July as well... Fundamental speech relatively confirms this, because many analysts tell that this is not the question of dovish ECB and hawkish Fed – this is too simple, but the question of mismatch of Fed’s promises and real action on tighten policy. If it will appear that Fed is speaking and speaking on rising rates, but does not do this – this could shift force balance between EUR and USD.
So, currently let’s focus on first task – possible bounce up on coming week, while directional task we will monitor gradually through all following weekly researches.
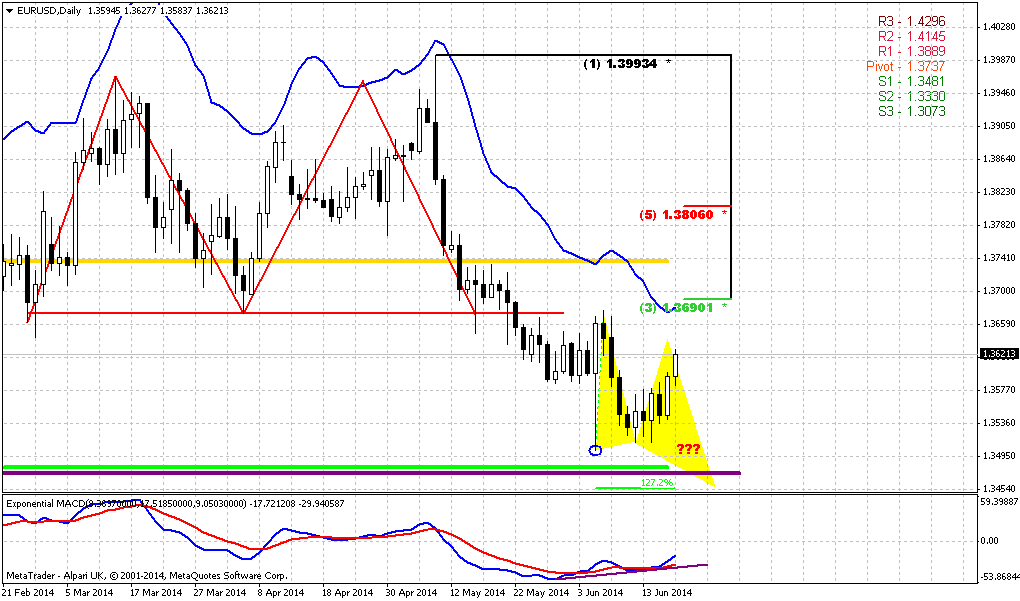
Daily
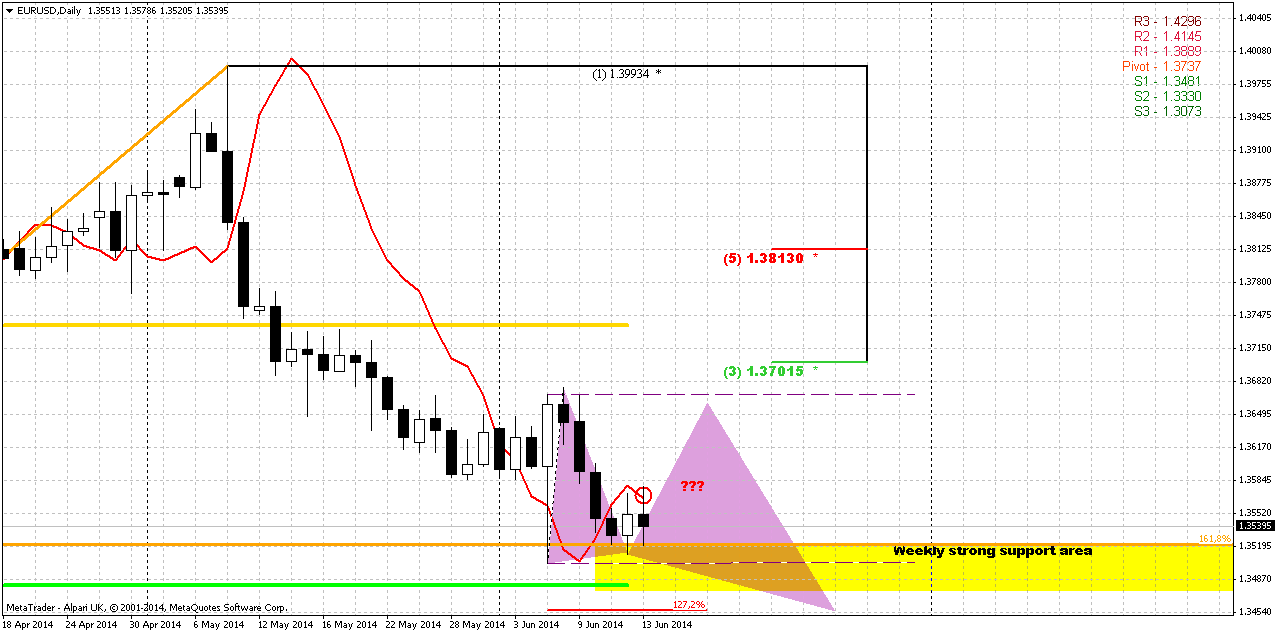
Situation on daily chart has not become clearer. It probably has become even more blur. At first glance context suggests deeper downward action. Long NFP candle, as we’ve said holds price action by far, market has reached upper border of support at 1.3520, but take a look, it has not turned to bounce up. What does it mean? May be it is too early, and we will see bounce a bit later? Or may be market is too heavy and it will continue move down, inside weekly support area? On Friday we’ve got bearish grabber, guys. We should not overestimate it, but I somehow feel that before any big moves market should test YPP again and MPS1. We would better use this grabber as indicator. Until market holds below its low – we’re watching on move at least to 1.3475. But what to do if market will erase grabber?
For that purpose I need to show you another chart – daily CHF.
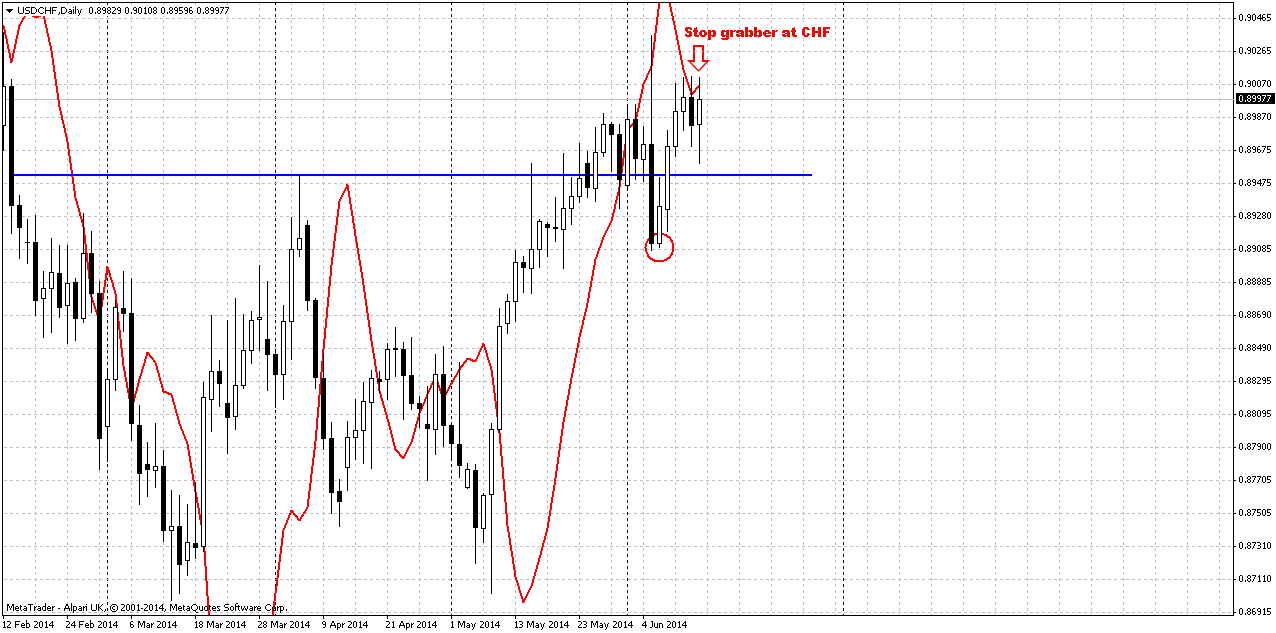
As you can see, here we have two bearish grabbers that point in opposite direction compares to EUR. Yes, EUR and CHF are not the same, but they are related currencies. And when you see opposite patterns – it should worry you. We need to see what pattern will be honest and which one is a fake. If grabber on EUR will be vanished we should be ready at least to deep upward retracement, since CHF grabbers suggest taking out of recent lows. This is also stands among the reasons, why I call you to not overestimate EUR’s grabber. Let’s use it as a tool for solving our tasks. It is not forbidden to trade it, but be sure that you control risk/reward on this trade.
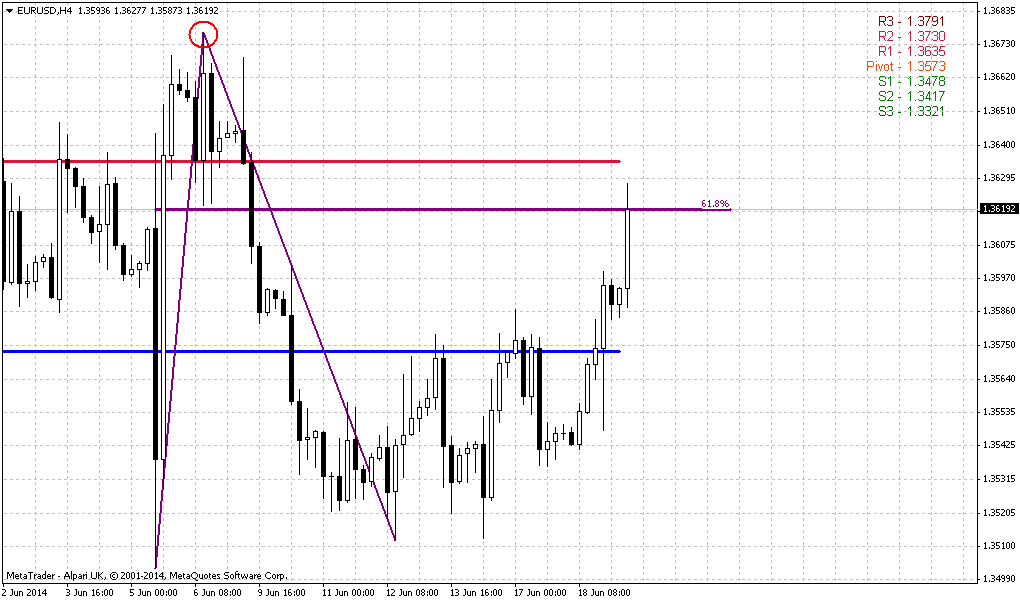
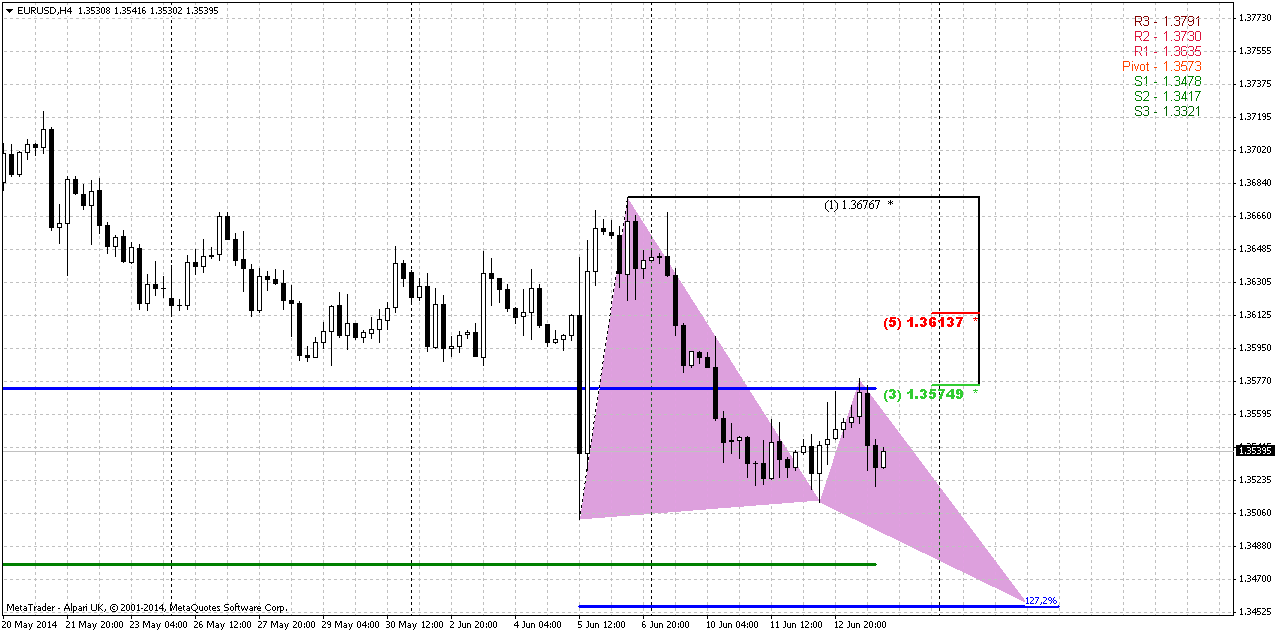
4-hour
Trend here is still bullish. Recent action suggests that market is heavy, because upward action was really hard, small candles, gradual action, while downward action was faster. If daily grabber will work, we might get this butterfly “buy” pattern that will complete our suggestion of possible reaching YPP at 1.3475 area. At the same time, market could show some AB=CD upward action to test new WPP and reach 50% resistance level, since EUR likes it. This is oposite scenario and suggests failure of EUR grabbers but applicability of CHF patterns. Also, guys you will find another grabber on 4-hour CHF in the same direction as daily CHF one.
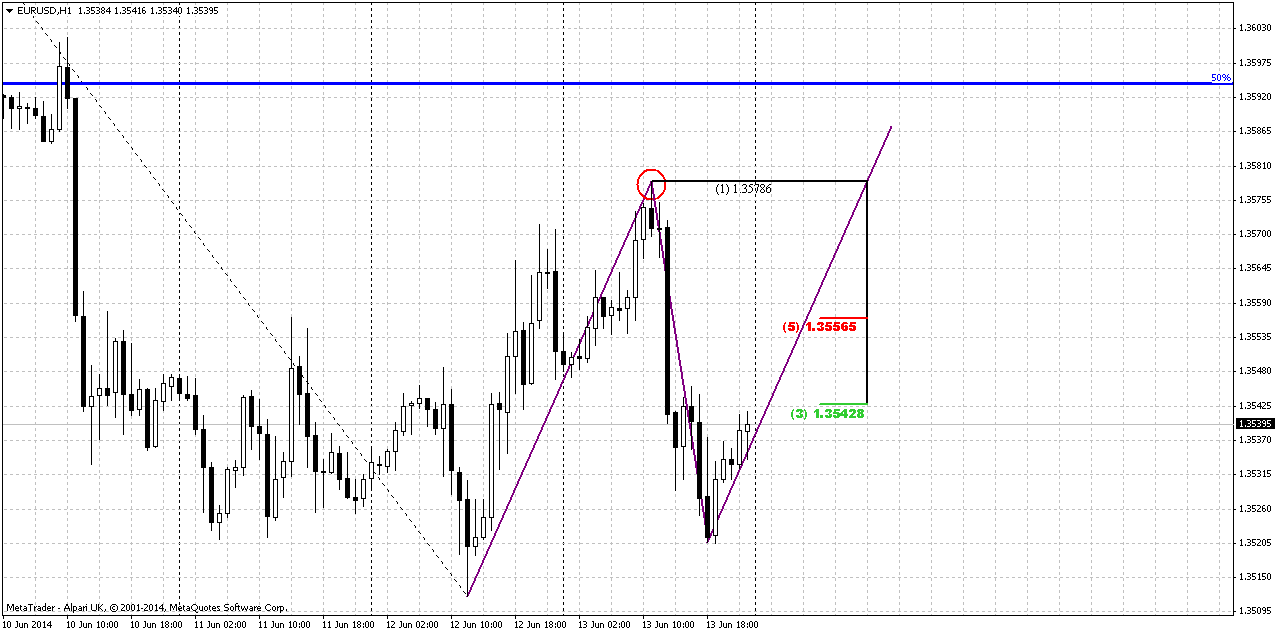
1-hour
Here we will try to combine them both – as daily grabber as possibility of higher retracement and testing of WPP. Actually, I do not believe much in possible AB-CD, mostly because BC leg is too extended down and it was very fast, even compares to AB leg. And such combination as weak AB and strong, deep BC leg leaves small room to possible deep upward action.
But still, if this really will happen and you intend to trade grabber – think about placing stop above 50% resistance level. This will let you to stay in game if grabber will fail but market will form “222” Sell and turn down then. If you still want to trade grabber - use fib levels for entry.
Finally, if this will not happen – we could get another smaller butterfly “Buy” here. Try to find it by yourself.
Conclusion:
While price stands in 1.33-1.38 area we can’t speak either on upward or downward breakout. To change really big picture market has to show breakout out of it. Still, market right now stands around crucial area – combination of YPP and monthly MACDP. Appearing of bullish grabber in June or July could resolve the riddle fast on further action. Conversely moving below YPP will shift monthly trend bearish as well and could lead to further EUR depreciation.
On coming week we mostly will deal with respect of current 1.3475-1.3520 support area. Situation is complicated by opposite patterns on CHF and EUR and some clarification should come on next week. May be this will happen on 17-18 of June Fed meeting. At the same time, we need to get some reversal pattern on daily that will become a starting point of upward reaction on strong support. But for that purpose market should probably test YPP again.
The technical portion of Sive's analysis owes a great deal to Joe DiNapoli's methods, and uses a number of Joe's proprietary indicators. Please note that Sive's analysis is his own view of the market and is not endorsed by Joe DiNapoli or any related companies.
The dollar edged higher against a basket of major currencies on Friday after violence in Iraq triggered a safety bid for the U.S. currency, while a slight rise in U.S. bond yields underpinned the move. Escalating insurgent conflict in Iraq resulted in a cautious mood, while renewed focus on the potential for more monetary stimulus in Japan and an uptick in U.S. Treasury yields also drove demand for the dollar. "There may be a perception that the U.S. has less exposure to specific Middle East oil supply than perhaps Europe or Asia," Shahab Jalinoos, currency strategist at UBS in Stamford, Connecticut, said of the dollar's slight gains. Traders said violence in the second-largest OPEC producer has raised concerns of a sustained period of higher oil prices. They dismissed, meanwhile, data showing slightly weaker-than-expected U.S. consumer sentiment in June.
The dollar also advanced against the Japanese yen after traders reconsidered the potential for more monetary stimulus from the Bank of Japan. The central bank decided to keep monetary policy steady, but analysts said the potential for weaker economic growth in the second quarter could trigger more easing. "The market has a belief that the Bank of Japan could still come through with more monetary policy easing," said Jalinoos.
The euro, which has weakened since the European Central Bank's decision last Thursday to cut rates to record lows, edged lower against the dollar. Analysts said the ECB is likely to implement more monetary easing, while the U.S. Federal Reserve is moving toward tightening monetary policy. "The only thing that’s weighing on the euro is the promise to keep rates low for much longer than what the Fed is currently promising," said Axel Merk, president and chief investment officer of Palo Alto, California-based Merk Investments. The Fed's next policy meeting is next Tuesday and Wednesday, June 17-18.
The preference for safety weighed on the New Zealand dollar , which was last down 0.22 percent at $0.8667 after having rallied to a near one-month high on Thursday. Sterling, meanwhile, extended gains after the Bank of England hinted on Thursday that interest rates could rise this year. Merk said traders took some profits in the New Zealand dollar but were reluctant to take big positions in other currencies ahead of the weekend, partly in response to the conflict in Iraq.
Benchmark 10-year U.S. Treasury notes were last down 4/32 in price to yield 2.6 percent, pressured slightly by a rise in UK gilts yields and on expectations of an earlier-than-expected Fed rate hike.
Technical
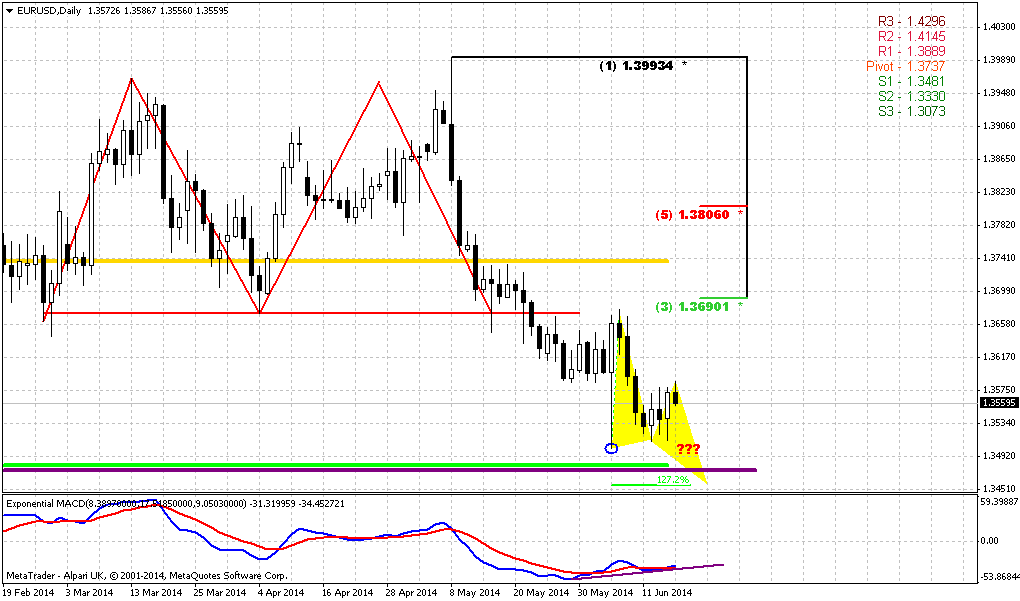
May action has shown its power. Although this has happened not quite independently but having ECB hand in EUR dynamic, still, technically we’ve got reversal bar on monthly chart. We saw something cognate on February action, but it didn’t lead to any downward continuation. At the same time, currently situation is slightly different because there was no solid upward action in April, and now we have a month candle that has moved above April high and close below it’s low and this could lead at least to some downward continuation. On recent week market has returned right back down to YPP area. Now market stands at very significant moment. It has closely approached to Yearly Pivot point and monthly MACDP. If we will get lucky, we could get clarification in June for extended period. Thus, appearing of bullish grabber right at YPP level definitely will tell us that market should exceed 1.40 level and probably even could reach YPR1~1.42 area. Conversely, failure at YPP will be great challenge on further downward action.
We’re speaking about both scenarios, because fundamental comments of current week do not show any agreement in investors’ opinion concerning EUR. Some analysts even think that until US applies dovish policy EUR depreciation will be limited despite how dovish ECB is. This also is confirmed by today’s comments on EUR. Analysts suggest that Fed will keep rates low for longer period then they hint on. The same Bernanke said on private dinners, as we once discussed on our research. Thus, with fundamental indecision we have to closely watch for definite patterns and key levels. Now they are YPP and potential grabber.
By looking at bigger picture, market stands in tight range since 2014. Thus, 1.33-1.3850 is an area of “indecision”. While market stands inside of it we can talk about neither upward breakout nor downward reversal. At least, reversal identification could be done with yearly pivot – if market will move below it, this could be early sign of changing sentiment. But, as you can see, nothing among this issues have happened yet.
That’s being said, market stands around crucial area and June could clarify what will happen next.
Weekly
Weekly trend is bearish, but market is not at oversold. On recent week market has made an attempt to return right back down to lows and formed inside week. When market forms long candle it usually holds following price action for some time, because market needs to accustom to new range.
Right now situation on weekly chart is relatively simple. We have solid hammer pattern that stands upon strong support area – YPP, MPS1 and Fib level. Nearest perspecitve that we will deal with is respect of this level, i.e. bounce up. Medium term task is choosing a direction.
We will point on bearish trend only if market will move below YPP and take out lows of hammer pattern. This also will mean that monthly trend shifts bearish. Otherwise bullish perspective will dominate over market and there are some reasons for that. First is – weekly butterfly. Yes, market has hit 1.27 and shown 3/8 retracement, but this is not neccesary means the end of the game. As market will return right back up – it could mean that price will proceed to 1.618 target. Second – patterns on monthly, that we’ve just spoken about. I mean bullish grabber. But if even we will not get it, but market will continue move up this still will suggest existing of bullish sentiment, since price still will be above YPP and grabber has chances to appear on July as well... Fundamental speech relatively confirms this, because many analysts tell that this is not the question of dovish ECB and hawkish Fed – this is too simple, but the question of mismatch of Fed’s promises and real action on tighten policy. If it will appear that Fed is speaking and speaking on rising rates, but does not do this – this could shift force balance between EUR and USD.
So, currently let’s focus on first task – possible bounce up on coming week, while directional task we will monitor gradually through all following weekly researches.
Daily
Situation on daily chart has not become clearer. It probably has become even more blur. At first glance context suggests deeper downward action. Long NFP candle, as we’ve said holds price action by far, market has reached upper border of support at 1.3520, but take a look, it has not turned to bounce up. What does it mean? May be it is too early, and we will see bounce a bit later? Or may be market is too heavy and it will continue move down, inside weekly support area? On Friday we’ve got bearish grabber, guys. We should not overestimate it, but I somehow feel that before any big moves market should test YPP again and MPS1. We would better use this grabber as indicator. Until market holds below its low – we’re watching on move at least to 1.3475. But what to do if market will erase grabber?
For that purpose I need to show you another chart – daily CHF.
As you can see, here we have two bearish grabbers that point in opposite direction compares to EUR. Yes, EUR and CHF are not the same, but they are related currencies. And when you see opposite patterns – it should worry you. We need to see what pattern will be honest and which one is a fake. If grabber on EUR will be vanished we should be ready at least to deep upward retracement, since CHF grabbers suggest taking out of recent lows. This is also stands among the reasons, why I call you to not overestimate EUR’s grabber. Let’s use it as a tool for solving our tasks. It is not forbidden to trade it, but be sure that you control risk/reward on this trade.
4-hour
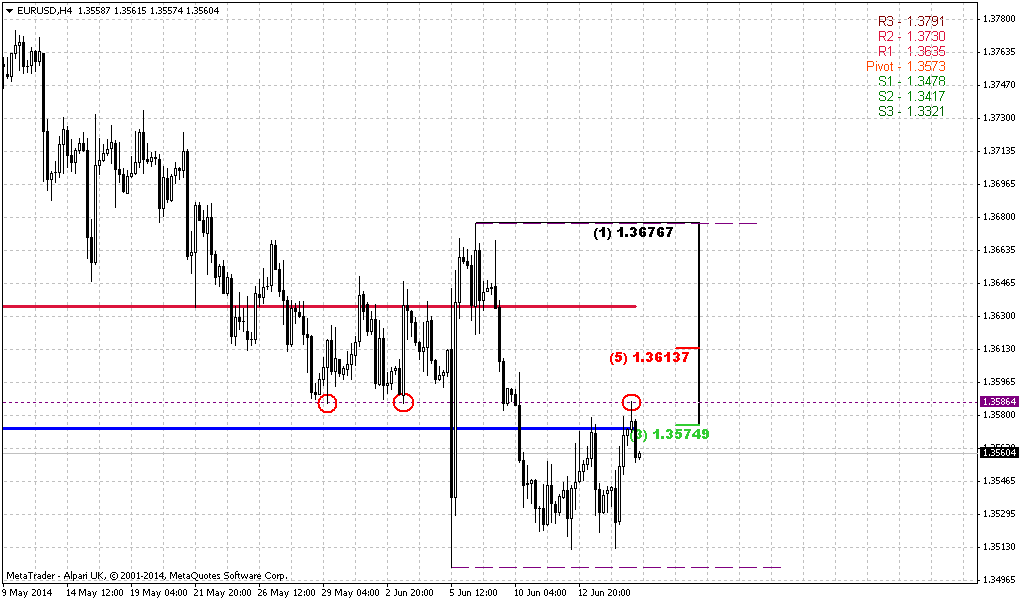
Trend here is still bullish. Recent action suggests that market is heavy, because upward action was really hard, small candles, gradual action, while downward action was faster. If daily grabber will work, we might get this butterfly “buy” pattern that will complete our suggestion of possible reaching YPP at 1.3475 area. At the same time, market could show some AB=CD upward action to test new WPP and reach 50% resistance level, since EUR likes it. This is oposite scenario and suggests failure of EUR grabbers but applicability of CHF patterns. Also, guys you will find another grabber on 4-hour CHF in the same direction as daily CHF one.
1-hour
Here we will try to combine them both – as daily grabber as possibility of higher retracement and testing of WPP. Actually, I do not believe much in possible AB-CD, mostly because BC leg is too extended down and it was very fast, even compares to AB leg. And such combination as weak AB and strong, deep BC leg leaves small room to possible deep upward action.
But still, if this really will happen and you intend to trade grabber – think about placing stop above 50% resistance level. This will let you to stay in game if grabber will fail but market will form “222” Sell and turn down then. If you still want to trade grabber - use fib levels for entry.
Finally, if this will not happen – we could get another smaller butterfly “Buy” here. Try to find it by yourself.
Conclusion:
While price stands in 1.33-1.38 area we can’t speak either on upward or downward breakout. To change really big picture market has to show breakout out of it. Still, market right now stands around crucial area – combination of YPP and monthly MACDP. Appearing of bullish grabber in June or July could resolve the riddle fast on further action. Conversely moving below YPP will shift monthly trend bearish as well and could lead to further EUR depreciation.
On coming week we mostly will deal with respect of current 1.3475-1.3520 support area. Situation is complicated by opposite patterns on CHF and EUR and some clarification should come on next week. May be this will happen on 17-18 of June Fed meeting. At the same time, we need to get some reversal pattern on daily that will become a starting point of upward reaction on strong support. But for that purpose market should probably test YPP again.
The technical portion of Sive's analysis owes a great deal to Joe DiNapoli's methods, and uses a number of Joe's proprietary indicators. Please note that Sive's analysis is his own view of the market and is not endorsed by Joe DiNapoli or any related companies.