FOREX PRO WEEKLY June 16-20, 2014

Eurusd
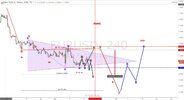
small butterfly
eurusd 1 hr.jpg
 
Minimax dear
see all gbpusd-audusd-nzdusd- same pattern a small butterfly then a big one
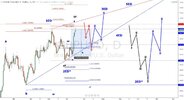
Audusd
View attachment 15170

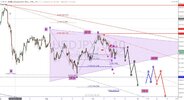
Gbpusd
View attachment 15171

Lolly

Regarding your gbpusd harmonic just want to tell you and community about my approach to harmonics..
I never, or very rarely (depends on the structure I follow), use as start (X) significant H/L point which is mid part of another leg..hope will tell clear enough:
- on the way down that X was peak of wave b on daily, as single leg on weekly, either Flat or ZZ
- I measure as X in such case only HH

I think this leg up is too steep or better whole down&up...2ED is usualy either long either broad but this is one is not deep (50%) and very narrow...so there are 2 options:
- bulls will win strongly and as 4ED will be used this week candle sometime in near future of about 3-4 weks(check weekly)
- bears will win and this down/up is a&b of Flat, target of cF would be below 1,66917, what would make 2ED broader and deeper..

Good luck!


ps
check this, here is shown when mid point could be used as start of pattern
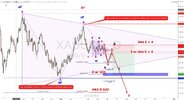
 
Last edited:
Gold Daily insight

I think everything goes ok so far and gold might be best to check adjustments..

Price hit 1283,20 low what could mean high is in place either as 2ED or maybe as X of DZZ..steep leg up might also be read as wave a so we could get another peak but I do not believe in...I expect that leg down will unfold in last ZZ of 5ED with possible extended 5th of c and target in 1120 zone..if stops in 1190 zone that could be D of triangle but more probable 1ED on weekly..
Weekly and daily do not fit very nicely so I put black labeling how this could be read out of weekly swings BUT if price goes below last low, situation might change..

Good trading!


20140617_gold_daily_0633.jpg
 
Euro Daily insight

a bit about euro..

This congestion is tricky! It is possible Flat already topped or could go much higher and if topped could be b or less probable 2 because wave would be too extended and would suggest big volatility ..i think is more probable price will go higher in cF..lets see what happens if price comes at current lows...we might get more complex correction and more sideways..

Good trading!

20140617_eurusd_H4_0720.jpg
 
usdjpy

Cogestion is hidding in the shadow of one daily candle..could be read as triangle and current move up would be ECT=b...break above ACT would mean we go higher and we might form bigger CT or whatever..

Good trading!

.
20140617_usdjpy_H4_0748.jpg

ps
for ECT = b price has to go up to touch low of w at 102,107 AND not to break 102,129...hehe, extremely small stop...
 
Last edited:
gbpusd

Here is also tricky...

I marked last week candle and current low of this week´s candle...cable has announcements in 90 minutes and it might jumped up, but I expect more or less W&R and pullback to confirm w point because only such development would assure this move up unfolds as DZZ 3ED, IF not drop below 1,66917 in what I am more&more sceptical..
Maybe thrust up with W&R brings some diNapoli pattern...

Good trading!

20140617_gbpusd_daily_0857.jpg
 
usoil

price action suggests 3ED could be in place..congestion in the middle of last leg up warns this move could unfold as 5 waves, although I am sceptical, and because of very short potentialy 3rd wave 5th could extend...
If 3ED is in place that would suggest dollar strenghtening..

20140617_usoil_daily_0909.jpg
 
usdjpy

price broke 102,127...so, most probable TZZ 3ED is developing...triangle has weekly swings problem, do not match with daily swings, so I find it not so probable..

Good trading!

20140618_usdjpy_H4_0916.jpg
 
Back
Top