Sive Morten
Special Consultant to the FPA
- Messages
- 18,760
Monthly
As Reuters reports, the U.S. dollar slipped on Friday against a basket of major currencies to post a second week of losses after positive data on consumer sentiment failed to boost expectations for a rise in interest rates any time soon. The Thomson Reuters/University of Michigan's final June reading on the overall index on consumer sentiment came in at 82.5, up from 81.9 the month before and above the median forecast of 82.0 among economists polled by Reuters. Analysts said the upbeat consumer sentiment data left traders cold since it failed to dispel worries about the U.S. economy after data on Thursday showed slightly weaker-than-expected data on consumer spending in May. "The data is not shaking anybody's expectations in terms of the pace of tightening from the Fed," said Sebastien Galy, currency strategist at Societe Generale in New York, in reference to the Federal Reserve's timeline for raising interest rates from rock-bottom levels.
New Zealand dollar extended gains on traders' appetite for higher-yielding currencies and was last up 0.16 percent against the dollar to trade at $0.8775. Analysts said the yen gained following better-than-expected Japanese retail sales data, which diminished concerns of further monetary stimulus from the Bank of Japan. The government data showed Japanese retail sales fell 0.4 percent in May from a year earlier, which was better than economists' median estimate for a 1.8 percent drop in a Reuters poll. The data came after the government raised the national sales tax to 8 percent from 5 percent on April 1. "Indications are that maybe the economy is weathering this consumption tax pretty well so far," said Win Thin, head of emerging markets currency strategy with Brown Brothers Harriman in New York.
Traders looked ahead to the U.S. government's non-farm payrolls report for June, due for release on July 3. The government is expected to have added 210,000 jobs in June, down slightly from the prior month, according to a Reuters poll of economists.
The dollar continued to slide despite a slight increase in benchmark U.S. government bond yields. Benchmark 10-year U.S. Treasury notes were last down 3/32 in price to yield 2.53 percent.
Technical
Although in May EUR has formed monthly reversal candle, but in recent time downward action has slowed significantly. As you can ee within recent 2-3 weeks monthly picture hardly changes significantly. Recently market has returned right back down to YPP area and flirts around it since then. EUR now stands at very significant moment. It has closely approached to Yearly Pivot point and monthly MACDP. If we will get lucky, we could get clarification in June-July for extended period. Thus, appearing of bullish grabber right at YPP level definitely will tell us that market should exceed 1.40 level and probably even could reach YPR1~1.42 area. Conversely, failure at YPP will be great challenge on further downward action.
We’re speaking about both scenarios, because right now fundamental comments do not show any agreement in investors’ opinion concerning EUR. Some analysts even think that until US applies dovish policy EUR depreciation will be limited despite how dovish ECB is. Analysts suggest that Fed will keep rates low for longer period then they hint on. Thus, with fundamental indecision we have to closely watch for definite patterns and key levels. Now they are YPP and potential grabber.
By looking at bigger picture, market stands in tight range since 2014. Thus, 1.33-1.3850 is an area of “indecision”. While market stands inside of it we can talk about neither upward breakout nor downward reversal. At least, reversal identification could be done with yearly pivot – if market will move below it, this could be early sign of changing sentiment. But, as you can see, nothing among this issues have happened yet.
That’s being said, market stands around crucial area and June or July could clarify what will happen next.

Weekly
Weekly trend is bearish, but market is not at oversold. Previously market has made an attempt to return right back down to lows and formed inside week. Now we have another one – thus, EUR stands tight third week in a row. When market forms long candle it usually holds following price action for some time, because market needs to accustom to new range. At the same time this will increase potential energy of breakout. After flat placing market breaks with additional power. Recent week has not become an exception and market still stands inside the same range. Situation is changing slowly by far.
Right now situation on weekly chart is relatively simple. We have solid hammer pattern that stands upon strong support area – YPP, MPS1 and Fib level. Nearest perspecitve that we will deal with is respect of this level, i.e. bounce up. Medium term task is choosing a direction.
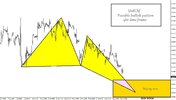
We will point on bearish trend only if market will move below YPP and take out lows of hammer pattern. This also will mean that monthly trend shifts bearish. Otherwise bullish perspective will dominate over market and there are some reasons for that. First is – weekly butterfly of May-June 2013. Yes, market has hit 1.27 and shown 3/8 retracement, but this is not neccesary mean the end of the game. As market will return right back up – it could mean that price will proceed to 1.618 target. Second – patterns on monthly, that we’ve just spoken about. I mean bullish grabber. But if even we will not get it, but market will continue move up this still will suggest existing of bullish sentiment, since price still will be above YPP and grabber has chances to appear on July as well...
Fundamental talks indirectly confirm this, because many analysts tell that this is not the question of dovish ECB and hawkish Fed – this is too simple, but the question of mismatch of Fed’s promises and real action on tighten policy. If it will appear that Fed is speaking and speaking on rising rates, but does not do this – this could shift force balance between EUR and USD.
We already see this. Despite recent nice economy data Fed does not hurry to hint on possible rate hiking, mostly because Mrs. Yellen is a follower of theory that unemployment creates additional pressure on inflation. As more people remain unemployed as more supply on job market. This extraordinary supply presses on wages. As wages stand flat – no inflation appears, hence no neccesity in rate hiking. As a result, we can make a conclusion that Fed would like to get positive NFP data for longer period. they need to see contraction of extraordinary employees supply, and, wages in turn, will show some tendency to grow.
Currently, only geopolitical tensions, probably could drive dollar higher, mostly Iraq. But unfortunately we can’t estimate the strength and timing of this geoplitical impact.
Anyway, let’s trade what we already have in place and focus on first task – action around strong weekly support, while directional task we will monitor gradually through all following weekly researches.

Daily
As Mr. Bilbo said – “change coming slowly, if it comes at all”. Our previous analysis stands for upward continuation by some reasons, but we thought it should be a bit faster. Still, as a result of previous week we’ve got five lazy days with flat upward angle. At the same time, the length of this lazy action is also an advantage. We can understand the nature of this motion and it tells us that this is not the trend. It has too flat angle, too deep retracements day by day, small trading ranges, etc. This is retracement guys that could stand due indecision or some expectations.
Besides, despite bullish trend we do not see any solid upward action and market mostly stands flat since beginning of June. This also might be a bearish dynamic pressure.
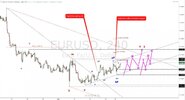
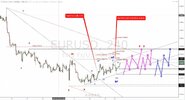
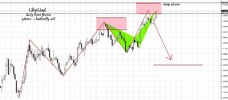
At the same time market slowly but stubbornly approaches to our point, where, as we think, downward reversal should happen, and market should start forming right wing of the butterfly. This will be primary object in the beginning of the week.

Swiss franc also has reached minimum target of grabbers and taken out recent lows.

That is what we’ve talked about – although CHF and EUR are related currencies, it is not neccesary that they have to move on equal distances. They have the same direction, while distances could be different. And that is what we see – EUR stands below previous top, while CHF has taken out recent low and completed short-term target. Now is a question – whether EUR will turn to YPP again...
4-hour
On recent week we’ve explained why we think that market should continue climbing to 1.3655-1.3675 area. Mostly because it has untouched 1.618 target and upward thrust of AB-CD pattern was really solid. This has happened and market has moved for 100 pips to the upside. Still, what do we see here? Price still has not reached this 1.618 extended objective point. As now we stand much closer to it, probably market should done with it in the beginning of the week. This is first step of our trading plan on coming week:
Wait reaching of 1.3655 target and watch for possible downward reversal somewhere between 1.3655 and WPR1=1.3675 area. This is the only range that is acceptable for us. Any other upward action will vanish daily butterfly, since it’s invalidation point is 1.3676.

1-hour
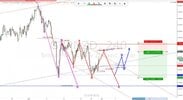
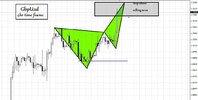
It would be perfect if market will form reversal pattern that could let us to enter short. If even chances on success will be not very impressive – perspective to enter short somewhere around 1.3660 with 20-25 pips stop and 150+ pips potential, looks attractive per se. But pattern could be formed differently. Here I’ve drawn most conservative picture – EUR forms small butterfly with 1.27 extension around 1.618 AB=CD target. But potentially market could move higher and closer to WPR1 by 2 reasons. First, it could complete greater butterfly with start point not at 1.3641 but on 1.3651 top. Second – if market will show retracement on Monday to some support – it could form even greater butterfly although it will have the same 1.27 point around WPR1.

Conclusion:
While price stands in 1.33-1.38 area we can’t speak either on upward or downward breakout. To change really big picture market has to show breakout out of it. Still, market right now stands around crucial area – combination of YPP and monthly MACDP. Appearing of bullish grabber in June or July could resolve the riddle on further action. Conversely moving below YPP will shift monthly trend bearish as well and could lead to further EUR depreciation. Currently economy factors mostly point of further dollar weakness as Fed drags out even hints on possible rate hiking. Only some geopolitical tensions could support dollar as safe haven currency and particular the same tensions could lead to shy downward dive on EUR that we expect to see.
On coming week we mostly will deal with respect of current 1.3475-1.3520 support area. The first part of our trading plan suggests monitoring of shy upward continuation and whether price will remain below 1.3676 level or not. Second step of our plan – if any reversal pattern will be formed (say, butterfly “sell” on 4-hour chart), we can try to take scalp short position. This is a program for coming week. As you can see I even do not need to change short-term plan since previous week… Progress here is very slow.
But primary object on EUR is daily reversal pattern...
The technical portion of Sive's analysis owes a great deal to Joe DiNapoli's methods, and uses a number of Joe's proprietary indicators. Please note that Sive's analysis is his own view of the market and is not endorsed by Joe DiNapoli or any related companies.
As Reuters reports, the U.S. dollar slipped on Friday against a basket of major currencies to post a second week of losses after positive data on consumer sentiment failed to boost expectations for a rise in interest rates any time soon. The Thomson Reuters/University of Michigan's final June reading on the overall index on consumer sentiment came in at 82.5, up from 81.9 the month before and above the median forecast of 82.0 among economists polled by Reuters. Analysts said the upbeat consumer sentiment data left traders cold since it failed to dispel worries about the U.S. economy after data on Thursday showed slightly weaker-than-expected data on consumer spending in May. "The data is not shaking anybody's expectations in terms of the pace of tightening from the Fed," said Sebastien Galy, currency strategist at Societe Generale in New York, in reference to the Federal Reserve's timeline for raising interest rates from rock-bottom levels.
New Zealand dollar extended gains on traders' appetite for higher-yielding currencies and was last up 0.16 percent against the dollar to trade at $0.8775. Analysts said the yen gained following better-than-expected Japanese retail sales data, which diminished concerns of further monetary stimulus from the Bank of Japan. The government data showed Japanese retail sales fell 0.4 percent in May from a year earlier, which was better than economists' median estimate for a 1.8 percent drop in a Reuters poll. The data came after the government raised the national sales tax to 8 percent from 5 percent on April 1. "Indications are that maybe the economy is weathering this consumption tax pretty well so far," said Win Thin, head of emerging markets currency strategy with Brown Brothers Harriman in New York.
Traders looked ahead to the U.S. government's non-farm payrolls report for June, due for release on July 3. The government is expected to have added 210,000 jobs in June, down slightly from the prior month, according to a Reuters poll of economists.
The dollar continued to slide despite a slight increase in benchmark U.S. government bond yields. Benchmark 10-year U.S. Treasury notes were last down 3/32 in price to yield 2.53 percent.
Technical
Although in May EUR has formed monthly reversal candle, but in recent time downward action has slowed significantly. As you can ee within recent 2-3 weeks monthly picture hardly changes significantly. Recently market has returned right back down to YPP area and flirts around it since then. EUR now stands at very significant moment. It has closely approached to Yearly Pivot point and monthly MACDP. If we will get lucky, we could get clarification in June-July for extended period. Thus, appearing of bullish grabber right at YPP level definitely will tell us that market should exceed 1.40 level and probably even could reach YPR1~1.42 area. Conversely, failure at YPP will be great challenge on further downward action.
We’re speaking about both scenarios, because right now fundamental comments do not show any agreement in investors’ opinion concerning EUR. Some analysts even think that until US applies dovish policy EUR depreciation will be limited despite how dovish ECB is. Analysts suggest that Fed will keep rates low for longer period then they hint on. Thus, with fundamental indecision we have to closely watch for definite patterns and key levels. Now they are YPP and potential grabber.
By looking at bigger picture, market stands in tight range since 2014. Thus, 1.33-1.3850 is an area of “indecision”. While market stands inside of it we can talk about neither upward breakout nor downward reversal. At least, reversal identification could be done with yearly pivot – if market will move below it, this could be early sign of changing sentiment. But, as you can see, nothing among this issues have happened yet.
That’s being said, market stands around crucial area and June or July could clarify what will happen next.

Weekly
Weekly trend is bearish, but market is not at oversold. Previously market has made an attempt to return right back down to lows and formed inside week. Now we have another one – thus, EUR stands tight third week in a row. When market forms long candle it usually holds following price action for some time, because market needs to accustom to new range. At the same time this will increase potential energy of breakout. After flat placing market breaks with additional power. Recent week has not become an exception and market still stands inside the same range. Situation is changing slowly by far.
Right now situation on weekly chart is relatively simple. We have solid hammer pattern that stands upon strong support area – YPP, MPS1 and Fib level. Nearest perspecitve that we will deal with is respect of this level, i.e. bounce up. Medium term task is choosing a direction.
We will point on bearish trend only if market will move below YPP and take out lows of hammer pattern. This also will mean that monthly trend shifts bearish. Otherwise bullish perspective will dominate over market and there are some reasons for that. First is – weekly butterfly of May-June 2013. Yes, market has hit 1.27 and shown 3/8 retracement, but this is not neccesary mean the end of the game. As market will return right back up – it could mean that price will proceed to 1.618 target. Second – patterns on monthly, that we’ve just spoken about. I mean bullish grabber. But if even we will not get it, but market will continue move up this still will suggest existing of bullish sentiment, since price still will be above YPP and grabber has chances to appear on July as well...
Fundamental talks indirectly confirm this, because many analysts tell that this is not the question of dovish ECB and hawkish Fed – this is too simple, but the question of mismatch of Fed’s promises and real action on tighten policy. If it will appear that Fed is speaking and speaking on rising rates, but does not do this – this could shift force balance between EUR and USD.
We already see this. Despite recent nice economy data Fed does not hurry to hint on possible rate hiking, mostly because Mrs. Yellen is a follower of theory that unemployment creates additional pressure on inflation. As more people remain unemployed as more supply on job market. This extraordinary supply presses on wages. As wages stand flat – no inflation appears, hence no neccesity in rate hiking. As a result, we can make a conclusion that Fed would like to get positive NFP data for longer period. they need to see contraction of extraordinary employees supply, and, wages in turn, will show some tendency to grow.
Currently, only geopolitical tensions, probably could drive dollar higher, mostly Iraq. But unfortunately we can’t estimate the strength and timing of this geoplitical impact.
Anyway, let’s trade what we already have in place and focus on first task – action around strong weekly support, while directional task we will monitor gradually through all following weekly researches.

Daily
As Mr. Bilbo said – “change coming slowly, if it comes at all”. Our previous analysis stands for upward continuation by some reasons, but we thought it should be a bit faster. Still, as a result of previous week we’ve got five lazy days with flat upward angle. At the same time, the length of this lazy action is also an advantage. We can understand the nature of this motion and it tells us that this is not the trend. It has too flat angle, too deep retracements day by day, small trading ranges, etc. This is retracement guys that could stand due indecision or some expectations.
Besides, despite bullish trend we do not see any solid upward action and market mostly stands flat since beginning of June. This also might be a bearish dynamic pressure.
At the same time market slowly but stubbornly approaches to our point, where, as we think, downward reversal should happen, and market should start forming right wing of the butterfly. This will be primary object in the beginning of the week.

Swiss franc also has reached minimum target of grabbers and taken out recent lows.

That is what we’ve talked about – although CHF and EUR are related currencies, it is not neccesary that they have to move on equal distances. They have the same direction, while distances could be different. And that is what we see – EUR stands below previous top, while CHF has taken out recent low and completed short-term target. Now is a question – whether EUR will turn to YPP again...
4-hour
On recent week we’ve explained why we think that market should continue climbing to 1.3655-1.3675 area. Mostly because it has untouched 1.618 target and upward thrust of AB-CD pattern was really solid. This has happened and market has moved for 100 pips to the upside. Still, what do we see here? Price still has not reached this 1.618 extended objective point. As now we stand much closer to it, probably market should done with it in the beginning of the week. This is first step of our trading plan on coming week:
Wait reaching of 1.3655 target and watch for possible downward reversal somewhere between 1.3655 and WPR1=1.3675 area. This is the only range that is acceptable for us. Any other upward action will vanish daily butterfly, since it’s invalidation point is 1.3676.

1-hour
It would be perfect if market will form reversal pattern that could let us to enter short. If even chances on success will be not very impressive – perspective to enter short somewhere around 1.3660 with 20-25 pips stop and 150+ pips potential, looks attractive per se. But pattern could be formed differently. Here I’ve drawn most conservative picture – EUR forms small butterfly with 1.27 extension around 1.618 AB=CD target. But potentially market could move higher and closer to WPR1 by 2 reasons. First, it could complete greater butterfly with start point not at 1.3641 but on 1.3651 top. Second – if market will show retracement on Monday to some support – it could form even greater butterfly although it will have the same 1.27 point around WPR1.

Conclusion:
While price stands in 1.33-1.38 area we can’t speak either on upward or downward breakout. To change really big picture market has to show breakout out of it. Still, market right now stands around crucial area – combination of YPP and monthly MACDP. Appearing of bullish grabber in June or July could resolve the riddle on further action. Conversely moving below YPP will shift monthly trend bearish as well and could lead to further EUR depreciation. Currently economy factors mostly point of further dollar weakness as Fed drags out even hints on possible rate hiking. Only some geopolitical tensions could support dollar as safe haven currency and particular the same tensions could lead to shy downward dive on EUR that we expect to see.
On coming week we mostly will deal with respect of current 1.3475-1.3520 support area. The first part of our trading plan suggests monitoring of shy upward continuation and whether price will remain below 1.3676 level or not. Second step of our plan – if any reversal pattern will be formed (say, butterfly “sell” on 4-hour chart), we can try to take scalp short position. This is a program for coming week. As you can see I even do not need to change short-term plan since previous week… Progress here is very slow.
But primary object on EUR is daily reversal pattern...
The technical portion of Sive's analysis owes a great deal to Joe DiNapoli's methods, and uses a number of Joe's proprietary indicators. Please note that Sive's analysis is his own view of the market and is not endorsed by Joe DiNapoli or any related companies.


