Sive Morten
Special Consultant to the FPA
- Messages
- 18,699
Fundamentals
Reuters reports Dollar-buying momentum lifted the greenback to a fresh 12-year high against the euro on Friday, overcoming disappointing U.S. inflation and consumer sentiment data that would normally weaken it.
Positioning ahead of the Federal Reserve's monetary policy meeting next week was also seen as a potential reason for the seemingly incongruous move up by the dollar, analysts said.
The euro fell over 1.60 percent to a low of $1.04625 on the EBS trading platform .
"What makes us uncomfortable is that the dollar's drive higher is not being supported by front-end yields. They are down the past few days. It is not a yield advantage driving the dollar higher, but it feels like a momentum market," said Vassili Serebriakov, currency strategist at BNP Paribas in New York.
"We see a risk of a dollar pullback on the Fed next week but a bias to buy on that," he said.
U.S. producer prices fell 0.6 percent last month, the first drop since the series was revamped in 2009, pointing to tame inflation that could argue against an anticipated June interest rate increase by the Fed.
In addition the University of Michigan's consumer sentiment index fell in March, although inflation expectations rose for a second straight month to its highest since September.
The European Central Bank's quantitative easing program, meant to stimulate borrowing and investment, stands in contrast to the expectation the Fed starts raising interest rates later this year, enhancing the dollar's yield advantage.
"Dollar-buying momentum is overcoming rising European yields. It remains unclear what's driving this higher because the data and the curves would argue more (for) its weakness," said Sebastian Galy, senior currency strategist at Societe Generale in New York.
Galy referred to a pause in European bond buying that has driven yields to record lows and in some cases negative levels.
Sterling fell over 1 percent to a fresh near five-year low of $1.4697 . Bank of England Governor Mark Carney said on Thursday he was in no hurry to raise interest rates, fueling cable's weakness.
The euro dropped 1.55 percent to 126.915 yen, its weakest point in over 1-1/2 years . Meanwhile the dollar was little changed against the yen, rising just 0.11 percent to 121.395 .
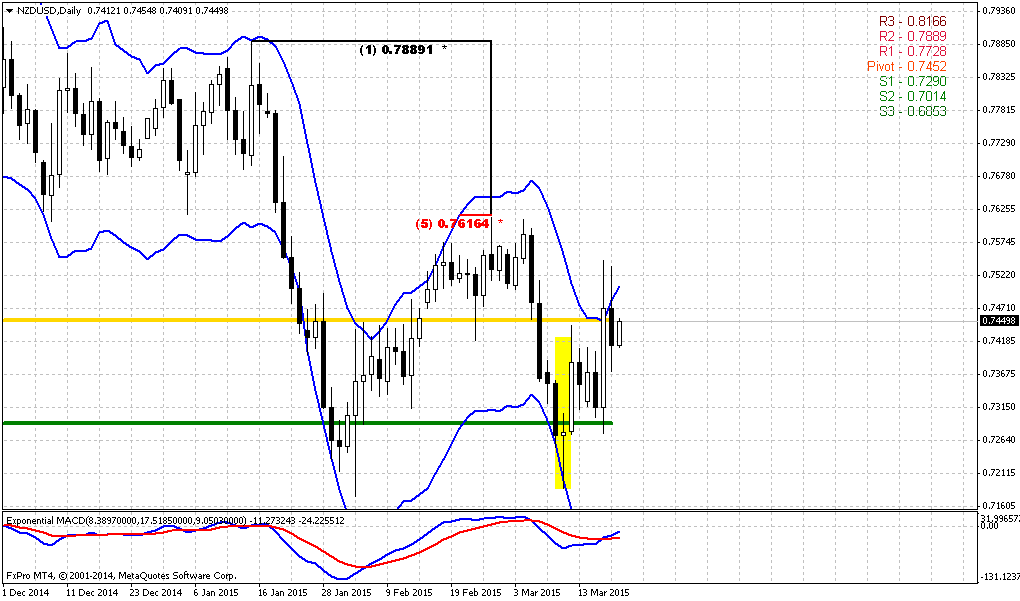
Today, guys, we will take a look at GBP again. EUR situation does not need any update by far, on NZD we’ve spoken just yesterday and our trading plan now stands in progress.
So, CFTC data shows significant increase in open interest – as short positions as long were increased. What also is interesting – hedgers’ positions also have increased correspondingly. Still, right now shorts approximately two times greater than longs. Increasing of shorts mostly has been triggered by BoE comments about postponing of interest rate hiking on 2016 year. At the same time solid jump in long positions suggests that market could show upward retracement.
Open interest:
 Speculative Shorts:
 Speculative Longs:

Technicals
Monthly
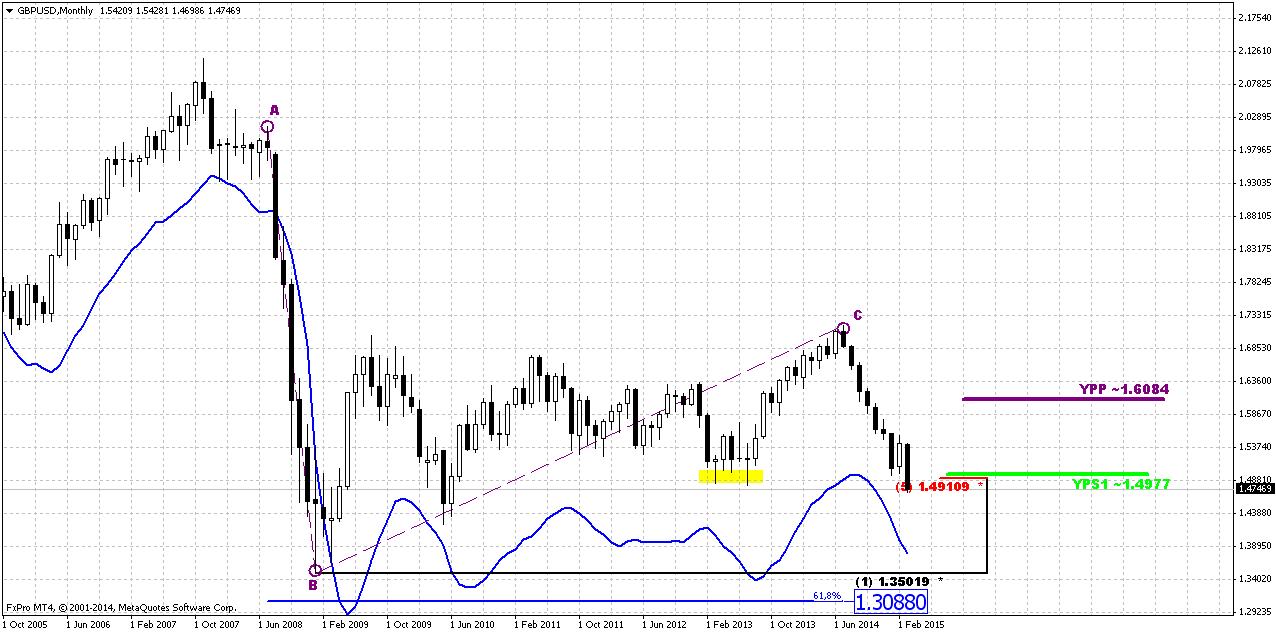
Since it is still valid – I would like to keep showing you monthly chart and analysis that we’ve made in December 2013 in our Forex Military School Course, where we were learning Elliot Waves technique.
https://www.forexpeacearmy.com/forex-forum/forex-military-school-complete-forex-education-pro-banker/30110-chapter-16-part-v-trading-elliot-waves-page-7-a.html
Our long term analysis suggests first appearing of new high on 4th wave at ~1.76 level and then starting of last 5th wave down. First condition was accomplished and we’ve got new high, but it was a bit lower – not 1.76 but 1.72. This was and is all time support/resistance area. Now we stand in final part of our journey. According to our 2013 analysis market should reach lows at 1.35 area. Let’s see what additional information we have right now.
Trend is bearish here, but GBP is not at oversold. Couple of weeks ago market has reached strong support area – Yearly Pivot support 1 and 5/8 major monthly Fib level, where we’ve taken our B&B “Sell” trade. Although market right now stands ~200 pips below this level, it seems that it has not been broken totally yet. But the fact that market gradually struggling through YPS1 looks bearish.
In fact here we have just one major destination point. Monthly chart give us just single AB-CD pattern with nearest target at 0.618 extension – 1.3088. Still, here we have another one non-Fib orienteer – lower border of current consolidation. If we will treat it as sideways action then lower border will stand ~1.42-1.43 area. But first we need to get over current support level and see what market could give us here. Currently 1.30-1.31 area looks unbelievable, but if we would suggest parity on EUR/USD and starting rate hiking cycle in US – why not? Still, this is very long-term picture and right now we’re mostly interested in reaction of the market on current support level. Since market has taken attempt to move through it – it has met oversold as on weekly as on daily chart and this could lead to short-term upside retracement. On monthly chart market is not oversold.
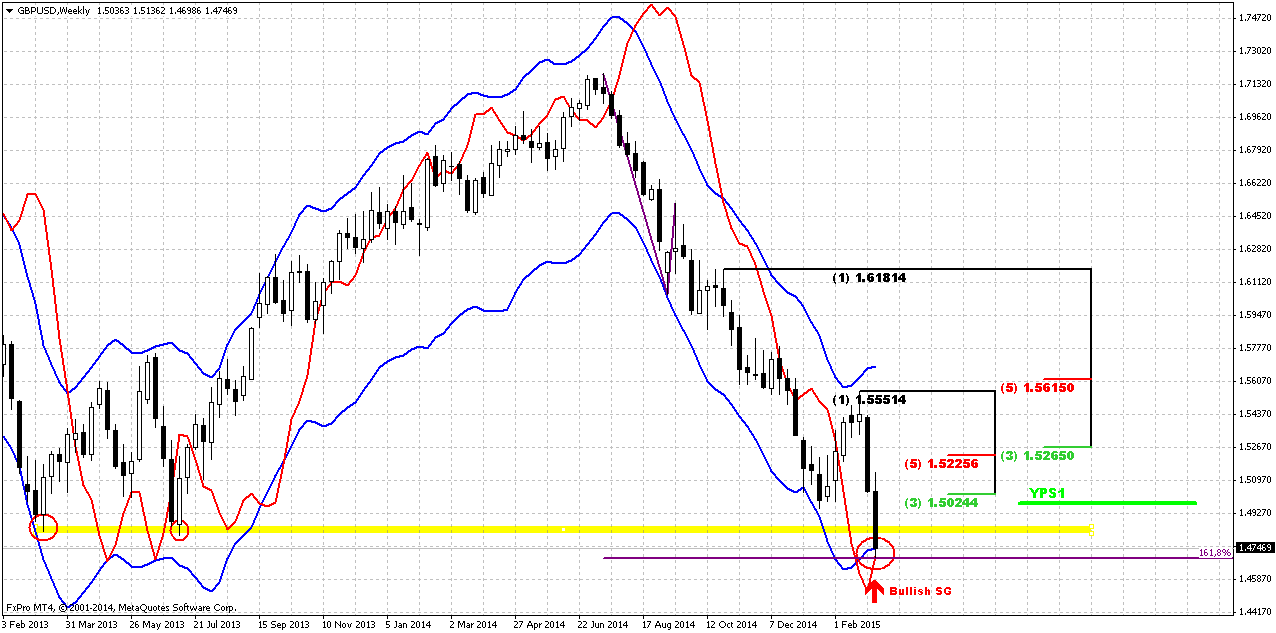
Weekly
Our major context stands on weekly chart. It seems that shy moving below former lows has happened due existence of 1.618 target of single AB-CD pattern that we have here. Thus last week market has touched it. Combination of AB-CD objective point, weekly oversold and, take a look, bullish grabber give not bad chances on possible upside retracement. Although grabber suggests taking out of previous highs at 1.5550, but we mostly will be focused on conservative destination – K-resistance area around 1.5225-1.5265. If market will get there – we think what to do next. So, conclusion from weekly chart – watch for possible upside reversal patterns on daily and intraday charts that could let us to take positions on possible weekly retracement.
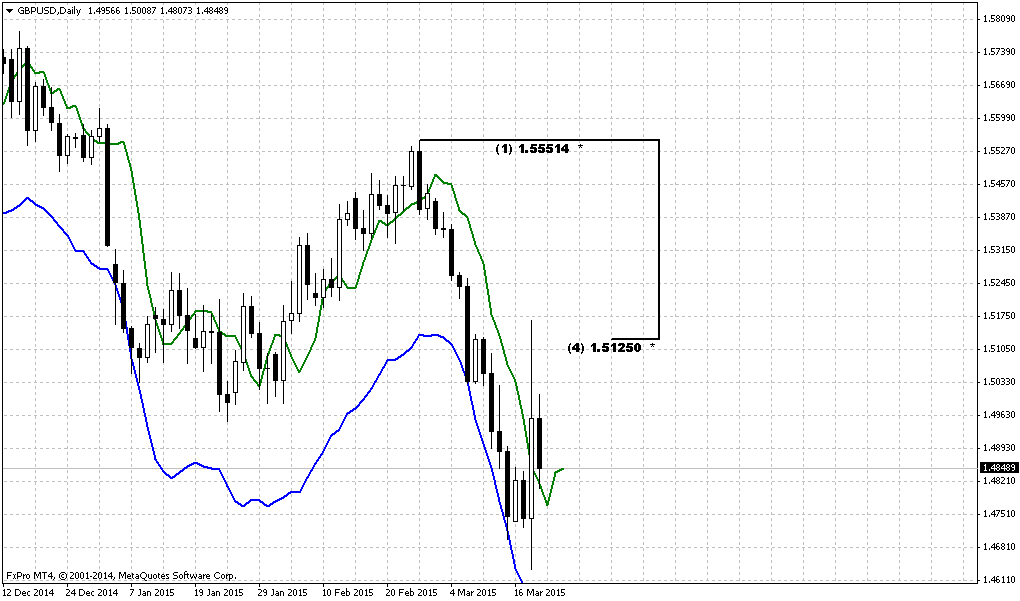
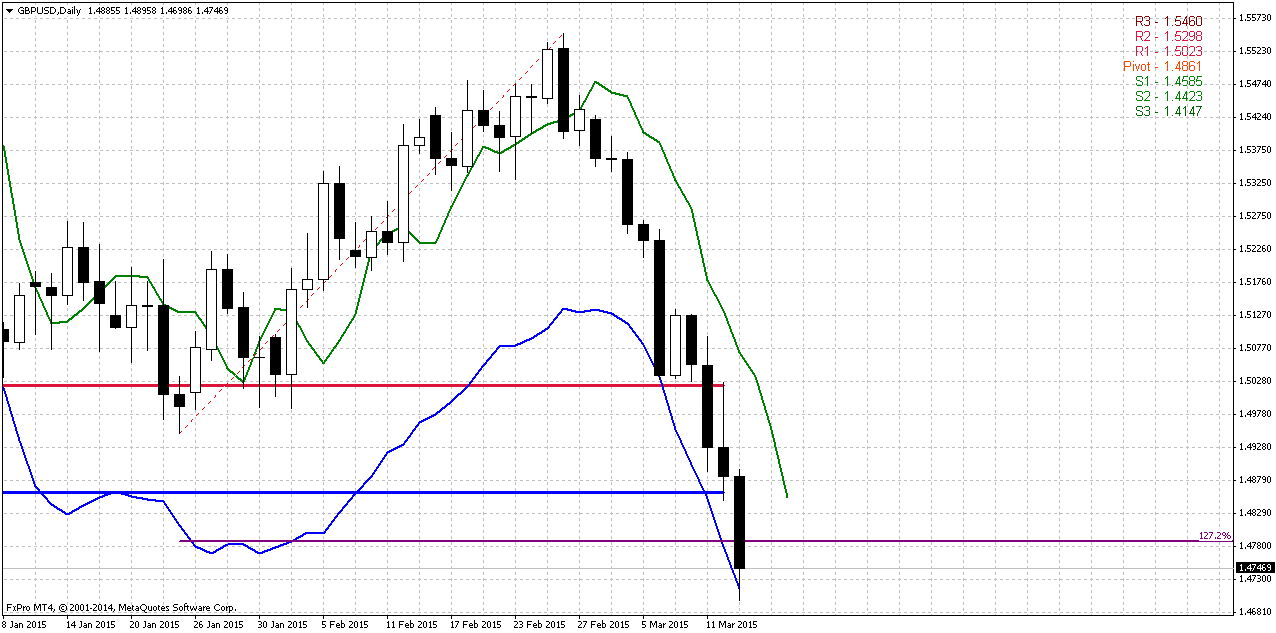
Daily
As plunge just has finished or paused, daily chart does not provide yet any patterns. Here we see that GBP is also at oversold here. At the same time market has reached 1.27 extension of previous retracement. We do not have butterfly or any other harmonic pattern, but extensions of retracement also work as support. One of the possible reversal patterns here could be DRPO “Buy” – thrust down looks nice and absolutely suitable for this pattern.
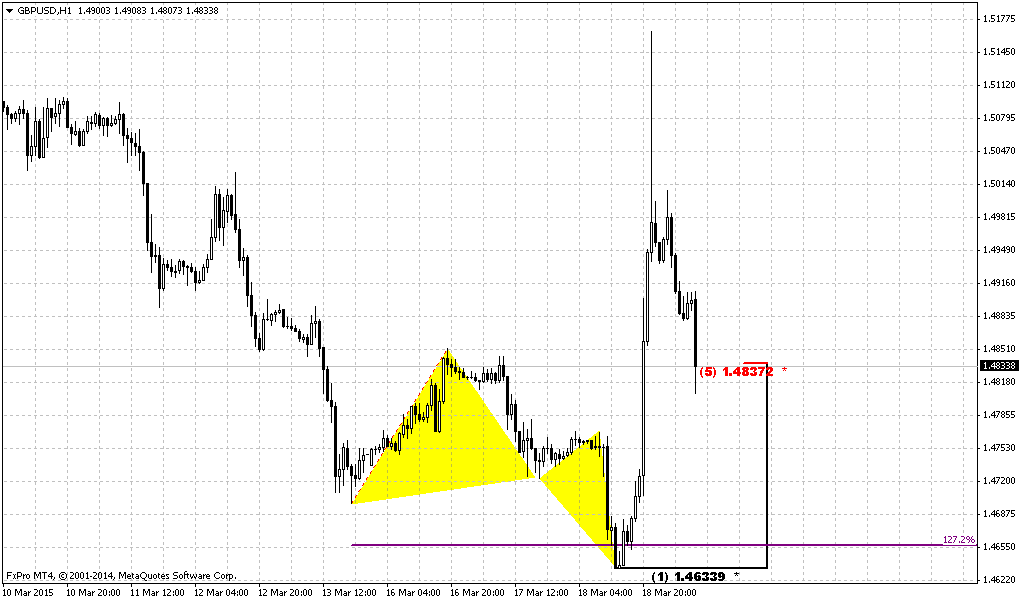
Intraday charts
On Intraday charts we do not have any patterns yet – just move down. Let’s hope that on next week market will form something interesting – pattern that will confirm our expectation on upside retracement.
Conclusion:
In long-term perspective expectation of US rate hike in 2015 and opposite postponing of this procedure in UK on 2016 makes us think that downward action will continue and it seems not impossible reaching of our target 1.30 within 2015-2016.
Meantime in short-term perspective market looks a bit overextended to the downside and could show upside retracement with not small potential of 400-500 pips. Our first step of trading plan – wait for reversal patterns on 4-hour and daily chart.
The technical portion of Sive's analysis owes a great deal to Joe DiNapoli's methods, and uses a number of Joe's proprietary indicators. Please note that Sive's analysis is his own view of the market and is not endorsed by Joe DiNapoli or any related companies.
Reuters reports Dollar-buying momentum lifted the greenback to a fresh 12-year high against the euro on Friday, overcoming disappointing U.S. inflation and consumer sentiment data that would normally weaken it.
Positioning ahead of the Federal Reserve's monetary policy meeting next week was also seen as a potential reason for the seemingly incongruous move up by the dollar, analysts said.
The euro fell over 1.60 percent to a low of $1.04625 on the EBS trading platform .
"What makes us uncomfortable is that the dollar's drive higher is not being supported by front-end yields. They are down the past few days. It is not a yield advantage driving the dollar higher, but it feels like a momentum market," said Vassili Serebriakov, currency strategist at BNP Paribas in New York.
"We see a risk of a dollar pullback on the Fed next week but a bias to buy on that," he said.
U.S. producer prices fell 0.6 percent last month, the first drop since the series was revamped in 2009, pointing to tame inflation that could argue against an anticipated June interest rate increase by the Fed.
In addition the University of Michigan's consumer sentiment index fell in March, although inflation expectations rose for a second straight month to its highest since September.
The European Central Bank's quantitative easing program, meant to stimulate borrowing and investment, stands in contrast to the expectation the Fed starts raising interest rates later this year, enhancing the dollar's yield advantage.
"Dollar-buying momentum is overcoming rising European yields. It remains unclear what's driving this higher because the data and the curves would argue more (for) its weakness," said Sebastian Galy, senior currency strategist at Societe Generale in New York.
Galy referred to a pause in European bond buying that has driven yields to record lows and in some cases negative levels.
Sterling fell over 1 percent to a fresh near five-year low of $1.4697 . Bank of England Governor Mark Carney said on Thursday he was in no hurry to raise interest rates, fueling cable's weakness.
The euro dropped 1.55 percent to 126.915 yen, its weakest point in over 1-1/2 years . Meanwhile the dollar was little changed against the yen, rising just 0.11 percent to 121.395 .
Today, guys, we will take a look at GBP again. EUR situation does not need any update by far, on NZD we’ve spoken just yesterday and our trading plan now stands in progress.
So, CFTC data shows significant increase in open interest – as short positions as long were increased. What also is interesting – hedgers’ positions also have increased correspondingly. Still, right now shorts approximately two times greater than longs. Increasing of shorts mostly has been triggered by BoE comments about postponing of interest rate hiking on 2016 year. At the same time solid jump in long positions suggests that market could show upward retracement.
Open interest:
Technicals
Monthly
Since it is still valid – I would like to keep showing you monthly chart and analysis that we’ve made in December 2013 in our Forex Military School Course, where we were learning Elliot Waves technique.
https://www.forexpeacearmy.com/forex-forum/forex-military-school-complete-forex-education-pro-banker/30110-chapter-16-part-v-trading-elliot-waves-page-7-a.html
Our long term analysis suggests first appearing of new high on 4th wave at ~1.76 level and then starting of last 5th wave down. First condition was accomplished and we’ve got new high, but it was a bit lower – not 1.76 but 1.72. This was and is all time support/resistance area. Now we stand in final part of our journey. According to our 2013 analysis market should reach lows at 1.35 area. Let’s see what additional information we have right now.
Trend is bearish here, but GBP is not at oversold. Couple of weeks ago market has reached strong support area – Yearly Pivot support 1 and 5/8 major monthly Fib level, where we’ve taken our B&B “Sell” trade. Although market right now stands ~200 pips below this level, it seems that it has not been broken totally yet. But the fact that market gradually struggling through YPS1 looks bearish.
In fact here we have just one major destination point. Monthly chart give us just single AB-CD pattern with nearest target at 0.618 extension – 1.3088. Still, here we have another one non-Fib orienteer – lower border of current consolidation. If we will treat it as sideways action then lower border will stand ~1.42-1.43 area. But first we need to get over current support level and see what market could give us here. Currently 1.30-1.31 area looks unbelievable, but if we would suggest parity on EUR/USD and starting rate hiking cycle in US – why not? Still, this is very long-term picture and right now we’re mostly interested in reaction of the market on current support level. Since market has taken attempt to move through it – it has met oversold as on weekly as on daily chart and this could lead to short-term upside retracement. On monthly chart market is not oversold.
Weekly
Our major context stands on weekly chart. It seems that shy moving below former lows has happened due existence of 1.618 target of single AB-CD pattern that we have here. Thus last week market has touched it. Combination of AB-CD objective point, weekly oversold and, take a look, bullish grabber give not bad chances on possible upside retracement. Although grabber suggests taking out of previous highs at 1.5550, but we mostly will be focused on conservative destination – K-resistance area around 1.5225-1.5265. If market will get there – we think what to do next. So, conclusion from weekly chart – watch for possible upside reversal patterns on daily and intraday charts that could let us to take positions on possible weekly retracement.
Daily
As plunge just has finished or paused, daily chart does not provide yet any patterns. Here we see that GBP is also at oversold here. At the same time market has reached 1.27 extension of previous retracement. We do not have butterfly or any other harmonic pattern, but extensions of retracement also work as support. One of the possible reversal patterns here could be DRPO “Buy” – thrust down looks nice and absolutely suitable for this pattern.
Intraday charts
On Intraday charts we do not have any patterns yet – just move down. Let’s hope that on next week market will form something interesting – pattern that will confirm our expectation on upside retracement.
Conclusion:
In long-term perspective expectation of US rate hike in 2015 and opposite postponing of this procedure in UK on 2016 makes us think that downward action will continue and it seems not impossible reaching of our target 1.30 within 2015-2016.
Meantime in short-term perspective market looks a bit overextended to the downside and could show upside retracement with not small potential of 400-500 pips. Our first step of trading plan – wait for reversal patterns on 4-hour and daily chart.
The technical portion of Sive's analysis owes a great deal to Joe DiNapoli's methods, and uses a number of Joe's proprietary indicators. Please note that Sive's analysis is his own view of the market and is not endorsed by Joe DiNapoli or any related companies.
Last edited: