Sive Morten
Special Consultant to the FPA
- Messages
- 18,695
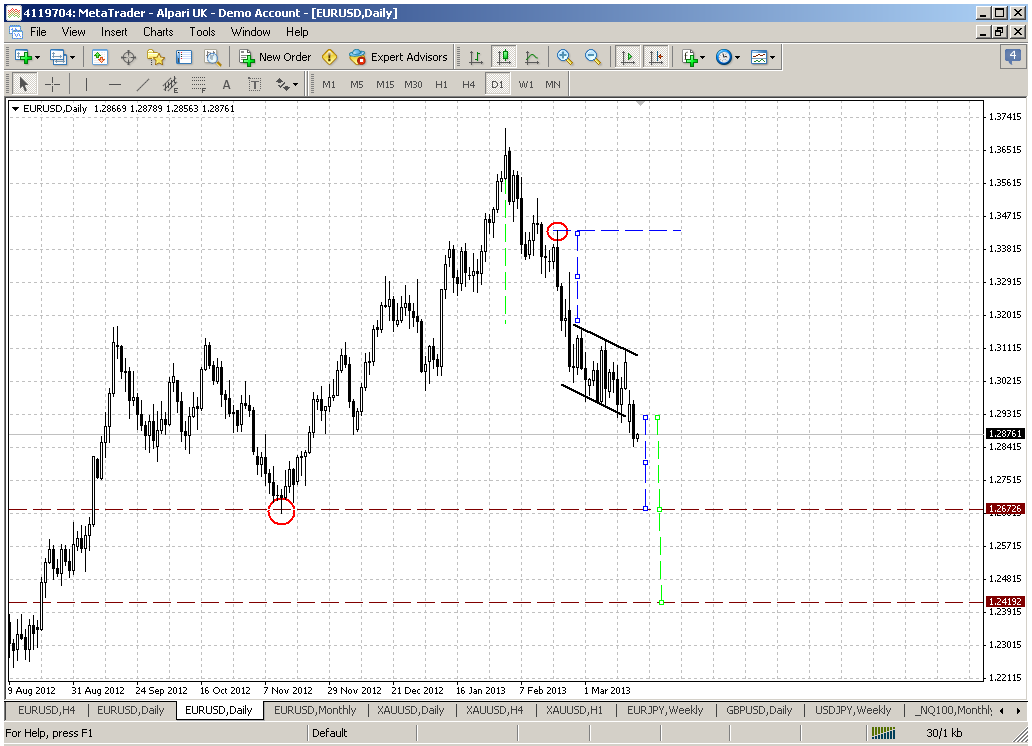
Monthly
On monthly time frame we do not see any significant changes just yet. As we’ve noted on week before – market by February close has confirmed and finally formed bearish engulfing pattern right at major 50% resistance area, but even on previous week it has not triggered yet, since market has not closed below engulfing low. Still this is important since technically this lets us to stick with this pattern and understand when we can speak about bullish or bearish trend. Thus, until market will not take 1.3730 high – it is difficult to tell about re-establishing of bullish trend here. The minimum target usually is a length of the bars and it points on 1.2450-1.25 area.
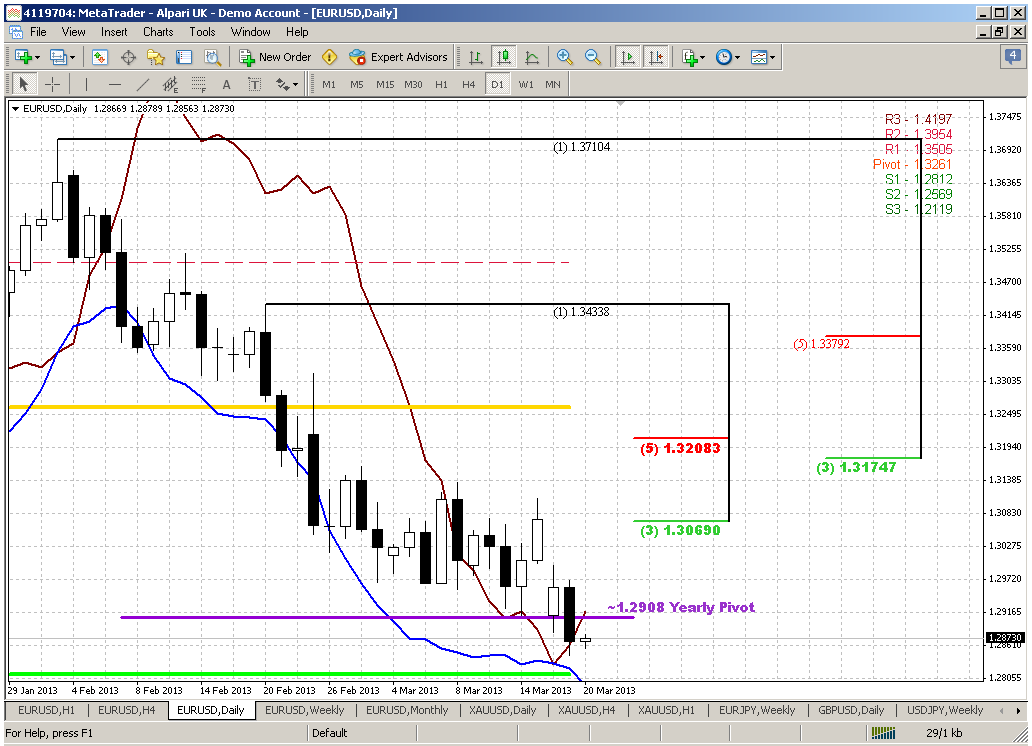
Weekly
I do not know whether it good or not, but within previous couple of weeks market shows rather tight acion on weekly chart and just few things that could be commented here. Market still stands around weekly K-support area. Trend is bearish here, market is not at oversold. Analysis of harmonic swings shows that current move down is much faster than previous one. This tells that market is rather heavier, and may be this is not a retracement already. Another nuance – market has exceeded the length of harmonic swing down. As we’ve discussed many times, it is quite often when market doubles harmonic distance as it breaks it. That’s why, actually this swing calls as “harmonic”. Following to that logic – the destination here is major 5/8 support at oversold – 1.2680 area. This is stand rather close to the target of monthly engulfing pattern.
The major difference here from previous week is that we finally see the bounce up, or at least some kind of hint on it. Probably weekly K-support is still valid, besides market stands at natural long-term support line as well. Also take a look – actually we have bullish engulfing pattern. It is not typical and has a different shape from what we usually associate with engulfing, but it holds all neccesary conditions of engulfing pattern. From that point of view 1.2910 low is significant – if market will close below it, then the odds of further upward bounce will reduce significantly.
Another point in favor of possible pullback is MPP and it has not been tested yet.
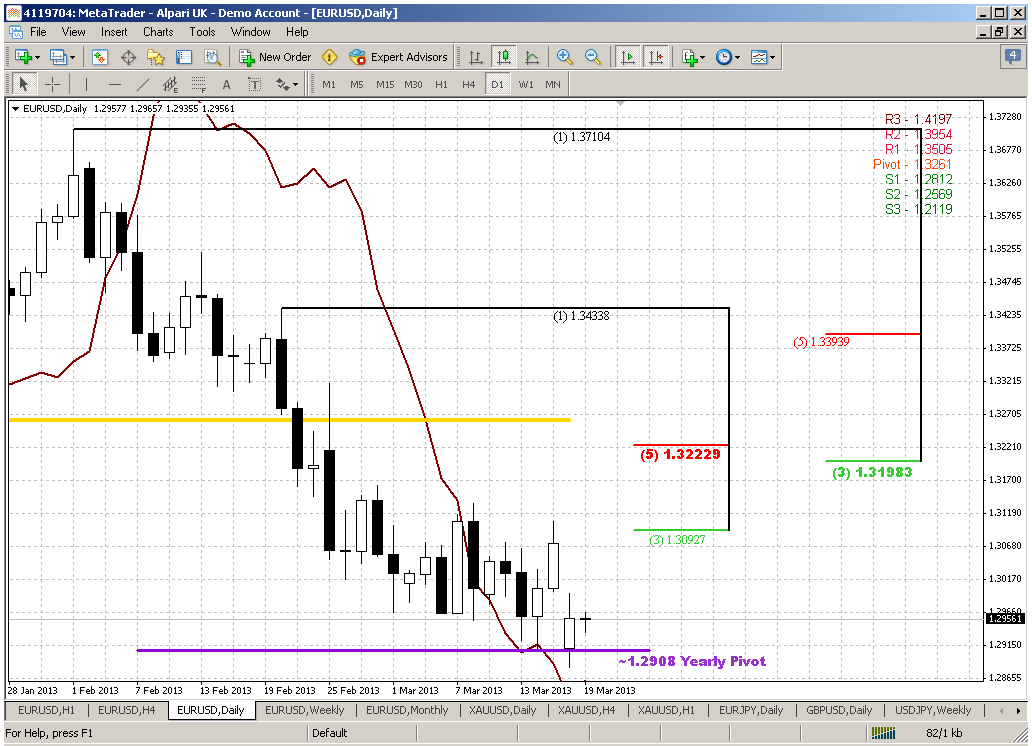
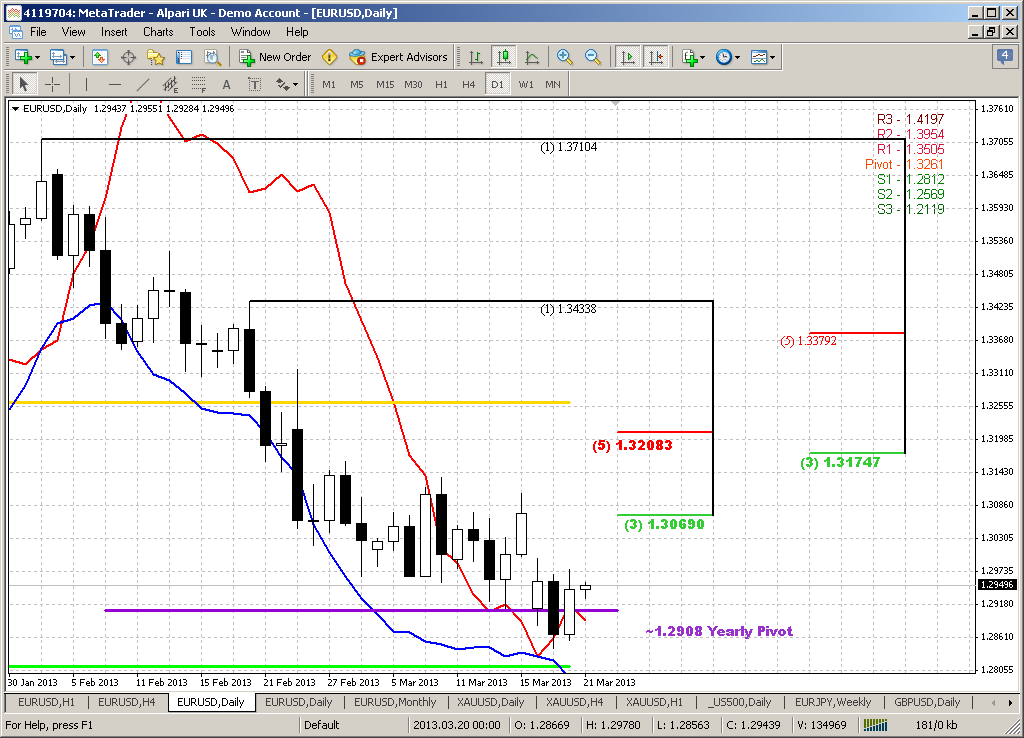
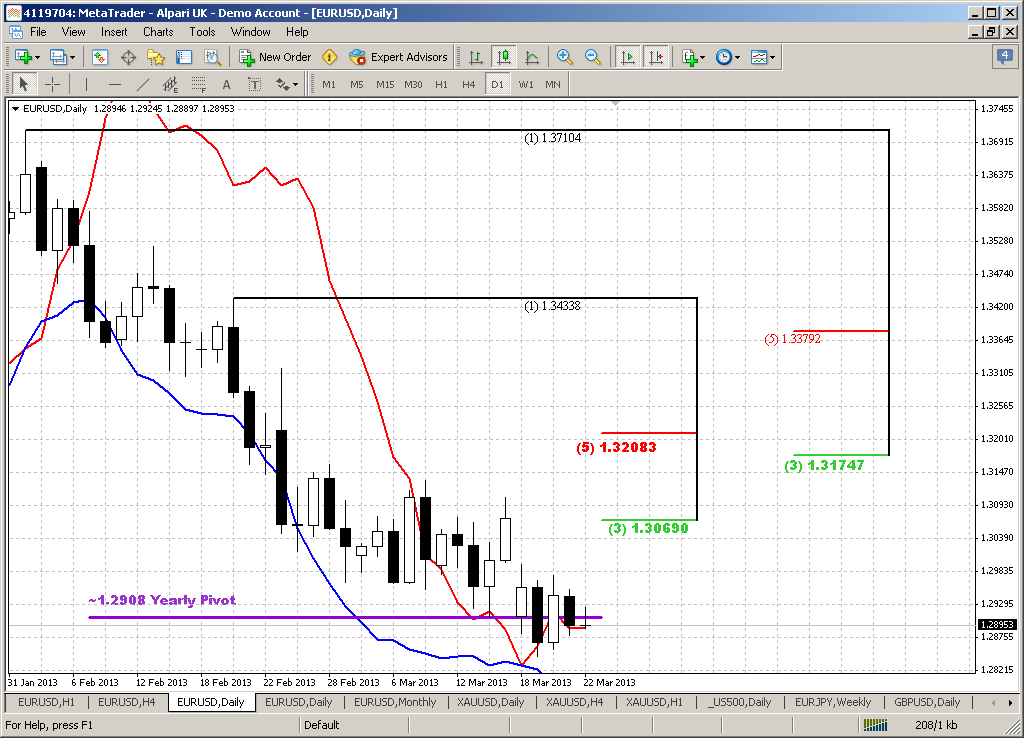
Daily
On daily we see almost the same picture as on Friday. Market has touched levels that we’ve discussed previously and classified them as “must be touched before retracement”. Any target that you will apply here – will give you approximately the same level that stands around 1.3216-1.3234 K-resistance area. Whether you will treat current action as small rectangle as we did previously or will see here some kind of double bottom – the classical target as the height of the rectangle as the distance from bottom to neckline will give you the same target. What is interesting is that application of harmonic swing also points on the same area. Since for showing deeper retracement market has to exceed single harmonic swing. As a rule market tends to repeat swing with some multiplication and initially doubles it. So, double of harmonic swing points on the same area. Slightly higher MPP stands and this is also a magnet for price.
Now let’s return to patterns. Yesterday we’ve said that we have only one – this is bullish stop grabber and looks like it’s working and has not reached yet the minimum target that is 1.3134 high. On Friday market has hit the first resistance – nearest Fib level and upper border of consolidation. Probably we can count on retracement and use it for long entry. Retracement setup will be vanished if market will move below current lows.
Also guys, this could become excellent DRPO “Buy” but we were a bit unlucky with penetrations of 3x3 DMA. If current bottom would be the second penetration – this could be perfect DRPO, but, probably not in this time.
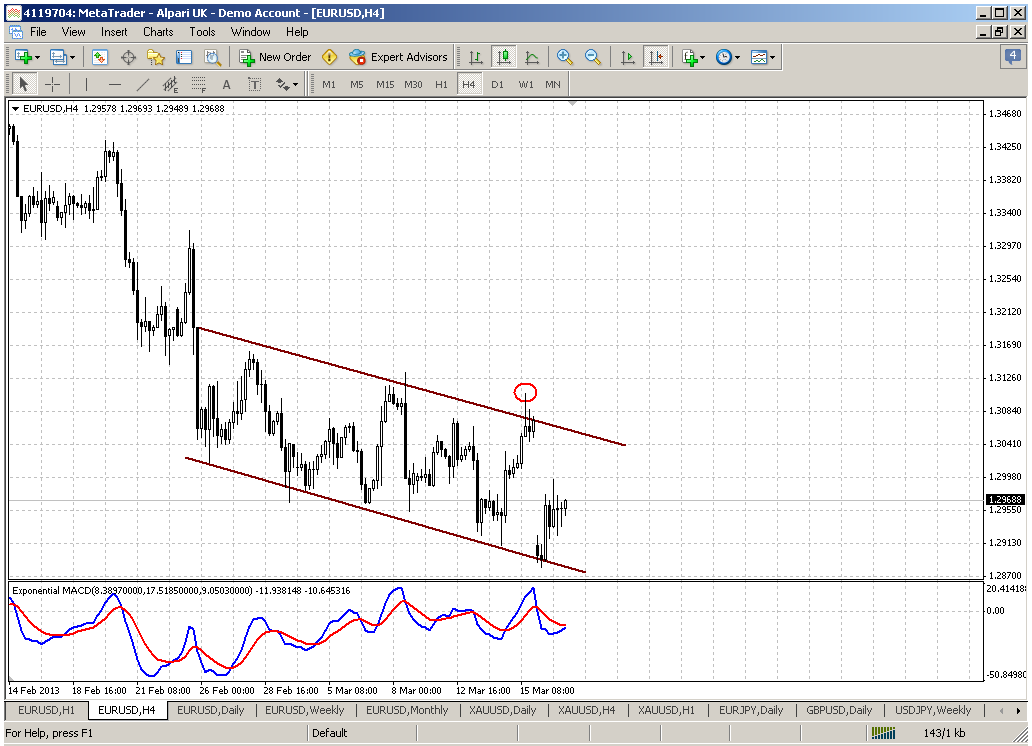
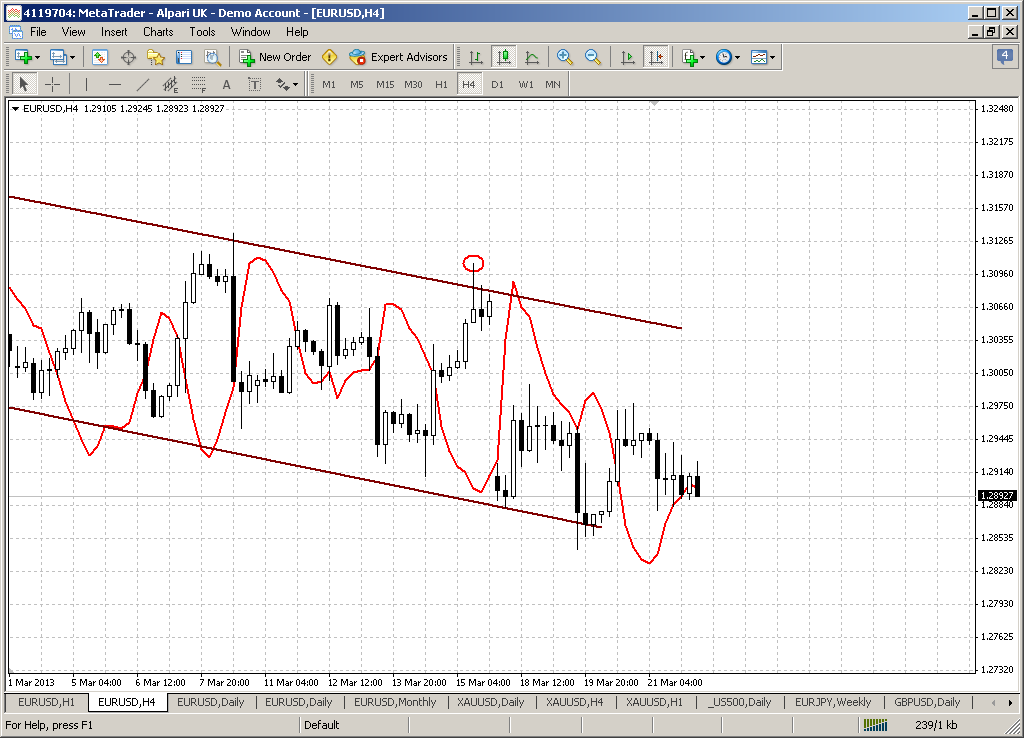
4-hour
Trend has turned bullish, we see the min target of daily stop grabber pattern – high at 1.3134, but, as we’ve discussed on Friday, market has not broken a tendency of normal bearish action. Lower lows and lower highs are still in place. Here market very accurately repeats the same shape – “small – big move up”. Big move exceeds small, but the sequence of big swings still shows lower highs. Thus, we probably can join move up as we’ve said on Friday, based on stop grabber pattern but later will have to keep an eye on confirmation – upward breakout from this channel, exceeding 1.3134 and, what is most important – holding above it.
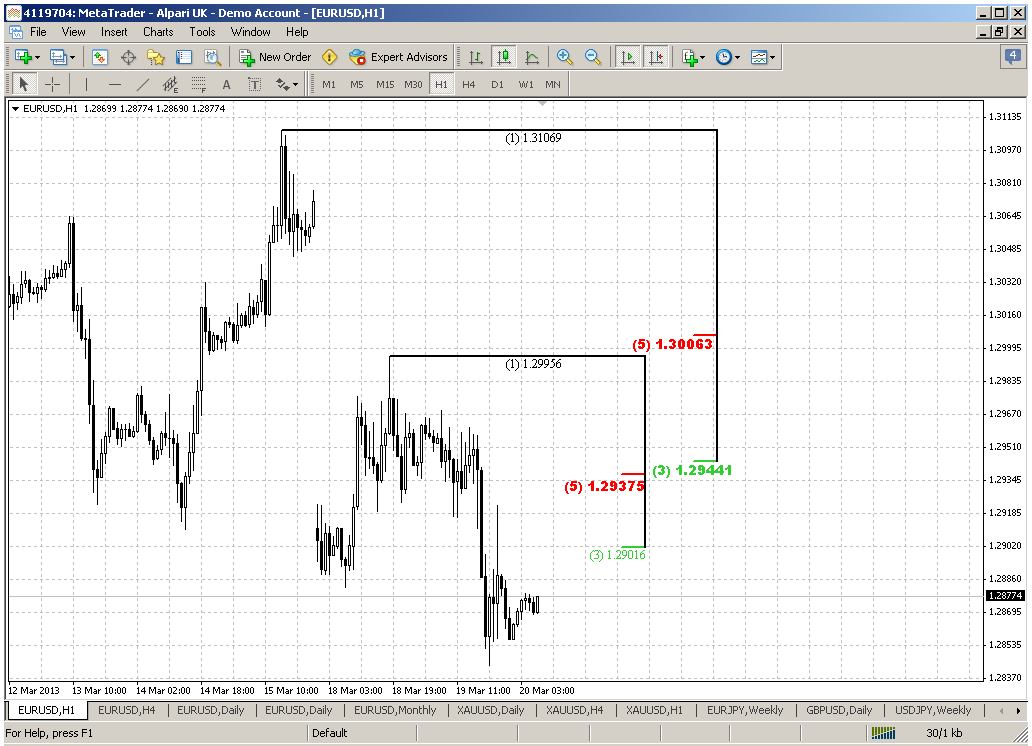
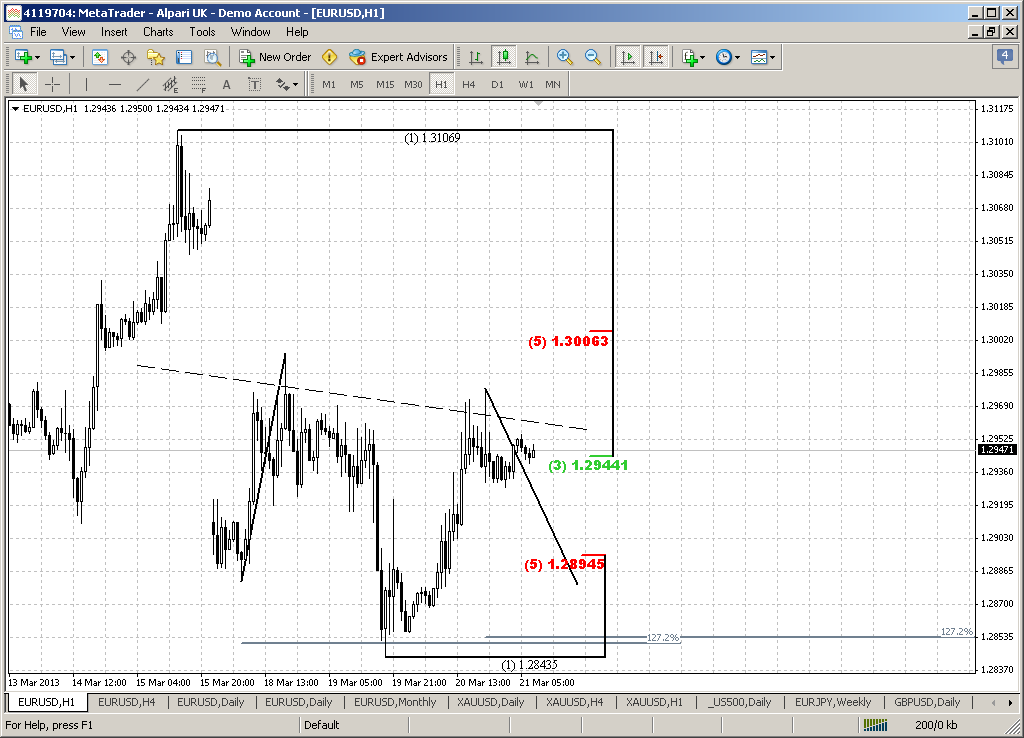
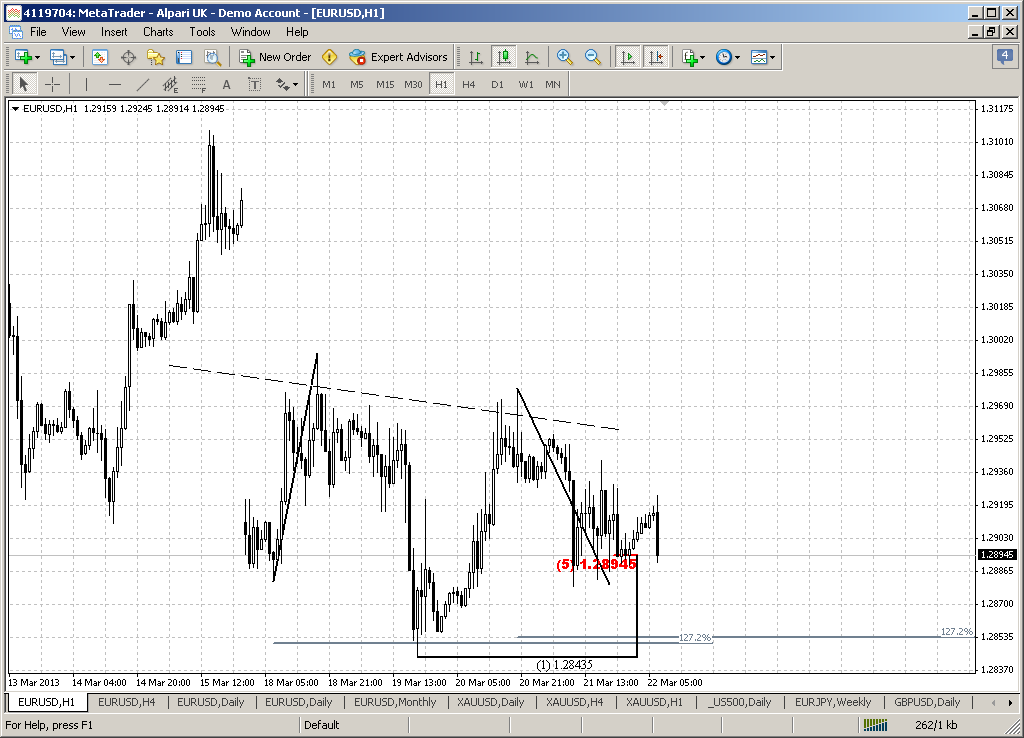
60-min
Hourly chart shows where we can enter long. Since stop grabber has not quite reached the destination point, move up probably will continue, even it will not becom the thrue solid retracement to 1.3230 area. Thus, we can take relatively small risk and when market will take out 1.3134 highs – move stop to breakeven and hope that market will continue up.
So, hourly chart shows perfect bearish engulfing that could trigger downward AB=CD pattern. In this case there is excellent level to watch for deep buy is hourly K-support 1.3032-1.3039 and 50% support around 1.3010 area. Other words, I would probably indicate an area as 1.3010-1.3035, because engulfing pattern itself points on a bit deeper move (since the target is the length of the bars), while if this will be AB=CD down, then target will be slightly higher.
Conclusion:
Long term picture is bearish, as well as trend and price action. All current expectations on possible bounce up on daily chart are based mostly on K-support area on weekly and hitting extended 1.618 target on daily charts. Besides, market has not tested yet MPP.
Anyway this bounce will not be reversal, at least currently we have to treat it as retracement. Hence our position will be just for a bounce, some sort of scalp trade and not for holding it for long-time. Potential target of this bounce is 1.3230-1.3260 area.
Appearing of stop grabber pattern on daily lets us to take position with reasonable risk around 1.3010-1.3030 area. If it will appear to be successful – protect it with breakeven stop around 1.3134 area, because this pattern could be a triggering one for retracement itself.
The technical portion of Sive's analysis owes a great deal to Joe DiNapoli's methods, and uses a number of Joe's proprietary indicators. Please note that Sive's analysis is his own view of the market and is not endorsed by Joe DiNapoli or any related companies.
On monthly time frame we do not see any significant changes just yet. As we’ve noted on week before – market by February close has confirmed and finally formed bearish engulfing pattern right at major 50% resistance area, but even on previous week it has not triggered yet, since market has not closed below engulfing low. Still this is important since technically this lets us to stick with this pattern and understand when we can speak about bullish or bearish trend. Thus, until market will not take 1.3730 high – it is difficult to tell about re-establishing of bullish trend here. The minimum target usually is a length of the bars and it points on 1.2450-1.25 area.
Weekly
I do not know whether it good or not, but within previous couple of weeks market shows rather tight acion on weekly chart and just few things that could be commented here. Market still stands around weekly K-support area. Trend is bearish here, market is not at oversold. Analysis of harmonic swings shows that current move down is much faster than previous one. This tells that market is rather heavier, and may be this is not a retracement already. Another nuance – market has exceeded the length of harmonic swing down. As we’ve discussed many times, it is quite often when market doubles harmonic distance as it breaks it. That’s why, actually this swing calls as “harmonic”. Following to that logic – the destination here is major 5/8 support at oversold – 1.2680 area. This is stand rather close to the target of monthly engulfing pattern.
The major difference here from previous week is that we finally see the bounce up, or at least some kind of hint on it. Probably weekly K-support is still valid, besides market stands at natural long-term support line as well. Also take a look – actually we have bullish engulfing pattern. It is not typical and has a different shape from what we usually associate with engulfing, but it holds all neccesary conditions of engulfing pattern. From that point of view 1.2910 low is significant – if market will close below it, then the odds of further upward bounce will reduce significantly.
Another point in favor of possible pullback is MPP and it has not been tested yet.
Daily
On daily we see almost the same picture as on Friday. Market has touched levels that we’ve discussed previously and classified them as “must be touched before retracement”. Any target that you will apply here – will give you approximately the same level that stands around 1.3216-1.3234 K-resistance area. Whether you will treat current action as small rectangle as we did previously or will see here some kind of double bottom – the classical target as the height of the rectangle as the distance from bottom to neckline will give you the same target. What is interesting is that application of harmonic swing also points on the same area. Since for showing deeper retracement market has to exceed single harmonic swing. As a rule market tends to repeat swing with some multiplication and initially doubles it. So, double of harmonic swing points on the same area. Slightly higher MPP stands and this is also a magnet for price.
Now let’s return to patterns. Yesterday we’ve said that we have only one – this is bullish stop grabber and looks like it’s working and has not reached yet the minimum target that is 1.3134 high. On Friday market has hit the first resistance – nearest Fib level and upper border of consolidation. Probably we can count on retracement and use it for long entry. Retracement setup will be vanished if market will move below current lows.
Also guys, this could become excellent DRPO “Buy” but we were a bit unlucky with penetrations of 3x3 DMA. If current bottom would be the second penetration – this could be perfect DRPO, but, probably not in this time.
4-hour
Trend has turned bullish, we see the min target of daily stop grabber pattern – high at 1.3134, but, as we’ve discussed on Friday, market has not broken a tendency of normal bearish action. Lower lows and lower highs are still in place. Here market very accurately repeats the same shape – “small – big move up”. Big move exceeds small, but the sequence of big swings still shows lower highs. Thus, we probably can join move up as we’ve said on Friday, based on stop grabber pattern but later will have to keep an eye on confirmation – upward breakout from this channel, exceeding 1.3134 and, what is most important – holding above it.
60-min
Hourly chart shows where we can enter long. Since stop grabber has not quite reached the destination point, move up probably will continue, even it will not becom the thrue solid retracement to 1.3230 area. Thus, we can take relatively small risk and when market will take out 1.3134 highs – move stop to breakeven and hope that market will continue up.
So, hourly chart shows perfect bearish engulfing that could trigger downward AB=CD pattern. In this case there is excellent level to watch for deep buy is hourly K-support 1.3032-1.3039 and 50% support around 1.3010 area. Other words, I would probably indicate an area as 1.3010-1.3035, because engulfing pattern itself points on a bit deeper move (since the target is the length of the bars), while if this will be AB=CD down, then target will be slightly higher.
Conclusion:
Long term picture is bearish, as well as trend and price action. All current expectations on possible bounce up on daily chart are based mostly on K-support area on weekly and hitting extended 1.618 target on daily charts. Besides, market has not tested yet MPP.
Anyway this bounce will not be reversal, at least currently we have to treat it as retracement. Hence our position will be just for a bounce, some sort of scalp trade and not for holding it for long-time. Potential target of this bounce is 1.3230-1.3260 area.
Appearing of stop grabber pattern on daily lets us to take position with reasonable risk around 1.3010-1.3030 area. If it will appear to be successful – protect it with breakeven stop around 1.3134 area, because this pattern could be a triggering one for retracement itself.
The technical portion of Sive's analysis owes a great deal to Joe DiNapoli's methods, and uses a number of Joe's proprietary indicators. Please note that Sive's analysis is his own view of the market and is not endorsed by Joe DiNapoli or any related companies.