Sive Morten
Special Consultant to the FPA
- Messages
- 18,693
Hi Sive,
I found that when you sound extrtemely bullish or bearish, like in te case now, the time for correction is around the corner.
Regards!
Hi Alf,
Counter-opinion approach - I like it
Hi Sive,
I found that when you sound extrtemely bullish or bearish, like in te case now, the time for correction is around the corner.
Regards!
And so it was....
But I like to say, stop loss is better than drawdown*

Hi guys,
At my taste, this is not diamond, more looks like just consolidation before breakout.
... or - attempt of breakout
Hi Sive,
I found that when you sound extrtemely bullish or bearish, like in te case now, the time for correction is around the corner.
Regards!
Hi Alf,
Counter-opinion approach - I like it
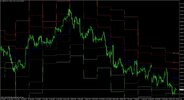
Hi Brandon, actually Pivot formulas are based on values of previous trading period (i.e. week), thus indicator wouldn't need an open.
Do you have the same indicator as me? If yes, then when you watch market during weekend - adjust the number of period to "-1". The point is that in this case it will treat passed week as previous week and will show you the numbers.
But in the begining of the week - return it back to "0". I've found that sometimes it has bug on Mondays - shows pivots incorrectly.
And finally - you can calculate pivots in excell

Hi guys,
BTW, Sive what is the blue line on the Thursday update on Daily chart? It looks like DMA but it's always bellow price and isn't shifted forward.