Sive Morten
Special Consultant to the FPA
- Messages
- 18,669
Monthly
The dollar edged lower against the euro on Friday while rising against the yen on greater investor risk appetite after comments from a Chinese official indicated the government could implement more stimulus. China's Premier Li Keqiang sought to reassure global investors that Beijing was ready to support the cooling economy, saying the government had the necessary policies in place and would push ahead with infrastructure investment. The comments helped push the euro up against the dollar while weighing on the safe-haven yen. The euro tends to attract buyers during periods of greater risk. The increased appetite for risk also showed in a rise in the U.S. stock market, although stocks later pared gains, led by a decline in the biotechnology sector. Hopes for stimulus out of China ramped up risk appetite in the currency market, said Joseph Trevisani, chief market strategist at WorldWideMarkets in Woodcliff Lake, New Jersey.
Traders also said they had doubts as to whether the European Central Bank would implement further monetary easing at its meeting on April 3, despite statements from ECB policymakers on Tuesday hinting at the potential for more easing to prevent deflation. A Reuters poll showed that only two of 72 economists now predict a rate cut from the ECB at its April 3 meeting, versus 26 of 78 who did before last month's meeting. Nevertheless, the ECB policymakers' statements weighed on the euro this week, since the monetary easing would weaken the euro currency. A key statement on Tuesday came from ECB governing council member and Bundesbank chief Jens Weidmann, who said negative interest rates were an option to temper euro strength and that quantitative easing was not out of the question. The doubts surrounding a rate cut persisted even as German consumer prices harmonised with other EU countries rose by 0.3 percent on the month and 0.9 percent on the year in March, according to preliminary data from the Federal Statistics Office Friday, which fell below a Reuters forecast. "It's possible that the ECB surprises us and doesn't do anything," said Marc Chandler, global head of currency strategy at Brown Brothers Harriman in New York. While the euro gained slightly against the dollar on the day, it was well below its weekly high of $1.3877, which it touched on Monday after weak U.S. manufacturing data led investors to take profits in the dollar and favor the euro.
The dollar was last up 0.61 percent against the yen to trade at 102.79. The dollar earlier hit a roughly two-week high against the yen of 102.98. The U.S. dollar index, which measures the dollar against six major currencies, was last up 0.1 percent at 80.195. Commerce Department data released Friday showing U.S. consumer spending rose 0.3 percent last month after a downwardly revised gain of 0.2 percent in January supported the dollar's gains against the yen.
Technical
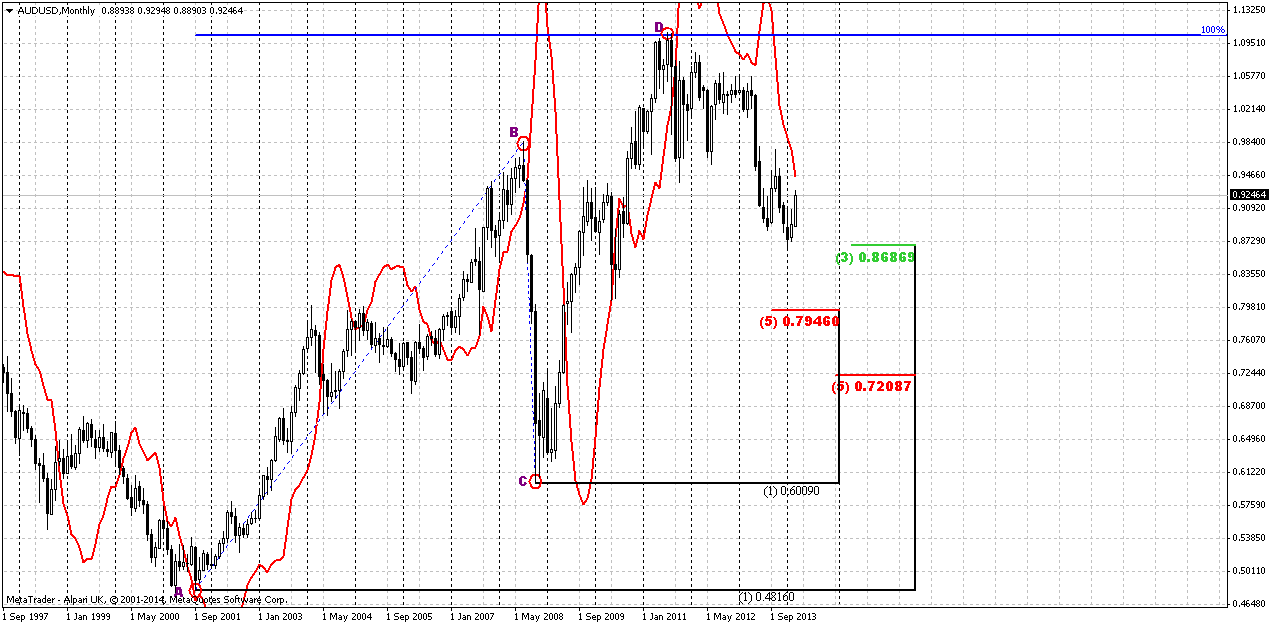
Today guys, we will talk on AUD, because right now this pair is most interesting and offers patterns and setups as on long-term as on short-term charts. Besides, we have not spoken on AUD very long time allready. Our analysis on EUR, NZD and JPY at least long-term are still valid and were not broken by price action yet.
Trend stands bearish here, market is not at oversold. The core of monthly setup is a huge AB=CD pattern. Market has hit it’s 1.0 extension target in January 2011 and current move down is retracement, some kind of reaction on reaching objective point of AB-CD. Here are two major and important moments. First is concerning AB=CD itself. Take a look at CD leg is much faster than AB. As a rule after respect of reaching AB-CD target, it leads to next extension either 1.27 or even 1.618. But the depth of retracement down could be different. Currently we see that market has reached first monthly Fib support and bounce out of it.
Second issue - AB-CD pattern will be valid if even price will retrace to 0.72 Fib support. So, current move up does not mean yet that downward retracement was ended. It is understandably that for bulls as shyer retracement is all the better and if market is really bullish in long term, it probably should not reach as far as 0.72 level, especially because acceleration on CD leg, but still deep retracement is possible and it will not break overall bullish action for a long time, probably.
In short-term perspective we’re mostly interested in current upward bounce out from monthy Fib support.
Weekly
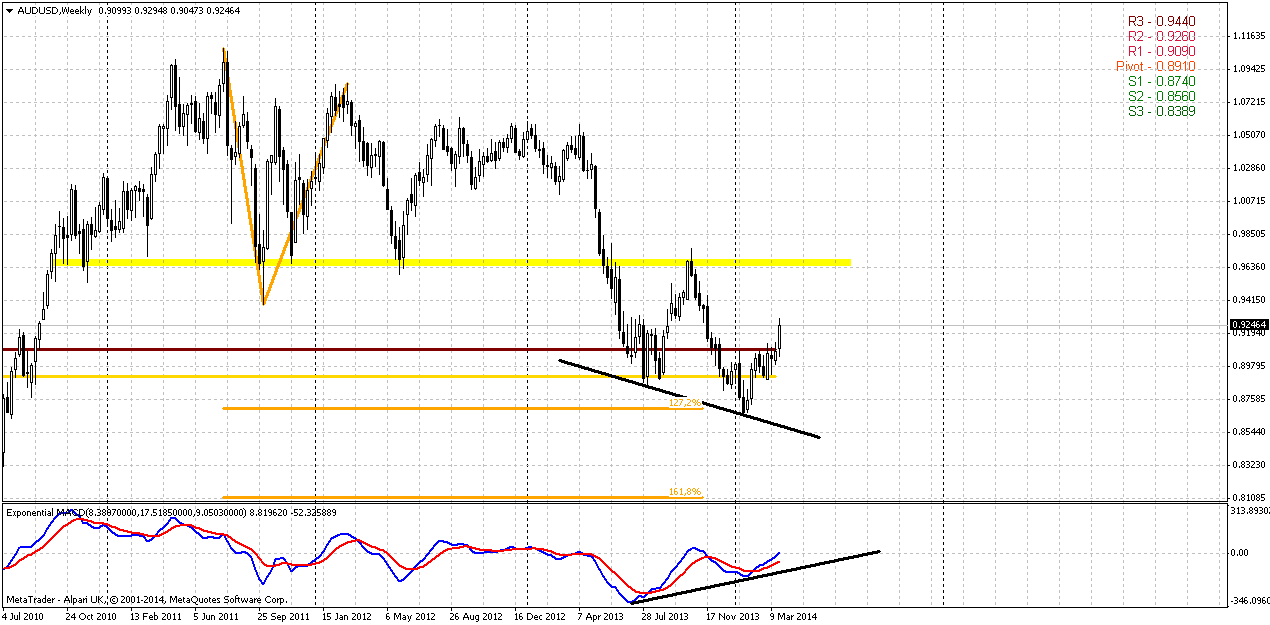
On weekly chart trend holds bullish. We’ve got nice bullish divergence with MACD right at monthly Fib support area and looks like current move up is reaction on this support. Situation here is simple and sophisticated simultaneously. Simple is because it is not a tough task to estimate when we could say that upward trend has re-established. For that purpose we need to see that market will exceed 0.9760 top and return right back inside of previous consolidation, right? In this case we will get upward reversal swing first and second – enter back in consolidation usually leads market to opposite border or even to breakout. Right now we see that price stands significantly higher than MPP and even MPR1. This tells us that current move up will continue.
Sophisticated part stands here as well, because we do not know whether current move up is really medium-term bull trend or just a bounce up from monthly Fib support and we will see another leg down. If this will happen, then market probably could reach 1.618 target of initial AB-CD pattern – 0.81. Some pattern could be formed – wedge, downward channel, etc. Also, if you will treat BC leg of our pattern as butterfly’s left wing you’ll see that price has hit 1.27 target of this butterfly, has shown upward bounce – right to the border of consolidation ~0.9760 and turned down again, but has not reached 1.618 extension as well as some targets... This tells that may be current move still could continue a bit more, as current action up is strong, but we have no assurance yet that we will not get another leg down.
Daily
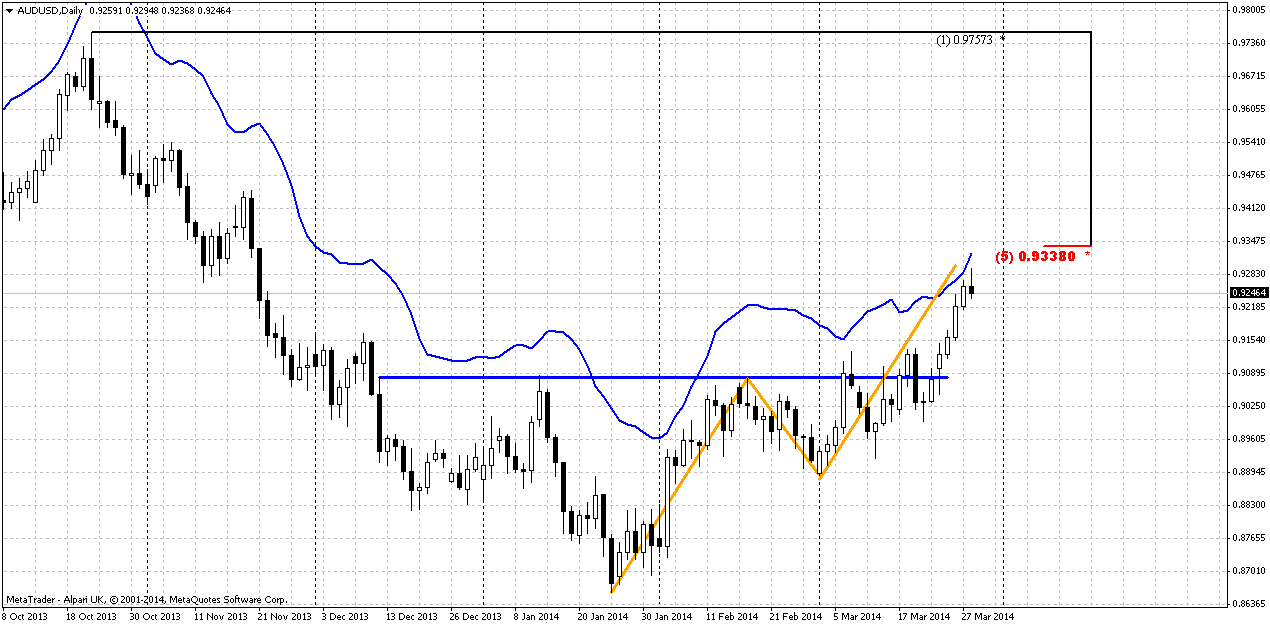
Daily picture makes short-term situation simpler and points on single preferable direction – down. I do not want to say that this is the end and we will see new medium-term downward trend – absolutely not. I’m just speaking about few days – 1 week perspective as maximum. The reason for this is Agreement resistance around 0.9340 and daily overbought. This is deadly combination for short-term upward action. Simultaneously this is DiNapoli bearish “Stretch” pattern that should trigger downward retracement. Currently we have no facts to start speaking about downward reversal yet, thus let’s treat it as retracement by far. But still will keep in mind possible downward continuation. As we’ve said above – we have monthly fib support, here, on daily we’ve got reversed H&S pattern as reaction on this support, but this pattern has completed its normal target. First is retracement down, but what will follow next?
4-hour
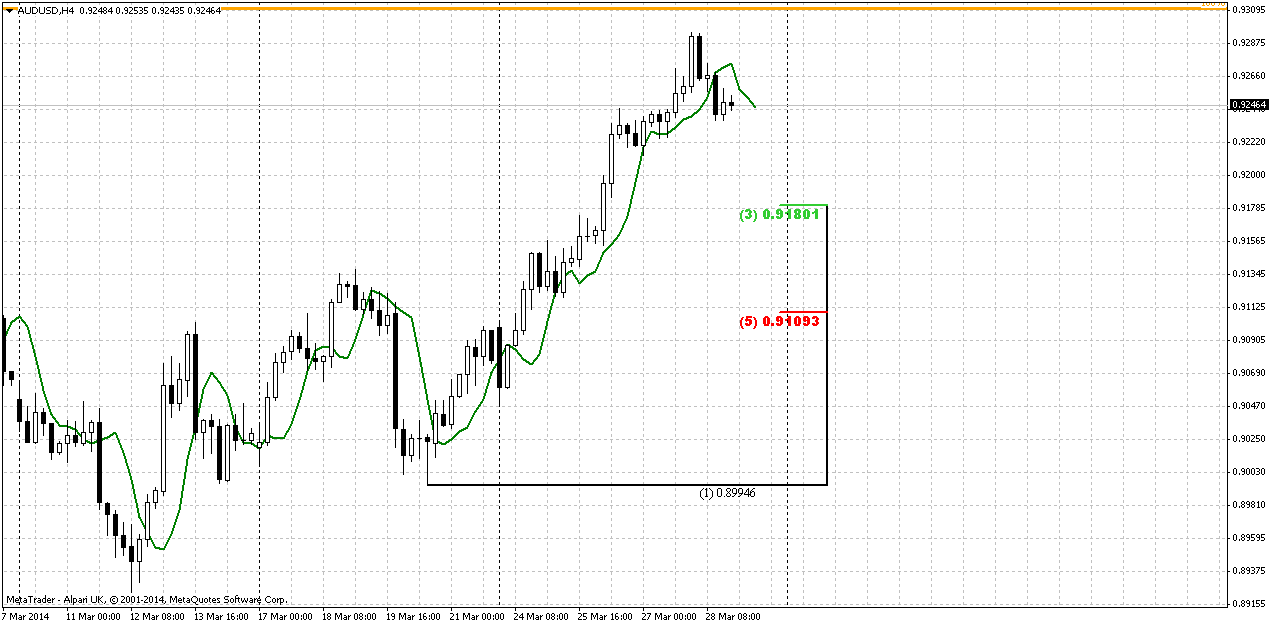
This time frame shows that downward action could be triggered by DiNapoli “DRPO” Sell pattern. But before this will happen, market probably will form some minor Butterfly “Sell” patern or just show small upward move to reach AB-CD target. You can see here that target has not quite been reached. This is perfect for DRPO pattern when second tops is greater. Thurst itself is not perfect but acceptable. Potential target of this trade stands ~ 100 pips down to 0.9140 area
Conclusion:
On really big picture perspectives of AUD look interesting, mostly due fast acceleration on CD leg of huge monthly AB=CD. Meantime, as AB=CD target itself has been reached – market right now stands in reasonable retracement. To be honest price could turn up from any Fib support level till 0.7210 and this will not break AB-CD based setup. Now we see market response on reaching first Fib support at 0.8687. All that we can say right now is that upward reaction should continue a bit more, since price has moved above as MPP as MPR1 – that’s the sign of bullish trend on weekly chart. May be if market will form some pattern later we will say more about long-term retracement. Thus, if we will get, say, bearish grabber on monthly chart – we would say about further downward action to next Fib support area.
On very short-term perspective (few days-1week) we should be ready for downward retracement, since AUD has created deadly short-term combination – AB-CD completion right at Fib resistance + Daily Oversold. Thus, on Monday-Tuesday we should watch for bearish reversal patterns on intraday charts. One of them is DRPO “Sell”. But be careful of possible another minor leg up first, since AB-CD target has not quite reached yet.
The technical portion of Sive's analysis owes a great deal to Joe DiNapoli's methods, and uses a number of Joe's proprietary indicators. Please note that Sive's analysis is his own view of the market and is not endorsed by Joe DiNapoli or any related companies.
The dollar edged lower against the euro on Friday while rising against the yen on greater investor risk appetite after comments from a Chinese official indicated the government could implement more stimulus. China's Premier Li Keqiang sought to reassure global investors that Beijing was ready to support the cooling economy, saying the government had the necessary policies in place and would push ahead with infrastructure investment. The comments helped push the euro up against the dollar while weighing on the safe-haven yen. The euro tends to attract buyers during periods of greater risk. The increased appetite for risk also showed in a rise in the U.S. stock market, although stocks later pared gains, led by a decline in the biotechnology sector. Hopes for stimulus out of China ramped up risk appetite in the currency market, said Joseph Trevisani, chief market strategist at WorldWideMarkets in Woodcliff Lake, New Jersey.
Traders also said they had doubts as to whether the European Central Bank would implement further monetary easing at its meeting on April 3, despite statements from ECB policymakers on Tuesday hinting at the potential for more easing to prevent deflation. A Reuters poll showed that only two of 72 economists now predict a rate cut from the ECB at its April 3 meeting, versus 26 of 78 who did before last month's meeting. Nevertheless, the ECB policymakers' statements weighed on the euro this week, since the monetary easing would weaken the euro currency. A key statement on Tuesday came from ECB governing council member and Bundesbank chief Jens Weidmann, who said negative interest rates were an option to temper euro strength and that quantitative easing was not out of the question. The doubts surrounding a rate cut persisted even as German consumer prices harmonised with other EU countries rose by 0.3 percent on the month and 0.9 percent on the year in March, according to preliminary data from the Federal Statistics Office Friday, which fell below a Reuters forecast. "It's possible that the ECB surprises us and doesn't do anything," said Marc Chandler, global head of currency strategy at Brown Brothers Harriman in New York. While the euro gained slightly against the dollar on the day, it was well below its weekly high of $1.3877, which it touched on Monday after weak U.S. manufacturing data led investors to take profits in the dollar and favor the euro.
The dollar was last up 0.61 percent against the yen to trade at 102.79. The dollar earlier hit a roughly two-week high against the yen of 102.98. The U.S. dollar index, which measures the dollar against six major currencies, was last up 0.1 percent at 80.195. Commerce Department data released Friday showing U.S. consumer spending rose 0.3 percent last month after a downwardly revised gain of 0.2 percent in January supported the dollar's gains against the yen.
Technical
Today guys, we will talk on AUD, because right now this pair is most interesting and offers patterns and setups as on long-term as on short-term charts. Besides, we have not spoken on AUD very long time allready. Our analysis on EUR, NZD and JPY at least long-term are still valid and were not broken by price action yet.
Trend stands bearish here, market is not at oversold. The core of monthly setup is a huge AB=CD pattern. Market has hit it’s 1.0 extension target in January 2011 and current move down is retracement, some kind of reaction on reaching objective point of AB-CD. Here are two major and important moments. First is concerning AB=CD itself. Take a look at CD leg is much faster than AB. As a rule after respect of reaching AB-CD target, it leads to next extension either 1.27 or even 1.618. But the depth of retracement down could be different. Currently we see that market has reached first monthly Fib support and bounce out of it.
Second issue - AB-CD pattern will be valid if even price will retrace to 0.72 Fib support. So, current move up does not mean yet that downward retracement was ended. It is understandably that for bulls as shyer retracement is all the better and if market is really bullish in long term, it probably should not reach as far as 0.72 level, especially because acceleration on CD leg, but still deep retracement is possible and it will not break overall bullish action for a long time, probably.
In short-term perspective we’re mostly interested in current upward bounce out from monthy Fib support.
Weekly
On weekly chart trend holds bullish. We’ve got nice bullish divergence with MACD right at monthly Fib support area and looks like current move up is reaction on this support. Situation here is simple and sophisticated simultaneously. Simple is because it is not a tough task to estimate when we could say that upward trend has re-established. For that purpose we need to see that market will exceed 0.9760 top and return right back inside of previous consolidation, right? In this case we will get upward reversal swing first and second – enter back in consolidation usually leads market to opposite border or even to breakout. Right now we see that price stands significantly higher than MPP and even MPR1. This tells us that current move up will continue.
Sophisticated part stands here as well, because we do not know whether current move up is really medium-term bull trend or just a bounce up from monthly Fib support and we will see another leg down. If this will happen, then market probably could reach 1.618 target of initial AB-CD pattern – 0.81. Some pattern could be formed – wedge, downward channel, etc. Also, if you will treat BC leg of our pattern as butterfly’s left wing you’ll see that price has hit 1.27 target of this butterfly, has shown upward bounce – right to the border of consolidation ~0.9760 and turned down again, but has not reached 1.618 extension as well as some targets... This tells that may be current move still could continue a bit more, as current action up is strong, but we have no assurance yet that we will not get another leg down.
Daily
Daily picture makes short-term situation simpler and points on single preferable direction – down. I do not want to say that this is the end and we will see new medium-term downward trend – absolutely not. I’m just speaking about few days – 1 week perspective as maximum. The reason for this is Agreement resistance around 0.9340 and daily overbought. This is deadly combination for short-term upward action. Simultaneously this is DiNapoli bearish “Stretch” pattern that should trigger downward retracement. Currently we have no facts to start speaking about downward reversal yet, thus let’s treat it as retracement by far. But still will keep in mind possible downward continuation. As we’ve said above – we have monthly fib support, here, on daily we’ve got reversed H&S pattern as reaction on this support, but this pattern has completed its normal target. First is retracement down, but what will follow next?
4-hour
This time frame shows that downward action could be triggered by DiNapoli “DRPO” Sell pattern. But before this will happen, market probably will form some minor Butterfly “Sell” patern or just show small upward move to reach AB-CD target. You can see here that target has not quite been reached. This is perfect for DRPO pattern when second tops is greater. Thurst itself is not perfect but acceptable. Potential target of this trade stands ~ 100 pips down to 0.9140 area
Conclusion:
On really big picture perspectives of AUD look interesting, mostly due fast acceleration on CD leg of huge monthly AB=CD. Meantime, as AB=CD target itself has been reached – market right now stands in reasonable retracement. To be honest price could turn up from any Fib support level till 0.7210 and this will not break AB-CD based setup. Now we see market response on reaching first Fib support at 0.8687. All that we can say right now is that upward reaction should continue a bit more, since price has moved above as MPP as MPR1 – that’s the sign of bullish trend on weekly chart. May be if market will form some pattern later we will say more about long-term retracement. Thus, if we will get, say, bearish grabber on monthly chart – we would say about further downward action to next Fib support area.
On very short-term perspective (few days-1week) we should be ready for downward retracement, since AUD has created deadly short-term combination – AB-CD completion right at Fib resistance + Daily Oversold. Thus, on Monday-Tuesday we should watch for bearish reversal patterns on intraday charts. One of them is DRPO “Sell”. But be careful of possible another minor leg up first, since AB-CD target has not quite reached yet.
The technical portion of Sive's analysis owes a great deal to Joe DiNapoli's methods, and uses a number of Joe's proprietary indicators. Please note that Sive's analysis is his own view of the market and is not endorsed by Joe DiNapoli or any related companies.
Last edited:

.jpg")
.jpg")
.jpg")
