hey sive.
hey sive,
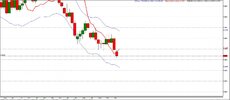
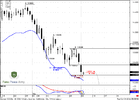
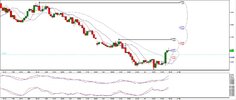
the market has accomplished our plan and moved lower to 1.3270 and below,
you said to search for buy signals but found NONE.
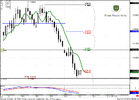
however i did manage to find a possible stop grabber on the daily chart or ( potential )
pic attached.
Yousuf.
P.S : Do you think market will reach to daily oversold area of 1.3054, and then reverse?
hey sive,
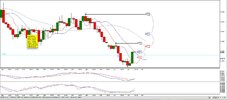
the market has accomplished our plan and moved lower to 1.3270 and below,
you said to search for buy signals but found NONE.
however i did manage to find a possible stop grabber on the daily chart or ( potential )
pic attached.
Yousuf.
P.S : Do you think market will reach to daily oversold area of 1.3054, and then reverse?