FOREX PRO Weekly October 03-07, 2011

One broker on the forex spot market (fxdd) shows a RRT and bullish engulfing on the daily chart. Another broker, (Tadawul, which opens and closes an hour later than fxdd) shows the day both starting and ending inside of yesterday"s candle, (i.e. no RRT, no bullish engulfing). This make it very difficult to know what to do. Can you tell us what the futures market shows on a daily chart?
 
Last edited:
i took a DRPO buy on 1 hour chart upto the 0.618 resistance of the recent move down, which is around 1.3300.

There was a bearish pin bar on the 4 hour chart on around strong resistance of 25x5 MA, 0.618 resistance and psychological level. so i took profit and took a short position, as BREAD&BUTTER "SELL" and the daily time frame trend is bearish too.

On the 4 hour chart, if we take point

A = 1.33805
B = 1.31454
C = 1.33152

OP = 1.30801 ( which is also daily oversold.)

There is also hidden bearish divergence on the 1 hour chart.

Pics attached.

Yousuf.

Hi Yousuf,

I'm interested with your platform which is almost similar to DiNapoli pack. Kindly could you pls tell us where and how to get it?

Thanks and Best Regards.
 
EUR/USD Daily Update, Wed 05, October 2011

Good morning,
market has not shown any impressive price action yesterday, but still there is something to discuss...

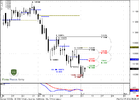
First, on daily time frame market has formed inverse Hammer pattern, so it could become our beacon of further price action. If market will take it low, then downmove will continue. Until this will happen, we can expect some retracement.
The first target of this retracement on daily is 1.3440-1.3470 K-area and pivot point.

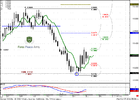
On 4 hour chart, I see potential B&B "Sell" with 1.3230 target. Also pay attention how market has reached 1.0 target at 1.3158 by small W&R.

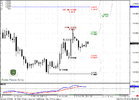
The major question now is Has B&B started already or not. If we will take a look at hourly chart and extensions, then we might say, that market has reached 0.382 resistance and Agreement with 0.618 target, and probably can start move down right from here, 60 min trend has turned bearish.
From the another point of view, market could try to reach 1.0 extention around 1.3375-1.34 first, and only after that will turn to downward move. That is the task that we have to resolve now.
 

Attachments

  • EUR_D_05_10_11.PNG
    EUR_D_05_10_11.PNG
    39.6 KB · Views: 208
  • EUR_4H_05_10_11.PNG
    EUR_4H_05_10_11.PNG
    43.4 KB · Views: 203
  • EUR_1H_05_10_11.PNG
    EUR_1H_05_10_11.PNG
    41.2 KB · Views: 203
One broker on the forex spot market (fxdd) shows a RRT and bullish engulfing on the daily chart. Another broker, (Tadawul, which opens and closes an hour later than fxdd) shows the day both starting and ending inside of yesterday"s candle, (i.e. no RRT, no bullish engulfing). This make it very difficult to know what to do. Can you tell us what the futures market shows on a daily chart?

Hi Icarus,
I've posted charts in update. I possibly treat this move as just accomplishment of 4-hour AB-CD target, at least as small W&R of previous lows on hourly chart.
But not as RRT...
 
hey sive.

Hi, rashidin5178

I use the DiNapoli pack on the GFT uk Platform.

But its pointless subscribing to it, unless you read the book "Trading with DiNapoli Level"

Also, i NEVER take a trade, based on my analysis of DiNapoli levels, until i read sive's views, because im still a Noob.

Yousuf.
 
hey sive.

hi sive,

would you tread the yesterdays bull candle and the the day before's bear candle,

as DiNapoli's RAIL ROAD TRACK directional indicator?

Yousuf.
 
Hello Sive!
Do you think B&B is still possible on H4? There are too many closes above 3x3 DMA.

Hi Pragmatic,
I can't say that this will happen 100%, but thrust down is good and market has not shown yet 0.618 retracement. So, I think that this is still possible...
 
One broker on the forex spot market (fxdd) shows a RRT and bullish engulfing on the daily chart. Another broker, (Tadawul, which opens and closes an hour later than fxdd) shows the day both starting and ending inside of yesterday"s candle, (i.e. no RRT, no bullish engulfing). This make it very difficult to know what to do. Can you tell us what the futures market shows on a daily chart?

hi Icarus, what's RRT ?
Where i can learn about RRT ?

-Thank You-
 
Hi Sive!

Regarding B/B directional indicator Dinapoli states in his book that the level of retracement (where we enter) after the initial penetracion on close of the 3x3 should manifest within one to three periods. Last week on daily GBP/USD it took 4 periods,(4 days) and today on 4-hour EUR/USD we are on the 7th bar and still no clear signals. How are we supposed to treat this kind of price action? It exist a BB signal failure just like with DRPO???

Have a good day and thanks!
 
Back
Top