Sive Morten
Special Consultant to the FPA
- Messages
- 18,754
Monthly
By looking at different currency pairs accross the board, I didn’t find anything special and anything that significantly more interesting than EUR. At the same time situation at EUR itself is not very fascinating. And this is undertsandably – investors are waiting. Friday’s downward action looks mostly as profit taking after 4 consequitive weeks of growth, before weekend and due gradual approaching to October 17th. If no solution will come, market will become more and more nervous, volatility will grow.
Currently October candle looks not very impressive. On previous week, before shut down situation we said that situation looks moderately bullish. Market has moved above previous highs and through upper border of the flag pattern. And market has moved above 50% resistance again. Next monthly target is 1.3775-1.3830 area. It includes yearly pivot resistance1, 5/8 Fib resistance and minor 0.618 extension target of current AB-CD up. Other words, we have an Agreement around YPR1. Trend holds bullish here.
So, it seems that now price stands in some kind of “free zone” with no solid resistances around. But somehow it wasn’t able to continue move higher and current week shows minor pullback right from the top. Anything could change of cause, and major part of October still the same, but usually when market passes through some resistance it shows acceleration or stable continuation. But as fundamental situation has become a dominant one, it stronger impacts on markets in short-term period that usually. This could lead to some different way action, since investors are mostly driven by other thoughts than previously. That’s being said, in normal situation, if we wouldn’t get any shutdown, we could clarify this setuation as sign of weakness. But currently it is not neccesary so, just other factors impact investors behavior.

Weekly
As price action was not impressive, weekly analysis mostly remains the same. I can find only one reason here (except thought that this could be profit taking), why market has not continued move up – 1.27 extension of AB=CD pattern. Since nothing has changed drastically yet here, analysis will be the same as well.
Trend is still bullish here. Currently we have the only pattern here and this is butterfly “sell” and we still use AB=CD extension on monthly chart. Trend is bullish here. As market has passed through as MPR1 as MPR2 of September it is solid challenge on continuation and it looks like that we should see it, at least from technical point of view, since we do not know what else surprises could come from shut down. Long term invalidation point is a low of butterlfy (in red circle). If market will move below it – it will not only erase butterfly but also put under question our monthly AB=CD. Trend also will shift bearish probably around this level. Take a look that we have really huge resistance cluster at 1.38-1.39 area. Recall monthly target and Fib level and now add 1.27 butterfly target, weekly overbought and inner 1.618 AB=CD target. But fortunately we have pretty a lot of room till this area. Second, butterfly pattern could be a long-play one. May be there will be some retracement around 1.27 extension, but who says that it can’t proceed to 1.618? And guys, I have suspicious that this will be the case.
Recall how 2 weeks ago we’ve talked about EUR swings on weekly chart. EUR usually shows AB=CD with very small BC leg. When it completes 100% of this AB=CD it shows significant and wide retracement/consolidations. That is where we stand now and later it usually skyrockets to 1.618 of initial AB-CD. That is an area where 1.618 of our butterfly stands – around 1.42-1.43 This stands beyond a bit of our weekly analysis cycle and overbought but this is really thrilling perspective....
The thing that we do not want to see is a deep and stable return below previous highs around 1.3450 by reasons that we’ve discussed many times on daily time frame.

Daily
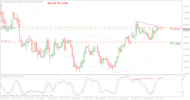
On previous week, although market has shown upward move, but has not quite reached major resistance around MPR1 and 1.618 extension of previous retracement. As we’ve suggested above the possible reason is 1.27 extension of weekly AB=CD pattern. Anyway, price has formed bearish engulfing pattern. As we know minimum target of this pattern is move down equal to the length of the bars and it stands around daily K-support and previous swing high. Also market has not tested yet MPP, so, if this move down will really take place that also could become a challenge to test MPP. Invalidation point is a top of this pattern.
Trend holds bullish still, but price stands very close to breakeven point. As price now stands at the top of previously broken consolidation and near first Fib support 1.3523, probably we could get some bounce up from it in the beginning of the week. Depending on the style of bouncing we will make a decision whether to take short position here or not. We do not want to see fast long white candles on intraday chart, because it could be more a sign of continuation up, rather than retracement. We want see small candles and lazy gradual action to the upside, not too steep.

4-hour
Another target stands in an area of daily K-support. This is ultimate 1.27 extension for butterfly “Sell”. It is not quite often could be seen, when market really hits such extended targets, but as it stands in agreement with daily K-support, engulfing target and MPP, we can take it into consideration.
Second moment is that market stands at support now – as we’ve said previous consolidation, but also upward trend line and 1.3523 area – nearest Fib support. Thus, our first step in plan – wait for reasonable bounce up and then decide whether to take position or not.

60-min
Market will open around WPP on next week. Since we have here nice K-resistance, it will become the first level to watch, probably. At the same time, EUR has a tendency to show 50% retracements. That’s why, our major area to watch for will be a range between K-resistance and 50% major level – 1.3580-1.3590

Conclusion:
On big picture market stands at the eve of opening solid bullish perspectives initially to 1.38 area and ultimately up to 1.42-1.43. At least, currently it looks so, although shut down could easily correct technical picture, since markets now stand in extraordinary action and are driven by absolutely different factors.
In such environment it is better to stick with some clear patterns that could give us clear entry, risk points and risk/reward ratio. Thus, on daily we will try to deal with bearish engulfing. Our first step is to wait upward bounce from support, second one is – watch for particular resistance levels for short entry.
The technical portion of Sive's analysis owes a great deal to Joe DiNapoli's methods, and uses a number of Joe's proprietary indicators. Please note that Sive's analysis is his own view of the market and is not endorsed by Joe DiNapoli or any related companies.
By looking at different currency pairs accross the board, I didn’t find anything special and anything that significantly more interesting than EUR. At the same time situation at EUR itself is not very fascinating. And this is undertsandably – investors are waiting. Friday’s downward action looks mostly as profit taking after 4 consequitive weeks of growth, before weekend and due gradual approaching to October 17th. If no solution will come, market will become more and more nervous, volatility will grow.
Currently October candle looks not very impressive. On previous week, before shut down situation we said that situation looks moderately bullish. Market has moved above previous highs and through upper border of the flag pattern. And market has moved above 50% resistance again. Next monthly target is 1.3775-1.3830 area. It includes yearly pivot resistance1, 5/8 Fib resistance and minor 0.618 extension target of current AB-CD up. Other words, we have an Agreement around YPR1. Trend holds bullish here.
So, it seems that now price stands in some kind of “free zone” with no solid resistances around. But somehow it wasn’t able to continue move higher and current week shows minor pullback right from the top. Anything could change of cause, and major part of October still the same, but usually when market passes through some resistance it shows acceleration or stable continuation. But as fundamental situation has become a dominant one, it stronger impacts on markets in short-term period that usually. This could lead to some different way action, since investors are mostly driven by other thoughts than previously. That’s being said, in normal situation, if we wouldn’t get any shutdown, we could clarify this setuation as sign of weakness. But currently it is not neccesary so, just other factors impact investors behavior.
Weekly
As price action was not impressive, weekly analysis mostly remains the same. I can find only one reason here (except thought that this could be profit taking), why market has not continued move up – 1.27 extension of AB=CD pattern. Since nothing has changed drastically yet here, analysis will be the same as well.
Trend is still bullish here. Currently we have the only pattern here and this is butterfly “sell” and we still use AB=CD extension on monthly chart. Trend is bullish here. As market has passed through as MPR1 as MPR2 of September it is solid challenge on continuation and it looks like that we should see it, at least from technical point of view, since we do not know what else surprises could come from shut down. Long term invalidation point is a low of butterlfy (in red circle). If market will move below it – it will not only erase butterfly but also put under question our monthly AB=CD. Trend also will shift bearish probably around this level. Take a look that we have really huge resistance cluster at 1.38-1.39 area. Recall monthly target and Fib level and now add 1.27 butterfly target, weekly overbought and inner 1.618 AB=CD target. But fortunately we have pretty a lot of room till this area. Second, butterfly pattern could be a long-play one. May be there will be some retracement around 1.27 extension, but who says that it can’t proceed to 1.618? And guys, I have suspicious that this will be the case.
Recall how 2 weeks ago we’ve talked about EUR swings on weekly chart. EUR usually shows AB=CD with very small BC leg. When it completes 100% of this AB=CD it shows significant and wide retracement/consolidations. That is where we stand now and later it usually skyrockets to 1.618 of initial AB-CD. That is an area where 1.618 of our butterfly stands – around 1.42-1.43 This stands beyond a bit of our weekly analysis cycle and overbought but this is really thrilling perspective....
The thing that we do not want to see is a deep and stable return below previous highs around 1.3450 by reasons that we’ve discussed many times on daily time frame.
Daily
On previous week, although market has shown upward move, but has not quite reached major resistance around MPR1 and 1.618 extension of previous retracement. As we’ve suggested above the possible reason is 1.27 extension of weekly AB=CD pattern. Anyway, price has formed bearish engulfing pattern. As we know minimum target of this pattern is move down equal to the length of the bars and it stands around daily K-support and previous swing high. Also market has not tested yet MPP, so, if this move down will really take place that also could become a challenge to test MPP. Invalidation point is a top of this pattern.
Trend holds bullish still, but price stands very close to breakeven point. As price now stands at the top of previously broken consolidation and near first Fib support 1.3523, probably we could get some bounce up from it in the beginning of the week. Depending on the style of bouncing we will make a decision whether to take short position here or not. We do not want to see fast long white candles on intraday chart, because it could be more a sign of continuation up, rather than retracement. We want see small candles and lazy gradual action to the upside, not too steep.
4-hour
Another target stands in an area of daily K-support. This is ultimate 1.27 extension for butterfly “Sell”. It is not quite often could be seen, when market really hits such extended targets, but as it stands in agreement with daily K-support, engulfing target and MPP, we can take it into consideration.
Second moment is that market stands at support now – as we’ve said previous consolidation, but also upward trend line and 1.3523 area – nearest Fib support. Thus, our first step in plan – wait for reasonable bounce up and then decide whether to take position or not.
60-min
Market will open around WPP on next week. Since we have here nice K-resistance, it will become the first level to watch, probably. At the same time, EUR has a tendency to show 50% retracements. That’s why, our major area to watch for will be a range between K-resistance and 50% major level – 1.3580-1.3590
Conclusion:
On big picture market stands at the eve of opening solid bullish perspectives initially to 1.38 area and ultimately up to 1.42-1.43. At least, currently it looks so, although shut down could easily correct technical picture, since markets now stand in extraordinary action and are driven by absolutely different factors.
In such environment it is better to stick with some clear patterns that could give us clear entry, risk points and risk/reward ratio. Thus, on daily we will try to deal with bearish engulfing. Our first step is to wait upward bounce from support, second one is – watch for particular resistance levels for short entry.
The technical portion of Sive's analysis owes a great deal to Joe DiNapoli's methods, and uses a number of Joe's proprietary indicators. Please note that Sive's analysis is his own view of the market and is not endorsed by Joe DiNapoli or any related companies.