Sive Morten
Special Consultant to the FPA
- Messages
- 18,662
Fundamentals
This week markets were moving mostly by political news. As usual they have come surprisingly and made strong impact on FX, especially on GBP. In fact, we have two major group of events - progress in US/China negotiations and rumors around Brexit agreement. Since these factors make impact on all currency pairs, we try to cover these events in one report.
Week has started with rumors around positive progress in US/China deal. Aussie dollar has shown positive reaction on these press release. By the end of the week, on Friday, U.S. President Donald Trump outlined the first phase of a deal to end a trade war with China and suspended a threatened tariff hike, but officials on both sides said much more work needed to be done before an accord could be agreed.
The emerging deal, covering agriculture, currency and some aspects of intellectual property protections, would represent the biggest step by the two countries in 15 months to end a tariff tit-for-tat that has whipsawed financial markets and slowed global growth.
But Friday’s announcement did not include many details and Trump said it could take up to five weeks to get a pact written.
He acknowledged the agreement could fall apart during that period, though he expressed confidence that it would not.
In an editorial published online by the state-run People’s Daily newspaper on Saturday, China called the latest round of talks constructive, frank and efficient and noted that while the two sides were moving toward a resolution, “it is impossible to resolve the problem by putting arbitrary pressure on the Chinese side.”
Trump, who is eager to show farmers in political swing states that he has their backs, lauded China for agreeing to buy as much as $50 billion in agricultural products. But he left tariffs on hundreds of billions of dollars of Chinese products in place.
Recall what we've talked about pork price in China last week and bingo - "On Thursday, the U.S. Department of Agriculture confirmed net sales of 142,172 tonnes of U.S. pork to China in the week ended Oct. 3, the largest weekly sale to the world’s top pork market on record."
At the same time this "new turn" in negotiations do not touch existed tariffs, they will not be cancelled. Maybe they will not be increased from 25% to 30% level, as S. Mnuchin has suggested, but 25% fee definitely stands in place by far.
Second - The status of China’s Huawei Technologies Co Ltd, the world’s biggest telecoms gear maker, which has been put on a U.S. trade blacklist since May, was not part of the deal, Lighthizer said.
Trump said some IP issues would be left for later phases of the talks. He said talks over a second phase would begin as soon as the first phase agreement was signed and said a third phase might be necessary, too.
That's why we agree with Liang Haiming, Hong Kong-based chairman of think-tank China Silk Road iValley Research Institute, who called the agreement “anesthetic, pain relief, not an antidote.”
Edward Moya, senior market analyst at OANDA in New York, said the dollar’s moves after Trump’s announcement were in line with the typical “buy the rumour, sell the news” reaction.
“We pretty much got what many people were expecting about a partial deal,” said Moya. “But it doesn’t necessarily provide optimism that in the short run a broader deal will be reached because there are greater issues. It’s still positive though.”
So, it seems that some progress exists, this progress in favor of US, which just should continue to twist China's arms until they grind down everything that they need. EU - standby.
Next topic is Brexit, of course. Sterling took a wild ride on Friday after top EU official Donald Tusk said that the “time is practically up” for Britain to reach a Brexit deal.
It had been lifted on Thursday after British Prime Minister Boris Johnson and his Irish counterpart Leo Varadkar had said they saw “a pathway to a possible deal”. In a joint statement, the British and Irish leaders said they could “see a pathway to a possible deal”. Varadkar also later told reporters that the meeting was “very positive”.
EU Brexit negotiator Michel Barnier said on Friday that he’d had a “constructive” meeting with his British counterpart, Stephen Barclay, and the 27 countries in the EU gave him the go-ahead to try and agree withdrawal arrangements before the Oct. 31 deadline.
Barnier told member states that Britain has changed its position and now accepts that there cannot be the customs border on the island of Ireland, two EU sources said.
“If the meeting doesn’t go too badly you may get a further pop (higher in sterling) but it will be a matter of hours for the ERG and DUP to opine on it,” said Tim Graf, head of macro strategy at Slate Street Global Advisors, referring to the pro-Brexit faction of the British Conservative party and the Northern Irish party which supports the UK government.
“If there’s an endorsement the rally can continue,” Graf added. “But the reality is the extreme Brexit camp seem to be coming to the view that no-deal is the way forward and whatever deal is passed won’t be good enough for them.”
Despite the flurry of activity, it remains uncertain on what terms the UK will leave, when, and even whether it will do so at all.
Sounding a more cautious tone, top EU official Donald Tusk said “time is practically up” for Britain to reach a Brexit deal. That hurt the pound temporarily.
One dealer in London attributed price swings to “algos” - or computer-generated trading algorithms - in a headline-driven market.
Hopes are that a meeting between British and EU negotiators will pave the way for a Brexit transition deal at an Oct. 17-18 summit.. But some doubt Johnson will get the agreement past Britain’s parliament.
But this is not all yet guys. On the back of these large events, the one thing has happened that mostly passed unsigned. But, this is important issue which could make impact on the markets in long-term perspective.
In the United States, the Federal Reserve announced Friday it will start buying about $60 billion per month in Treasury bills to ensure “ample reserves” in the banking system. It emphasized though that the new programme does not mark a change in monetary policy.
“This allays some of the funding concerns and removes some of the upside risks of the squeeze on funding that we saw at month- and quarter-end,” said Shaun Osborne, chief FX strategist at Scotiabank in Toronto.
The U.S. Federal Reserve’s quick pivot from shrinking its balance sheet by around $50 billion per month to now expanding by $60 billion monthly, has shown both the difficulty the Fed has faced under a shifting political environment, as well as the risks of experimenting with market-sensitive systems in real time.
The process of paring the balance sheet from its crisis-era levels of more than $4 trillion in assets, effectively “unwinding” some of the stimulus put in place to battle the worst financial crisis in a century, was agonized over for years by policymakers who were under sometimes intense pressure from Republicans on Capitol Hill who wanted a smaller central bank not so deeply engrained in private markets.
The careful shedding of $50 billion a month was lauded by those lawmakers as the Fed rolled it out in 2017, and was intended, as former Chair Janet Yellen said, to be so boring and non-disruptive it would be “like watching paint dry.”
And so it was, until President Donald Trump took notice near the end of his second year in office, chucked standing Republican concerns over the size of the Fed’s asset holdings, and criticized central bankers for doing what leading members of his party had demanded.
“Stop with the 50 B’s,” Trump tweeted in December.
By July, the $50 billion monthly rundown had ended. Two months later, the Fed confronted a new problem, one which had nothing to do with Trump and everything to do with its new system for managing interest rates.
That system depended on the Fed knowing roughly how much banks would demand in deposits at the central bank, which financial institutions may want to hold for a variety of reasons.
As Northern Trust economist Carl Tannenbaum said, the new operation should definitely be considered under the umbrella of monetary policy. “Monetary policy is implemented with a combination of steps,” he explained. “The steps taken recently by the Fed are part of monetary policy, and have to be considered that.”
Not so, said Dallas Fed President Robert Kaplan.
“It is not intended to create more accommodation or create more stimulus,” told reporters after a talk at the Commonwealth Club in San Francisco. “This is not intended to have any impact on monetary policy. It’s not designed that way.”
The two interest rate reductions passed by the Fed this year have also been characterized as “insurance cuts” meant to extend the recovery and protect an economy that is in a “good place.”
But regardless of the intention, the steps taken this year to reduce rates and now to expand the balance sheet may amount to an unwinding of the monetary policy adjustments made last year, some investors say. If the Fed reduces interest rates twice more this year, it would completely undo the four interest rate hikes passed in 2018.
“It’s effectively quantitative easing. Investors should look at this as yes, a complete reversal of Fed policy from a year ago,” said Chad Morganlander, senior portfolio manager at Washington Crossing Advisors in Florham Park, New Jersey. “It confirms to investors that the Fed has their back. They’ll do whatever it takes to keep the U.S. financial system calm.”
Minneapolis Federal Reserve Bank President Neel Kashkari echoed that message in New York Friday morning. He said that the central bank would be operating with a large balance sheet “for the foreseeable future.”
And he was careful to point out that purchases of short-term Treasury bills are different from purchases of long-term bonds.
“QE was designed to also move long rates by us buying long- term assets,” he said. “If the Fed is buying short-term bills just to provide liquidity to the system, there is nothing QE about that.”
So, guys, a lot of stuff to think about. Speaking on China - this is most clear and certain situation among all other factors. We talked about it many times already - US will press China and twist its arms until they will get what they want. US economy and social sphere more stable and has greater margin of safety compares to China, which already shows slowdown of economy and problems with toxic assets on PBoC balance. The progress that we see in US/China relations means one thing - US will get what they want, and EU will be the next who will feel the heavy arm of US tariffs. Here we see clear domination of US.
Now let's turn to Brexit news. The rally on GBP was great and outstanding, but somehow I tend to more balanced and careful attitude. It is a lot of emotions in recent reaction which doesn't match to the content. This is an example when appearances are deceiving. Now only event traders and persons who do not understand the problem of the Brexit could buy GBP.
In 2018 we've explained why this is dead way situation for UK. Here I briefly remind you. The stumbling rock in Brexit UK/EU agreement is the border that will split economical zones of UK and EU. This border could be either between Republic of Ireland and Northern Ireland, or in the Ireland Sea between Ireland island and Great Britain island.
First case, when "hard" border will split Ireland in two parts is unacceptable, because everybody keeps memories of conflicts in 70-80's and carry on Belfast agreement (Good Friday agreement of 1998) which reduce tensions. Besides, here is tricky moment exists, that Conservative cub gets in dependency from N. Ireland unionists. They have just 10 seats, but they in particular provide necessary majority in parlament.
And as we see in recent news - this way was denied as unacceptable. It means that last scenario is possible to split economy space. In this case, the border will be in Ireland Sea - this is a nightmare for all Brits and for Democratic unionists in particular. Because in this case single economic space of Great Britain will be split in two parts.
And now we ask - what particular thing we could celebrate by GBP rally? Nothing was achieved yet. T. May has retired just because neither first way nor second one are acceptable for UK. The fact that B. Johnson excludes the first way is not the reason for optimism yet. Besides, nobody saw any signed Agreements on paper but it is just two weeks till the deadline. Nobody knows what final points will be in this Agreement. It is not necessary to mention here general negative impact when Brexit will happen as for GB as for EU. Problems in UK economy are still stand as well. Thus, we do not see any subject of rejoicing.
Positive rhetoric from EU means that UK accepts concession. Of course, Irish Prime Minister, Leo Varadkar, is happy because UK leaves along his country away from Brexit turmoil and they keep the union of two Ireland.
That's being said, we skeptically look at positive reaction on GBP, have doubts on its durability and do not exclude that it could become good chance to sell GBP.
Drastic change in Fed balance sheet policy tells that Fed adds more dovish measures. At some degree, increasing of a balance works in the same manner as rate cut. In fact, this is the same QE programme. Maybe Fed doesn't want to reverse previous hawkish rate cycle to avoid panic on market but still could add more stimulus using its balance tool. Anyway, other things being equal, this measure makes US dollar weaker.
It will interesting to watch how CFTC positions will change next week. This week we see only EUR net short position increasing, despite good upside performance. On GBP net position stands short without any big changes. But CFTC releases data on Wed, thus, major Friday events are not in this numbers yet:
EUR

Source: cftc.gov
Charting by Investing.com
Technicals
Monthly
In this report we take a look at EUR, but as we try to cover both our major currencies in one report, I mean EUR and GBP - a few words on the latter as well. On GBP we have major weekly K-resistance at 1.2840-1.2880 area. On daily chart we have upside AB=CD with approx. the same OP target. It means that GBP will be interesting on next week or even in two weeks when it will reach major resistance area. Right now, with one white candle pillar on the chart - nothing to discuss. Anyway, sell chances will appear around weekly resistance. Our doubts on buying GBP we've discussed above.

Speaking on EUR - here overall upside action was shyer compares to GBP. We do not see any drastic changes on monthly chart by far October starts with slow pullback. It makes no impact on overall picture, because it is still an inside session.
Technically it could be treated as continuing reaction on Yearly Pivot Support 1. As we've mentioned earlier - market right now stands at crucial area from technical point of view. This is the middle of the range and YPS1. Once EUR will break it - road to the bottom of the range around 1.03 area will be opened.
Overall tendency still stands moderately bearish, as by price action as by MACD trend. In September EUR forms new low, keeping "lower top - lower bottom" sequence.
As we've said earlier, here we could recognize downside narrow channel and market stands accurately inside of it.
Neither big support nor oversold levels stand around and it is free space till 1.03 lows. The only support is YPS1 and middle of the range. That's major technical support here.
Now the major intrigue stands around fundamentals background - it is changing. It is interesting whether its change will be strong enough to make impact on monthly chart and long lasting tendency here.

Weekly
We do not see big impact on weekly chart as well. The upper border of the channel stands around 1.1260 right now and until price stands below it - any action will be just a retracement with no impact on major tendency. The only new thing that could appear soon - is flirting with MACDP line and appearing of the grabber.
Market has to break out from current range to add something new as to monthly as to weekly time frames. As we've said last week, "acceleration" in any direction will have vital impact on the market. Usually when market tests the tension of the bulls, creeping slowly down - it lasts till the first signs of acceleration. Starting to the downside - It will be fatal for EUR and become the harbinger of collapse. Conversely upside acceleration easily could push EUR to the upper border of the channel.
EUR has pretty much room to fluctuate inside the channel. To break the bearish context EUR has to climb above 1.14 top.

Daily
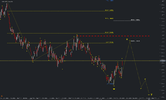
By the end of the week, EUR is completed best-case scenario - OP target has been reached. Market stands near major daily resistance, which includes K-level, daily OB and OP itself. Next XOP target stands at 1.1137, but it is barely interesting on next week.
In fact, here we have "222" sell pattern here, which suggests at least 3/8 retracement.

Intraday
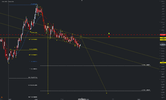
On 4H chart we have another Fib level that agrees with OP target. Also we keep an eye on possible large reverse H&S pattern as well.

In the beginning of the week, we will keep an eye on market reaction on OP target. Potentially EUR could form H&S pattern and reach K-support area around 1.0980 area. In general, this is solid support area, that includes former consolidation, and two pivot lines. Besides, daily "222" pattern also suggests 3/8 retracement.
If no H&S pattern will be formed, we probably are going to major daily resistance and XOP target around 1.11-1.1140

Conclusion:
Fundamental background changes rapidly and it is unclear by far how new Fed initiatives will impact on the market. Fed meeting by the end of the month should provide more clarity on perspective. Still, as currently EUR keeps the upside tendency we follow it.
Disclaimer
This FPA Investment Research is for information and education purposes only. Any decision to make any trade on the market has to be made solely by the reader. Information that is presented in research or its update is not an offer or call to make the trade on the financial markets and expresses just a personal opinion of the author who is might be wrong. Reader has to make decision on any trade solely and care all responsibility for results of this trade.
The technical portion of Sive's analysis owes a great deal to Joe DiNapoli's methods, and uses a number of Joe's proprietary indicators. Please note that Sive's analysis is his own view of the market and is not endorsed by Joe DiNapoli or any related companies.
This week markets were moving mostly by political news. As usual they have come surprisingly and made strong impact on FX, especially on GBP. In fact, we have two major group of events - progress in US/China negotiations and rumors around Brexit agreement. Since these factors make impact on all currency pairs, we try to cover these events in one report.
Week has started with rumors around positive progress in US/China deal. Aussie dollar has shown positive reaction on these press release. By the end of the week, on Friday, U.S. President Donald Trump outlined the first phase of a deal to end a trade war with China and suspended a threatened tariff hike, but officials on both sides said much more work needed to be done before an accord could be agreed.
The emerging deal, covering agriculture, currency and some aspects of intellectual property protections, would represent the biggest step by the two countries in 15 months to end a tariff tit-for-tat that has whipsawed financial markets and slowed global growth.
But Friday’s announcement did not include many details and Trump said it could take up to five weeks to get a pact written.
He acknowledged the agreement could fall apart during that period, though he expressed confidence that it would not.
In an editorial published online by the state-run People’s Daily newspaper on Saturday, China called the latest round of talks constructive, frank and efficient and noted that while the two sides were moving toward a resolution, “it is impossible to resolve the problem by putting arbitrary pressure on the Chinese side.”
Trump, who is eager to show farmers in political swing states that he has their backs, lauded China for agreeing to buy as much as $50 billion in agricultural products. But he left tariffs on hundreds of billions of dollars of Chinese products in place.
Recall what we've talked about pork price in China last week and bingo - "On Thursday, the U.S. Department of Agriculture confirmed net sales of 142,172 tonnes of U.S. pork to China in the week ended Oct. 3, the largest weekly sale to the world’s top pork market on record."
At the same time this "new turn" in negotiations do not touch existed tariffs, they will not be cancelled. Maybe they will not be increased from 25% to 30% level, as S. Mnuchin has suggested, but 25% fee definitely stands in place by far.
Second - The status of China’s Huawei Technologies Co Ltd, the world’s biggest telecoms gear maker, which has been put on a U.S. trade blacklist since May, was not part of the deal, Lighthizer said.
Trump said some IP issues would be left for later phases of the talks. He said talks over a second phase would begin as soon as the first phase agreement was signed and said a third phase might be necessary, too.
That's why we agree with Liang Haiming, Hong Kong-based chairman of think-tank China Silk Road iValley Research Institute, who called the agreement “anesthetic, pain relief, not an antidote.”
Edward Moya, senior market analyst at OANDA in New York, said the dollar’s moves after Trump’s announcement were in line with the typical “buy the rumour, sell the news” reaction.
“We pretty much got what many people were expecting about a partial deal,” said Moya. “But it doesn’t necessarily provide optimism that in the short run a broader deal will be reached because there are greater issues. It’s still positive though.”
So, it seems that some progress exists, this progress in favor of US, which just should continue to twist China's arms until they grind down everything that they need. EU - standby.
Next topic is Brexit, of course. Sterling took a wild ride on Friday after top EU official Donald Tusk said that the “time is practically up” for Britain to reach a Brexit deal.
It had been lifted on Thursday after British Prime Minister Boris Johnson and his Irish counterpart Leo Varadkar had said they saw “a pathway to a possible deal”. In a joint statement, the British and Irish leaders said they could “see a pathway to a possible deal”. Varadkar also later told reporters that the meeting was “very positive”.
EU Brexit negotiator Michel Barnier said on Friday that he’d had a “constructive” meeting with his British counterpart, Stephen Barclay, and the 27 countries in the EU gave him the go-ahead to try and agree withdrawal arrangements before the Oct. 31 deadline.
Barnier told member states that Britain has changed its position and now accepts that there cannot be the customs border on the island of Ireland, two EU sources said.
“If the meeting doesn’t go too badly you may get a further pop (higher in sterling) but it will be a matter of hours for the ERG and DUP to opine on it,” said Tim Graf, head of macro strategy at Slate Street Global Advisors, referring to the pro-Brexit faction of the British Conservative party and the Northern Irish party which supports the UK government.
“If there’s an endorsement the rally can continue,” Graf added. “But the reality is the extreme Brexit camp seem to be coming to the view that no-deal is the way forward and whatever deal is passed won’t be good enough for them.”
Despite the flurry of activity, it remains uncertain on what terms the UK will leave, when, and even whether it will do so at all.
Sounding a more cautious tone, top EU official Donald Tusk said “time is practically up” for Britain to reach a Brexit deal. That hurt the pound temporarily.
One dealer in London attributed price swings to “algos” - or computer-generated trading algorithms - in a headline-driven market.
Hopes are that a meeting between British and EU negotiators will pave the way for a Brexit transition deal at an Oct. 17-18 summit.. But some doubt Johnson will get the agreement past Britain’s parliament.
But this is not all yet guys. On the back of these large events, the one thing has happened that mostly passed unsigned. But, this is important issue which could make impact on the markets in long-term perspective.
In the United States, the Federal Reserve announced Friday it will start buying about $60 billion per month in Treasury bills to ensure “ample reserves” in the banking system. It emphasized though that the new programme does not mark a change in monetary policy.
“This allays some of the funding concerns and removes some of the upside risks of the squeeze on funding that we saw at month- and quarter-end,” said Shaun Osborne, chief FX strategist at Scotiabank in Toronto.
The U.S. Federal Reserve’s quick pivot from shrinking its balance sheet by around $50 billion per month to now expanding by $60 billion monthly, has shown both the difficulty the Fed has faced under a shifting political environment, as well as the risks of experimenting with market-sensitive systems in real time.
The process of paring the balance sheet from its crisis-era levels of more than $4 trillion in assets, effectively “unwinding” some of the stimulus put in place to battle the worst financial crisis in a century, was agonized over for years by policymakers who were under sometimes intense pressure from Republicans on Capitol Hill who wanted a smaller central bank not so deeply engrained in private markets.
The careful shedding of $50 billion a month was lauded by those lawmakers as the Fed rolled it out in 2017, and was intended, as former Chair Janet Yellen said, to be so boring and non-disruptive it would be “like watching paint dry.”
And so it was, until President Donald Trump took notice near the end of his second year in office, chucked standing Republican concerns over the size of the Fed’s asset holdings, and criticized central bankers for doing what leading members of his party had demanded.
“Stop with the 50 B’s,” Trump tweeted in December.
By July, the $50 billion monthly rundown had ended. Two months later, the Fed confronted a new problem, one which had nothing to do with Trump and everything to do with its new system for managing interest rates.
That system depended on the Fed knowing roughly how much banks would demand in deposits at the central bank, which financial institutions may want to hold for a variety of reasons.
As Northern Trust economist Carl Tannenbaum said, the new operation should definitely be considered under the umbrella of monetary policy. “Monetary policy is implemented with a combination of steps,” he explained. “The steps taken recently by the Fed are part of monetary policy, and have to be considered that.”
Not so, said Dallas Fed President Robert Kaplan.
“It is not intended to create more accommodation or create more stimulus,” told reporters after a talk at the Commonwealth Club in San Francisco. “This is not intended to have any impact on monetary policy. It’s not designed that way.”
The two interest rate reductions passed by the Fed this year have also been characterized as “insurance cuts” meant to extend the recovery and protect an economy that is in a “good place.”
But regardless of the intention, the steps taken this year to reduce rates and now to expand the balance sheet may amount to an unwinding of the monetary policy adjustments made last year, some investors say. If the Fed reduces interest rates twice more this year, it would completely undo the four interest rate hikes passed in 2018.
“It’s effectively quantitative easing. Investors should look at this as yes, a complete reversal of Fed policy from a year ago,” said Chad Morganlander, senior portfolio manager at Washington Crossing Advisors in Florham Park, New Jersey. “It confirms to investors that the Fed has their back. They’ll do whatever it takes to keep the U.S. financial system calm.”
Minneapolis Federal Reserve Bank President Neel Kashkari echoed that message in New York Friday morning. He said that the central bank would be operating with a large balance sheet “for the foreseeable future.”
And he was careful to point out that purchases of short-term Treasury bills are different from purchases of long-term bonds.
“QE was designed to also move long rates by us buying long- term assets,” he said. “If the Fed is buying short-term bills just to provide liquidity to the system, there is nothing QE about that.”
So, guys, a lot of stuff to think about. Speaking on China - this is most clear and certain situation among all other factors. We talked about it many times already - US will press China and twist its arms until they will get what they want. US economy and social sphere more stable and has greater margin of safety compares to China, which already shows slowdown of economy and problems with toxic assets on PBoC balance. The progress that we see in US/China relations means one thing - US will get what they want, and EU will be the next who will feel the heavy arm of US tariffs. Here we see clear domination of US.
Now let's turn to Brexit news. The rally on GBP was great and outstanding, but somehow I tend to more balanced and careful attitude. It is a lot of emotions in recent reaction which doesn't match to the content. This is an example when appearances are deceiving. Now only event traders and persons who do not understand the problem of the Brexit could buy GBP.
In 2018 we've explained why this is dead way situation for UK. Here I briefly remind you. The stumbling rock in Brexit UK/EU agreement is the border that will split economical zones of UK and EU. This border could be either between Republic of Ireland and Northern Ireland, or in the Ireland Sea between Ireland island and Great Britain island.
First case, when "hard" border will split Ireland in two parts is unacceptable, because everybody keeps memories of conflicts in 70-80's and carry on Belfast agreement (Good Friday agreement of 1998) which reduce tensions. Besides, here is tricky moment exists, that Conservative cub gets in dependency from N. Ireland unionists. They have just 10 seats, but they in particular provide necessary majority in parlament.
And as we see in recent news - this way was denied as unacceptable. It means that last scenario is possible to split economy space. In this case, the border will be in Ireland Sea - this is a nightmare for all Brits and for Democratic unionists in particular. Because in this case single economic space of Great Britain will be split in two parts.
And now we ask - what particular thing we could celebrate by GBP rally? Nothing was achieved yet. T. May has retired just because neither first way nor second one are acceptable for UK. The fact that B. Johnson excludes the first way is not the reason for optimism yet. Besides, nobody saw any signed Agreements on paper but it is just two weeks till the deadline. Nobody knows what final points will be in this Agreement. It is not necessary to mention here general negative impact when Brexit will happen as for GB as for EU. Problems in UK economy are still stand as well. Thus, we do not see any subject of rejoicing.
Positive rhetoric from EU means that UK accepts concession. Of course, Irish Prime Minister, Leo Varadkar, is happy because UK leaves along his country away from Brexit turmoil and they keep the union of two Ireland.
That's being said, we skeptically look at positive reaction on GBP, have doubts on its durability and do not exclude that it could become good chance to sell GBP.
Drastic change in Fed balance sheet policy tells that Fed adds more dovish measures. At some degree, increasing of a balance works in the same manner as rate cut. In fact, this is the same QE programme. Maybe Fed doesn't want to reverse previous hawkish rate cycle to avoid panic on market but still could add more stimulus using its balance tool. Anyway, other things being equal, this measure makes US dollar weaker.
It will interesting to watch how CFTC positions will change next week. This week we see only EUR net short position increasing, despite good upside performance. On GBP net position stands short without any big changes. But CFTC releases data on Wed, thus, major Friday events are not in this numbers yet:
EUR
Source: cftc.gov
Charting by Investing.com
Technicals
Monthly
In this report we take a look at EUR, but as we try to cover both our major currencies in one report, I mean EUR and GBP - a few words on the latter as well. On GBP we have major weekly K-resistance at 1.2840-1.2880 area. On daily chart we have upside AB=CD with approx. the same OP target. It means that GBP will be interesting on next week or even in two weeks when it will reach major resistance area. Right now, with one white candle pillar on the chart - nothing to discuss. Anyway, sell chances will appear around weekly resistance. Our doubts on buying GBP we've discussed above.
Speaking on EUR - here overall upside action was shyer compares to GBP. We do not see any drastic changes on monthly chart by far October starts with slow pullback. It makes no impact on overall picture, because it is still an inside session.
Technically it could be treated as continuing reaction on Yearly Pivot Support 1. As we've mentioned earlier - market right now stands at crucial area from technical point of view. This is the middle of the range and YPS1. Once EUR will break it - road to the bottom of the range around 1.03 area will be opened.
Overall tendency still stands moderately bearish, as by price action as by MACD trend. In September EUR forms new low, keeping "lower top - lower bottom" sequence.
As we've said earlier, here we could recognize downside narrow channel and market stands accurately inside of it.
Neither big support nor oversold levels stand around and it is free space till 1.03 lows. The only support is YPS1 and middle of the range. That's major technical support here.
Now the major intrigue stands around fundamentals background - it is changing. It is interesting whether its change will be strong enough to make impact on monthly chart and long lasting tendency here.
Weekly
We do not see big impact on weekly chart as well. The upper border of the channel stands around 1.1260 right now and until price stands below it - any action will be just a retracement with no impact on major tendency. The only new thing that could appear soon - is flirting with MACDP line and appearing of the grabber.
Market has to break out from current range to add something new as to monthly as to weekly time frames. As we've said last week, "acceleration" in any direction will have vital impact on the market. Usually when market tests the tension of the bulls, creeping slowly down - it lasts till the first signs of acceleration. Starting to the downside - It will be fatal for EUR and become the harbinger of collapse. Conversely upside acceleration easily could push EUR to the upper border of the channel.
EUR has pretty much room to fluctuate inside the channel. To break the bearish context EUR has to climb above 1.14 top.
Daily
By the end of the week, EUR is completed best-case scenario - OP target has been reached. Market stands near major daily resistance, which includes K-level, daily OB and OP itself. Next XOP target stands at 1.1137, but it is barely interesting on next week.
In fact, here we have "222" sell pattern here, which suggests at least 3/8 retracement.
Intraday
On 4H chart we have another Fib level that agrees with OP target. Also we keep an eye on possible large reverse H&S pattern as well.
In the beginning of the week, we will keep an eye on market reaction on OP target. Potentially EUR could form H&S pattern and reach K-support area around 1.0980 area. In general, this is solid support area, that includes former consolidation, and two pivot lines. Besides, daily "222" pattern also suggests 3/8 retracement.
If no H&S pattern will be formed, we probably are going to major daily resistance and XOP target around 1.11-1.1140
Conclusion:
Fundamental background changes rapidly and it is unclear by far how new Fed initiatives will impact on the market. Fed meeting by the end of the month should provide more clarity on perspective. Still, as currently EUR keeps the upside tendency we follow it.
Disclaimer
This FPA Investment Research is for information and education purposes only. Any decision to make any trade on the market has to be made solely by the reader. Information that is presented in research or its update is not an offer or call to make the trade on the financial markets and expresses just a personal opinion of the author who is might be wrong. Reader has to make decision on any trade solely and care all responsibility for results of this trade.
The technical portion of Sive's analysis owes a great deal to Joe DiNapoli's methods, and uses a number of Joe's proprietary indicators. Please note that Sive's analysis is his own view of the market and is not endorsed by Joe DiNapoli or any related companies.