FOREX PRO Weekly October 29- November 03, 2012

Hi Sive

Thanks for your expert analysis.The MACD Predictor that you use on your MT4 charts,is it available to download somewhere.Could not find it on the forum.

Thanks alot
Regards

Maybe this will help you out a bit.

Hi,
I would like to have the In Chart MACD indicator which helps me to watch bullish/bearish stop grabbers like in your daily videos, If you cannot post it here can you let me know where to find it and what to search for on the internet,

Thanks in advance
Hi Blueraven,
its distribution is forbidden by copyright law. You can use software (that is not free) that has it - for example CQG or Genesis Trade Navigator, or program it by yourself, as I did.
 
Hey Sive,

Just confused about something.

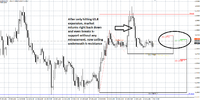
Recall how you have said many times before that "if market breaks k-support or resistance without any retracement, it usually means it is good idea to scale in".

Look at my hourly chart below. After JUST hitting 61.8% expansion, market comes back down and breaks k-support EASILY! Won't this mean that we have good possibility of bears since market breaks k-support like nothing and right now coiling underneath it? Won't having a short below k-resistance and having a stop above it a good idea?

Looking forward to your input.

All the best,
Brandon

EDIT: Sorry. Also forgot to mention that WPP, MPP and K-resistance are all in the same area so won't that be an even greater resistance?

kres.png
 
Hi all FPA members hope you enjoying your life :). I'm new in forex trading and keep lossing since June :( Can anyone tell me how to use Master Sive's Market analysis charts???
 
waleed, if you need help understanding the charts, then i'd suggest that your first step should first be to study the complete forex course, here: Forex Military School | Complete Forex Education by a Pro Banker - Forex Peace Army Forum

and whenever you come across stuff that does not make sense to you, then post specific questions here and am sure someone will try to give you an answer.

no matter what, never forget that it is fundamentally easy, on a conceptual level, that is--practice is another matter entirely. even if it doesn't seem so at the moment, keep telling yourself it is not rocket science and you can grasp all the fundamental ideas. if you read the 'market wizards' series of interviews with legendary traders you'll see what i mean.

good luck.

Hi all FPA members hope you enjoying your life :). I'm new in forex trading and keep lossing since June :( Can anyone tell me how to use Master Sive's Market analysis charts???
 
Hi all FPA members hope you enjoying your life :). I'm new in forex trading and keep lossing since June :( Can anyone tell me how to use Master Sive's Market analysis charts???

Hi hwaleed,

I just try to give you a brief intro about this forum. Maybe Sive will add some more. First, Sive's analysis is majorly based on Dinapoli trading technique. Pls buy a book with the title Trading With Dinapoli Levels. Second, Sive also take into account on harmonic pattern analysis, candelstick pattern etc. Lastly (but for me is very important) is Sive always talk about price behaviour regards to any subject that is discussed during his weekly analysis as well as daily update i.e. Dinapoli patterns, harmonic patterns, candlestick pattern, pivot level etc.
To summarize it, you need to read some books or just visit Forex Military School in this website under Educations and Forums chapter.

Thanks and Best Regards,
Rashidin Rashid
 
Just some thoughts.

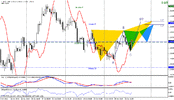
MADC Predictor line on daily timeframe will hold bearish trend on this exact area of butterfiles completion, around 1.3045 - 1.3060. It's also the target of 100% AB=CD, WPR1 and very close to 61.8% fibo resistance of whole down move. What do you think Sive?

eurusd-h4-01-nov-2012.gif
 
Sive, am I mistaken or am I seeing a near perfect Head & Shoulders formation on the H1 chart for Nov. 1, 2012?

Thanks!
Hi Tarry,
may be we can apply such term here, although right shoulder looks ugly. Partially we've discussed in in yesterday's video, when said that market has stopped right at 1.618 extension of potential left shoulder.

Hey Sive,

Just confused about something.

Recall how you have said many times before that "if market breaks k-support or resistance without any retracement, it usually means it is good idea to scale in".

Look at my hourly chart below. After JUST hitting 61.8% expansion, market comes back down and breaks k-support EASILY! Won't this mean that we have good possibility of bears since market breaks k-support like nothing and right now coiling underneath it? Won't having a short below k-resistance and having a stop above it a good idea?

Looking forward to your input.

All the best,
Brandon

EDIT: Sorry. Also forgot to mention that WPP, MPP and K-resistance are all in the same area so won't that be an even greater resistance?
Hi Brandon,
very good insight. My comment a bit late you can see, that it has happened a bit later, I mean what you've spoken about. Market has retested this level, by splash on 4-hour chart. Well done.

And you're absolutely right about bearish power, when market moves through K area after just 0.618 extension target as it no exists.


Just some thoughts.

MADC Predictor line on daily timeframe will hold bearish trend on this exact area of butterfiles completion, around 1.3045 - 1.3060. It's also the target of 100% AB=CD, WPR1 and very close to 61.8% fibo resistance of whole down move. What do you think Sive?

Hi Kwash,
yes, yesterday I also have thought about it, that it just could be greater upward AB=CD, but currently market has placed all dots on "i".
 
Hi everybody!
I know Sive dont believe in astrology stuff but I saw some fragment of a presentation of Gann's work I think (the real thing was really expensive). The correlation between astrology and price movement was really scary. I mean, there was scary movement right on time with planet alignment. There was a plunge that lasted for years. All other yearly movements were also very much correlated. So, I am thinking about GOLD brothers, GOLD...
 
Hi Brandon,
very good insight. My comment a bit late you can see, that it has happened a bit later, I mean what you've spoken about. Market has retested this level, by splash on 4-hour chart. Well done.

And you're absolutely right about bearish power, when market moves through K area after just 0.618 extension target as it no exists.

Thanks, Sive. I owe it all to you and your teachings.

Hope you and your family have a great weekend!

Cheers!
 
Back
Top