Sive Morten
Special Consultant to the FPA
- Messages
- 18,673
Monthly
The dollar rose on Friday, with traders looking beyond soft U.S. consumer-spending data, while the steadily sliding euro won a reprieve on diminished expectations the European Central Bank will soon ease monetary policy. The report, which economists had expected to show a rise of 0.2 percent, prompted speculation among traders readying for a three-day holiday break in the United States that U.S. gross domestic product may grow less during the third quarter than currently forecast. But traders still see promise in the U.S. economy despite the disappointing data about spending that accounts for 70 percent of GDP, according to Boris Schlossberg, managing director at BK Asset Management in New York. "The market does not think it is a straw that breaks the camel's back," Schlossberg said. "The market thinks the consumer will catch up." The euro was on track for a second straight month of losses as euro zone annual inflation has slowed to a five-year low of 0.3 percent, well below the ECB's "danger zone" of 1.0 percent. The euro zone currency has shed 3.6 percent against the dollar in the past three months, partly due to the conflict in Ukraine, which is likely to weigh on growth in the bloc. Euro weakness against the dollar will persist for years and will lead to price parity between the euro and the greenback, a new report by Goldman Sachs said.
"We are revising down our (euro/dollar) forecast to 1.29, 1.25 and 1.20 in three, six and 12 months (from 1.35, 1.34 and 1.30 previously)," the analysts wrote. "We are also revising our longer-term forecasts lower, bringing the end-2015 number down to 1.15 (from 1.27), that for end-2016 to 1.05 (from 1.23) and that for end-2017 to 1.00 (from 1.20)."
As euro continues to move down, it is interesting what has happened with CFTC data. Brief look points on increase in all data – Open interest, Longs and shorts:
Open interest:

Longs:

Shorts:

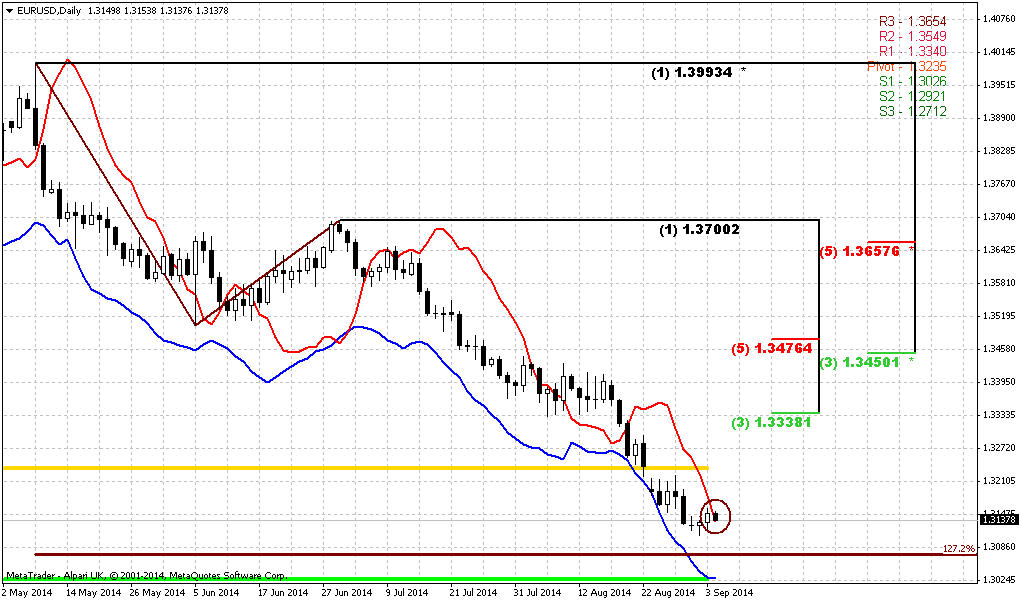
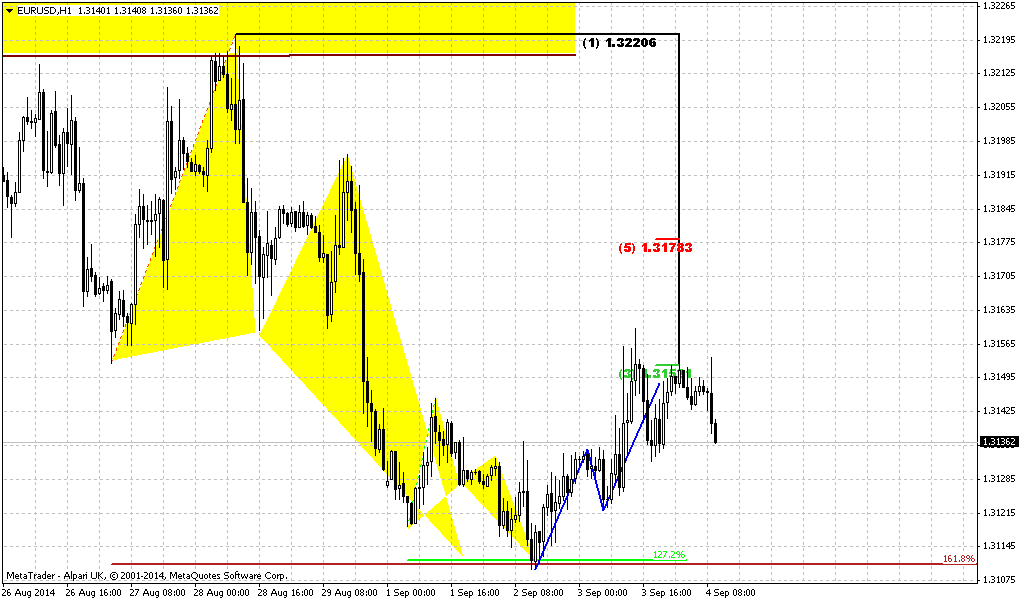
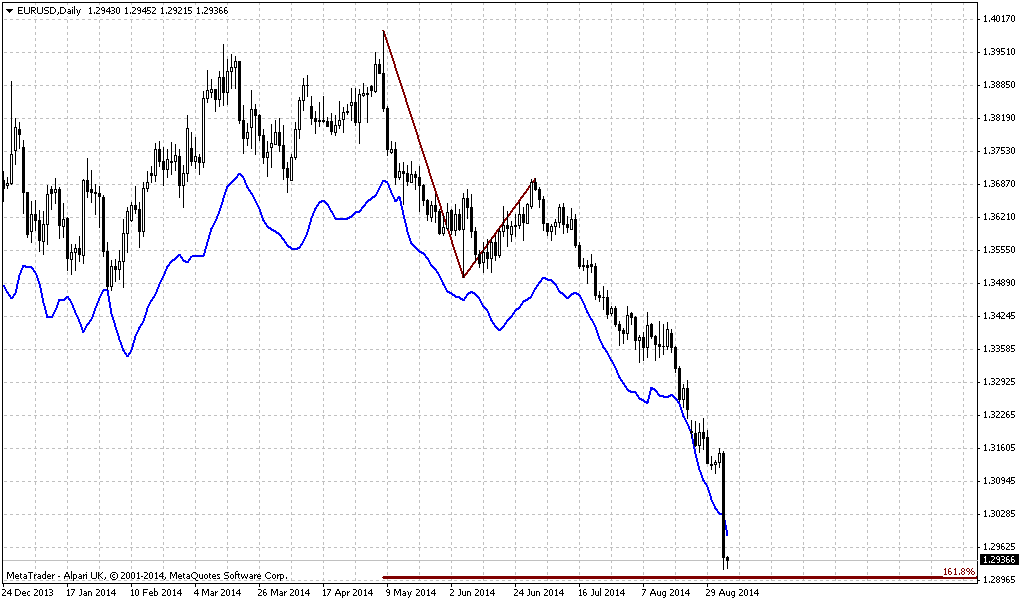
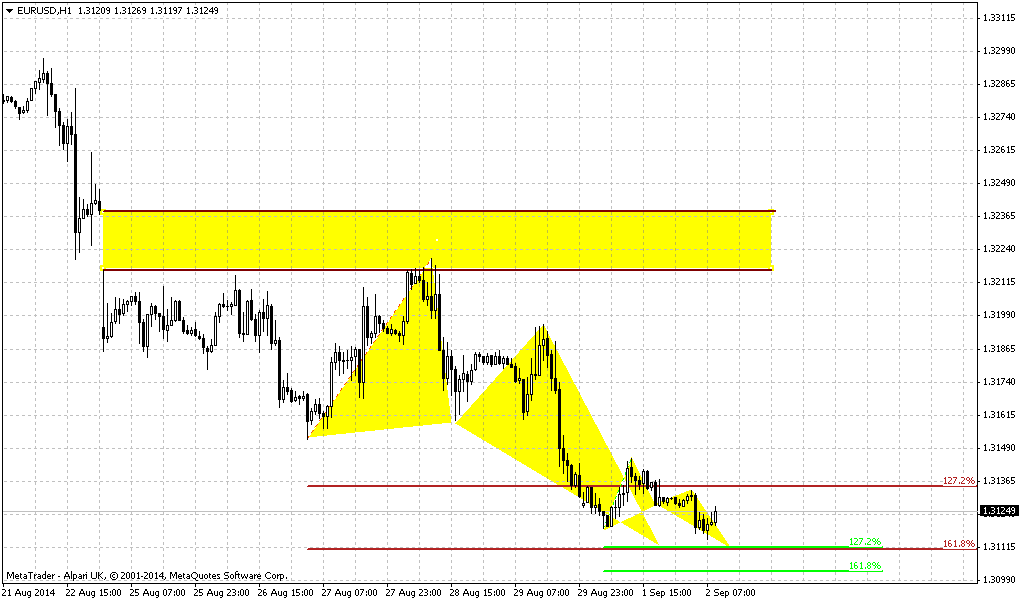
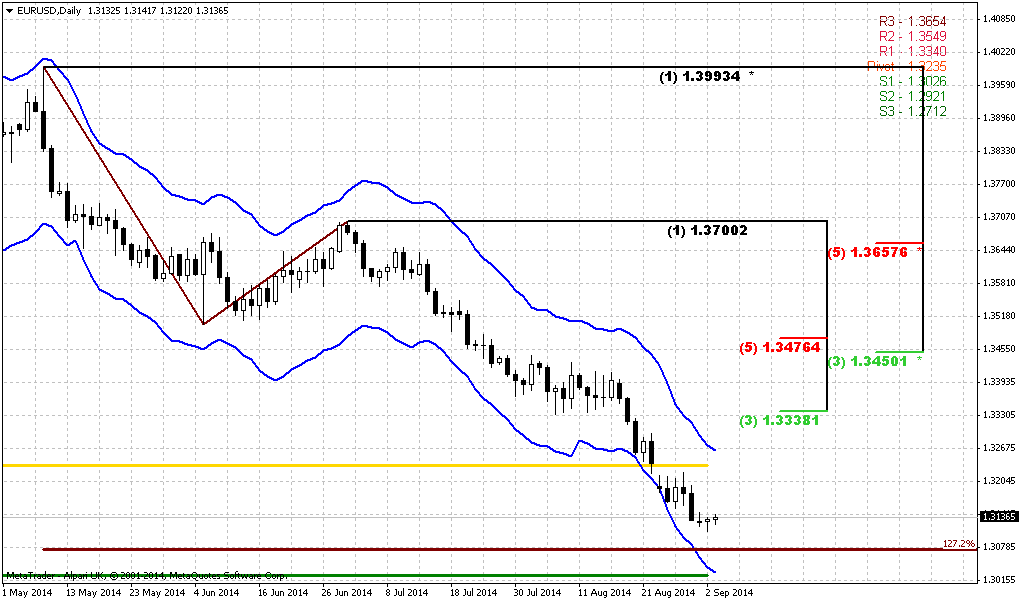
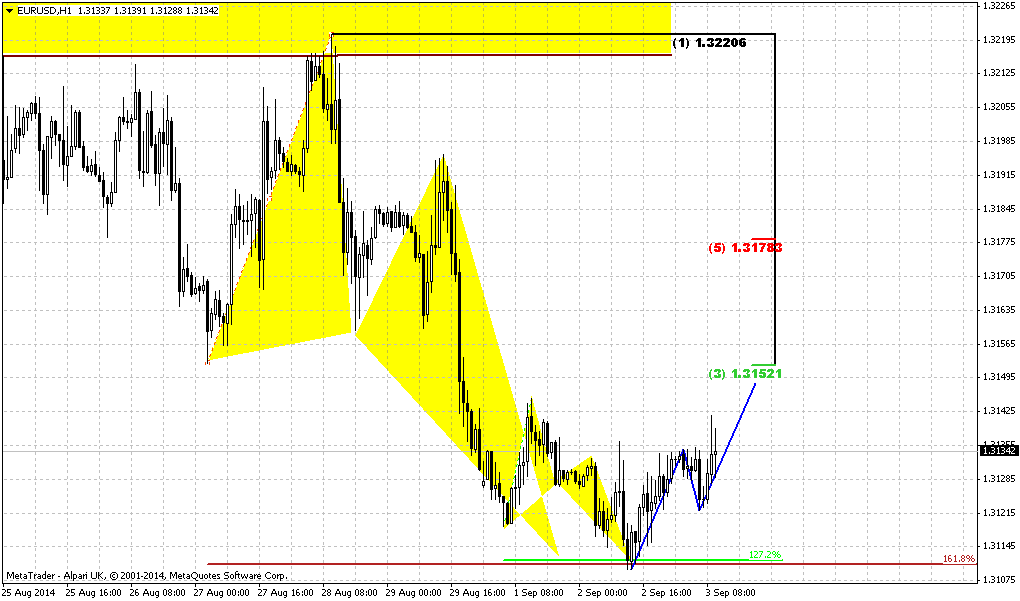
Currently our ratio of short positions has increased to 208876/(208876+55226)=79,00%. Data shows increasing of shorts ~for 10 000 contracts and decreasng of long position. Simultaneously we see that open interest also is growing. This confirms strength of bearish trend on EUR. At the same time CFTC ratio has not reached yet crucial ~82% level when probability of reversal or at least retracement increases significantly. In turn, this means that market still has some room and possibility to reach our medium-term target around Yearly Pivot Point. When ratio approaches 80-82% this becomes significant, because it means that almost all speculators stand short and nobody can sell more to support trend down.
In long term perspective our suggestion that EUR will stay under pressure for long time. Initially we’ve made this suggestion in November 2011. Do you remember this quarterly chart of US Dollar Index? This analysis still suggests further USD growth.
Currently first driving factor is US economy improvement. Macroeconomy suggests that when economy comes out from recession into growth – the first stage is “desinflation growth”. Economy shows improvement without jump in inflation. May be right now we are entering in this stage, at least most analysts point on obvious improvements in US economy and there are no doubts about it.
Combining these two moments makes me think that probably this is really first stage. Second stage will be “inflationary growth” – this is a period when Fed’s rate dancing will start. Probably we will see first bell of this when wages in US will start to grow that we do not see yet.
Since we have at least 8-12 months when rate will not change. It means that although USD will keep moderately bullish sentiment and will dominate over EUR, but this domination will not be absolute and fast.
At the same time, it seems that EUR will remain under pressure as Draghi confirms this, and we see some reasons for this as well. Even before Ukranian crisis EU has its own problems that press ECB keeps rate low and even apply clearly dovish rethoric. As EU has intiated sunctions against Russia this will hurt trade balance and negatively impact on EU. At the same time this is just small part of goods that Russia could forbid potentially and recent data on GDP of Germany, France, Italy shows slightly worse that expected numbers. Other words, mutual sanctions do not assume improvement in economy.
Reducing of export for EU countries will mean also unemployment growth, reducing of trade balance, GDP and budget income. In current situation this is not good, especially for new members of EU that are more sensible to economic negative situations and that were hurted stronger in 2008. At the same time EU still has its own problems, such as desinflation in major economies.
All these facts make us think that EUR/USD will continue move south with moderate pace during the 8-12 months and even could accelearted when real menace of US rate hiking will appear if any positive shifts in EU economy will not come. Depending on how external political atmospehre will change – we will gradually adjust our view.
Technical
Recently guys, there were a lot of concern and questions about JPY and today we will take a look at this pair. Market right now already have some important patterns on higher time frames but also stands at the eve of creation patterns on daily and lower charts.
In general situation on monthly and weekly chart develops according with our long-term analysis, that we prepared first in the beginning of the year.
Let’s take a look at wide JPY chart first. Here is some very tricky moment hidden and if you careful enough you could find him. First of all, we see that 101.50 area is long-term natural support/resistance line. Sometimes market has pierced it significantly but this line holds. Now we also see that on previous touch market has pierced it as well, but has not broken it. Now price stands slightly higher than the line that I’ve drawn, but still lower than previous high. It means that market has not passed through this resistance yet, although at first glance it seems the opposite is true. Now I would ask you – what do you expect to happen when you have natural resistance line and slightly higher solid Fib resistance level? Will chances on true breakout of resistance be greater or smaller? Market could loss a lot of momentum on struggle against natural level and then it will meet Fib resistance. This situation starts to smell as possible W&R or even failure breakout. That’s why it’s very interesting. Anything could happen of cause, but if price will swamp and form some reversal pattern in 101.50-105.5 area this could trigger solid retracement down. That is our primary object to monitor – identifying and catching reversal pattern in this area.
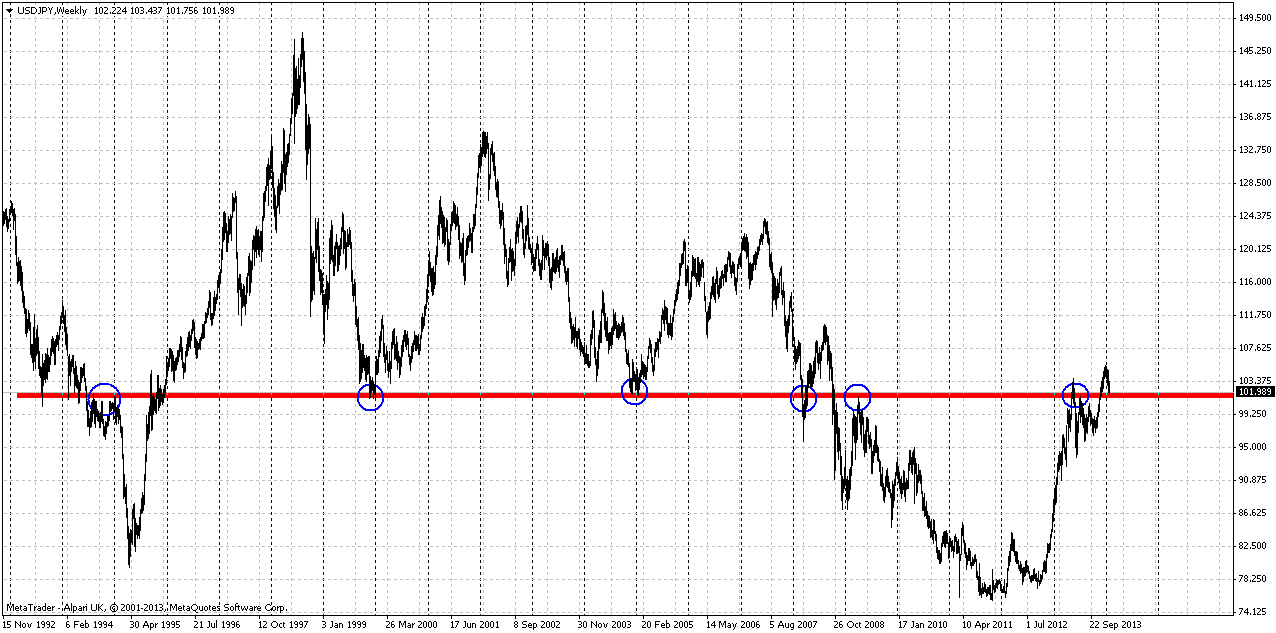
Initially (on March 9th 2014) we noted that despite appearing of bearish engulfing pattern we see two possible risk factors here. First is that market has not quite reached Fib resistance, approximately for 30 pips. Second is now market has reached this 101.50 long-term level from upside and this could be just re-testing of broken level. Other words risk stands in possibility of upward continuation after re-testing of broken area.
On second monthly chart you can see modern picture of JPY.
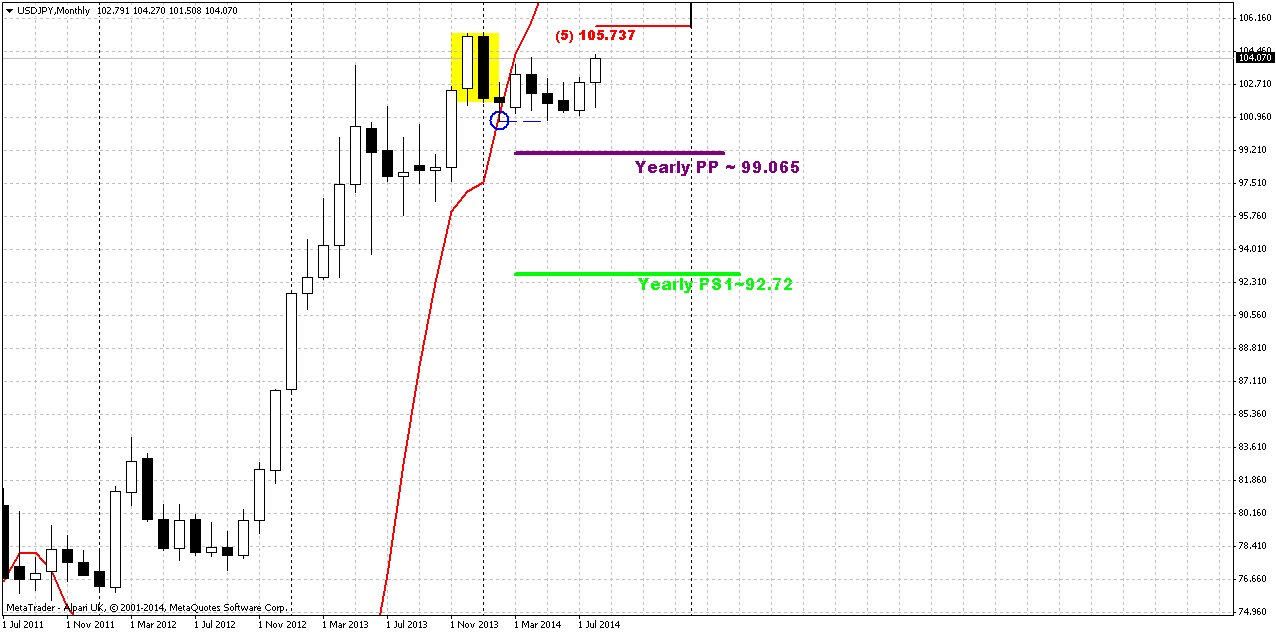
Situation here is very interesting. Take a look at blue circle. This is bullish stop grabber that has been formed in February! But its low has not been taken out and this grabber is still valid. Monthly grabbers are very important since they set clarity for solid actions. Thus, our exemplar suggests taking out of 105.40 top and final reaching of Fib resistance level. Later on lower time frames we will estimate precise level of upward potential that will be based on definite pattern.
Although Yen has not tested YPP yet - it still can do this later, since we have 4 months till the end of the year. And this possible return down agrees with our trading plan. Recall that we expect downturn, but from slightly higher levels. Reasons for this could be different – pattern completion point, resistance etc. Not necessary this will be drastical reversal, but some retracement will be possible and very probable that Yen finally will touch YPP.
So, let’s investigate what we have on lower time frames and try to gather single picture.
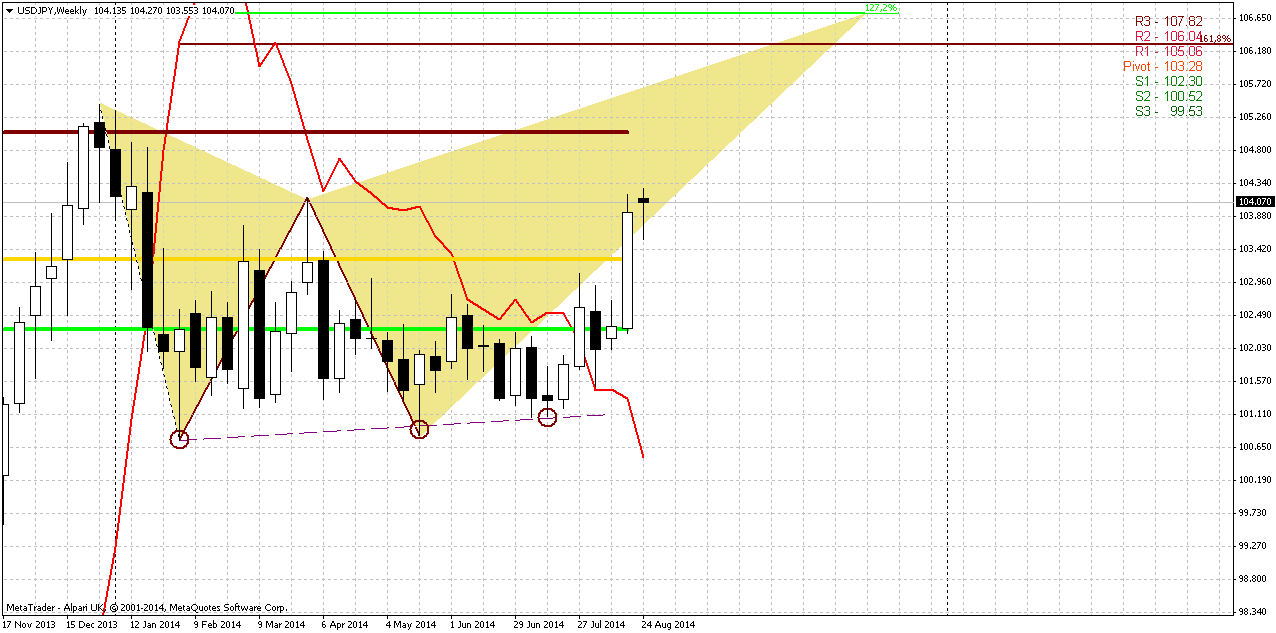
Weekly
Second important issue stands on weekly chart. As market has stand flat for long period and formed higher lows while trend was bearish – this was a sign of hidden bullish dynamic pressure. Now it comes on surface – trend has turned bullish and market successfully moves up. Still, target of pressure setup is former top at the same 105.40 area.
Next imprortant issue is monthly pivots. On the chart you can see “new” september pivots, while, if you will take a look at august ones you’ll see that Yen has closed above MPR1. This has happened may be first time since the beginning of the year and gives additional confirmation of existing bullish trend.
Finally, pattern that is forming here can help us estimate upside potential with more precision. Thus, butterfly points on 106,50 area, while inner 1.618 AB=CD points on 106.20 area. But for weekly chart this difference insignificant. Appearing of butterfly itself is also imporant for our suggestion about possible downward reversal at 106.50 area, because the nature of butterfly is reversal. Hence it is not just points on target but also hints on nature of this action.
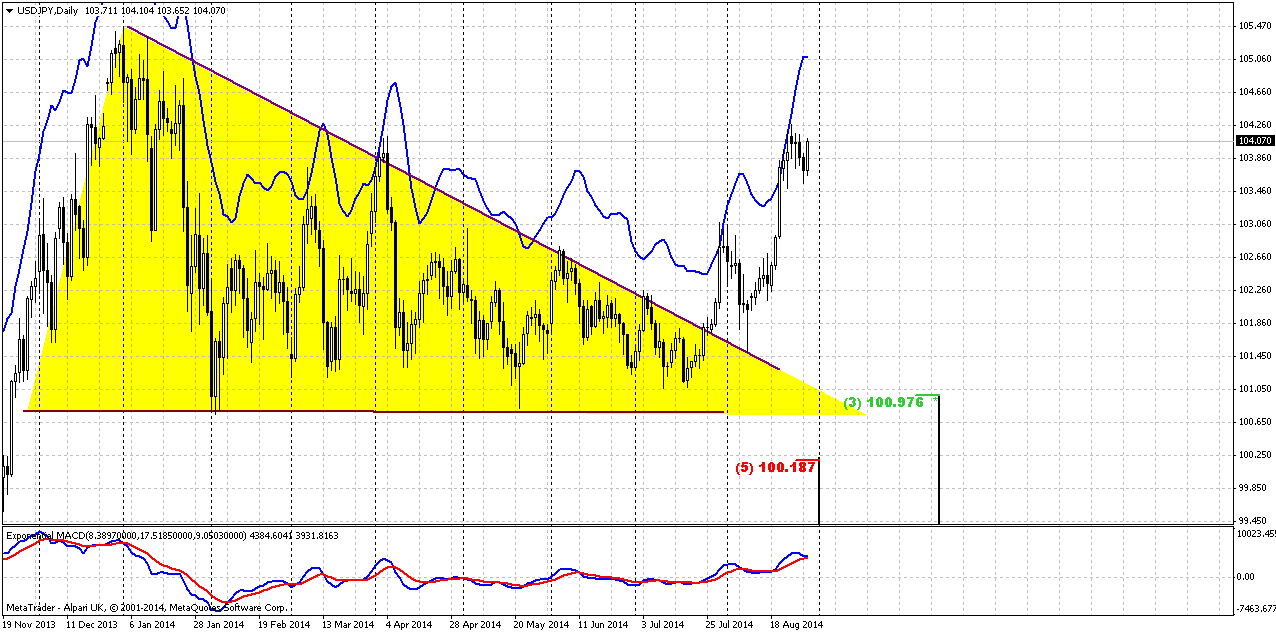
Daily
Daily chart is mostly indicative. On last time when we’ve taken a look at it (11th of August) we’ve made an assumption that if triangle breakout is true – market could re-test its border but should continue move up after that. And that is what we see here. Trend is bullish here. Market has paused upward action two times due reaching overbought level. Take a look that current upward action has solid foundation – weekly K-support area at 100-101 level. Let’s take a look at intraday charts to estimate what expect in nearest future.
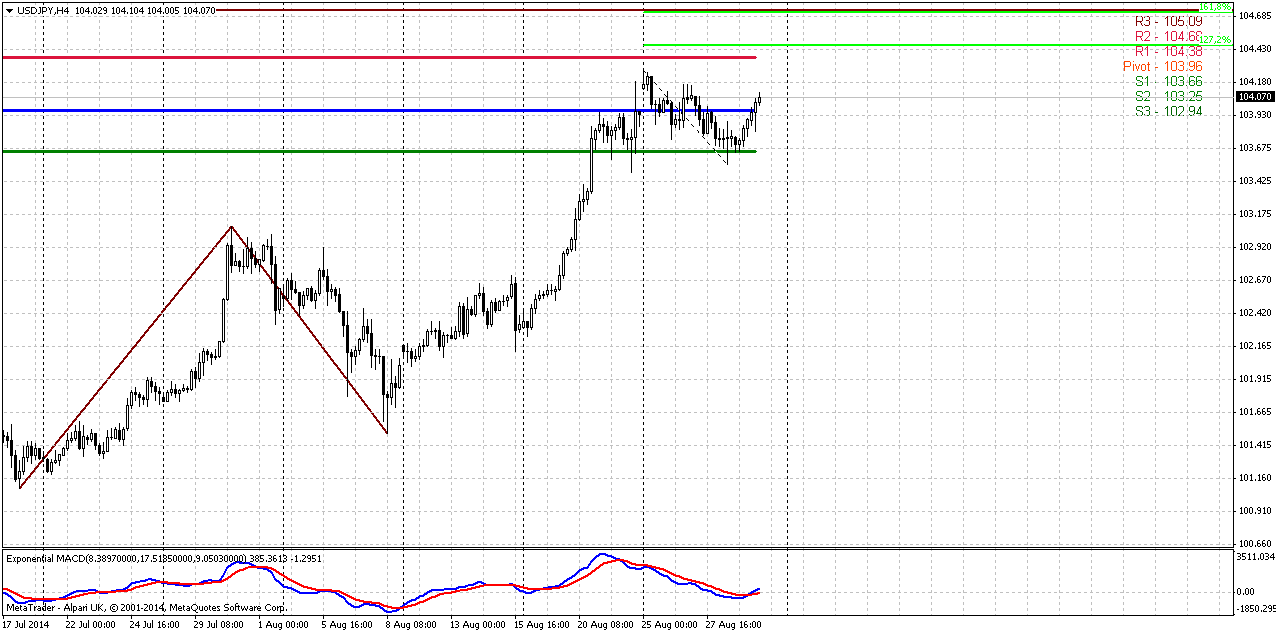
4-hour
Take a look at daily chart again (above) and pay attention to fast white candle before current retracement. This is bullish sign. On 4-hour chart market has accelerated above 100% AB=CD target without any retracement, looks like right to 1.27. When price shows such sort of action we can state with high odd that price probably will continue to 1.618 extension ratio ~104.65 area. Interesting that 1.618 extension of recent retracement also stands in the same area. Thus, we dare to suggest that on coming week market will try to continue move higher and could start retracement after it will reach 104.65 area. May be market will form butterfly. This would be logical here.
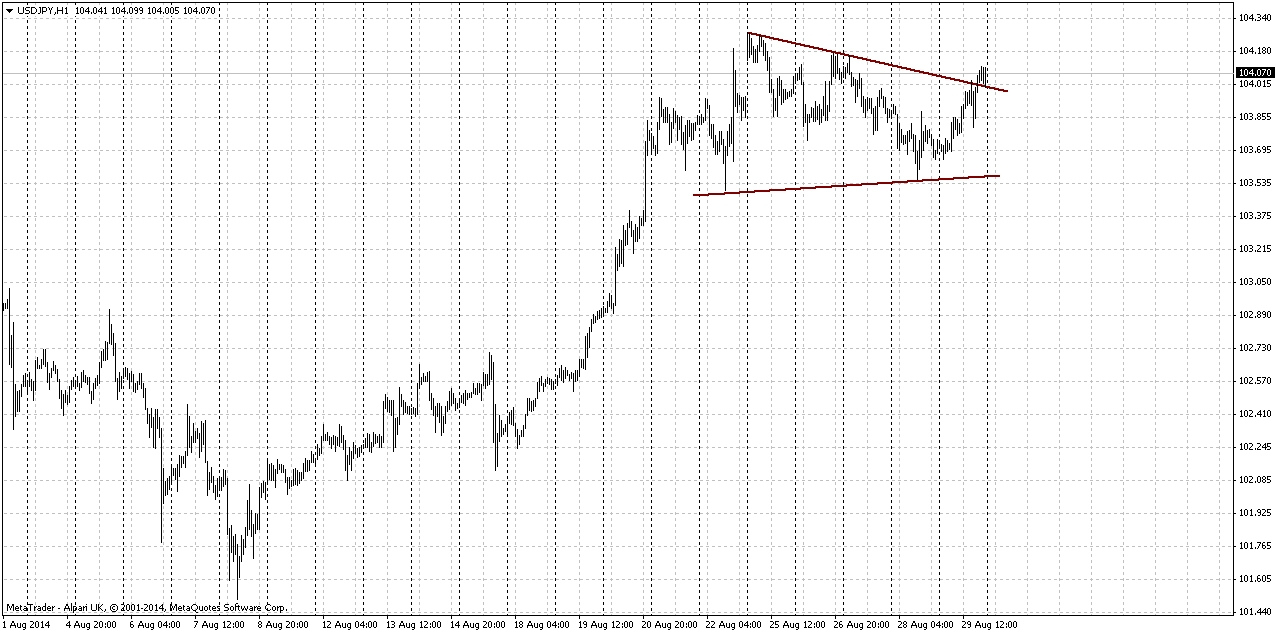
1-hour
On hourly chart we also can see some kind of continuation triangle that does not exclude possible upward action. Trend here is bullish as well. Inside triangle you probably even can recognize “222” Buy pattern. Triangle has been broken and re-tested already on Friday.
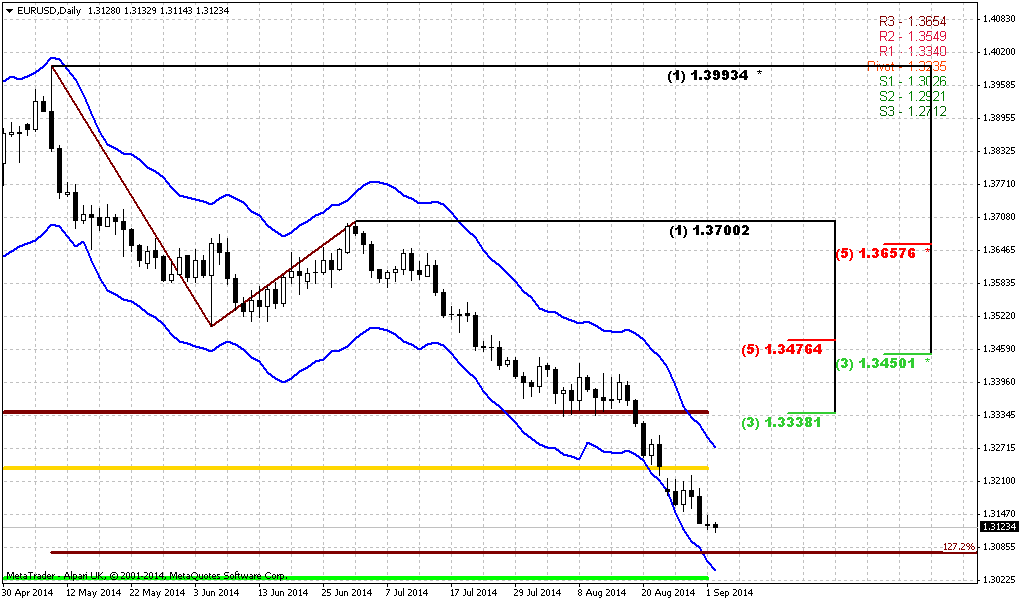
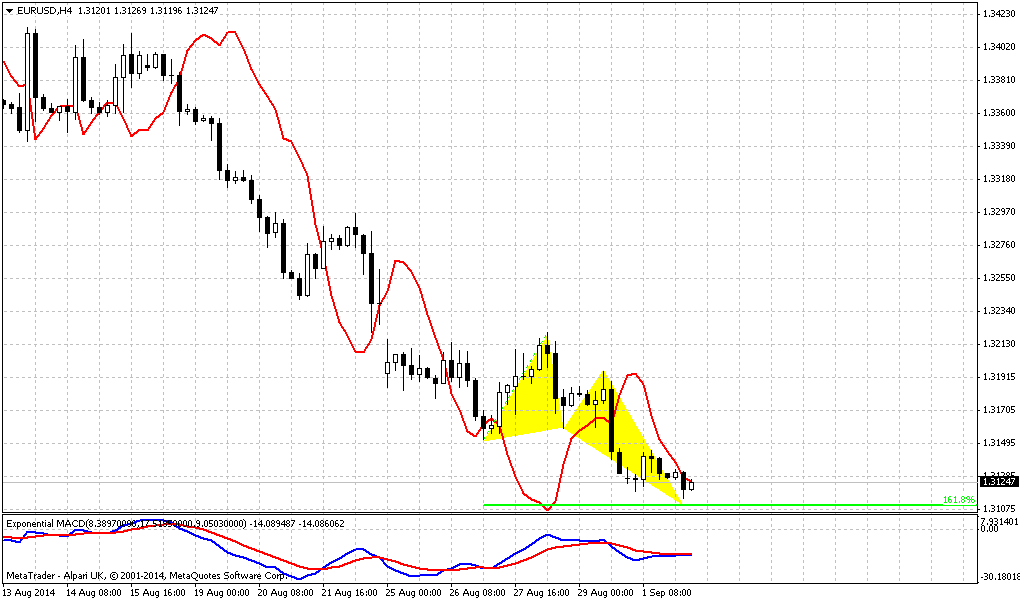
Conclusion:
Our medium term analysis does not contradict to EUR outlook, since due recent downward action market probably will continue action to 1.3060 Yearly Pivot Support 1. Thus, on JPY we also suggest upward continuation to ~106.50 area. This analysis is confirmed by multiple patterns that were formed earlier but still stand in progress and valid.
After creating of bullish grabber market makes more and more visible presence of bullish dynamic pressure on weekly chart. On lower time frames breakout of long-term triangle supports this analysis.
In shorter-term perspective we will be watching on upward continuation to 104.65 first and then on possible retracement.
The technical portion of Sive's analysis owes a great deal to Joe DiNapoli's methods, and uses a number of Joe's proprietary indicators. Please note that Sive's analysis is his own view of the market and is not endorsed by Joe DiNapoli or any related companies.
The dollar rose on Friday, with traders looking beyond soft U.S. consumer-spending data, while the steadily sliding euro won a reprieve on diminished expectations the European Central Bank will soon ease monetary policy. The report, which economists had expected to show a rise of 0.2 percent, prompted speculation among traders readying for a three-day holiday break in the United States that U.S. gross domestic product may grow less during the third quarter than currently forecast. But traders still see promise in the U.S. economy despite the disappointing data about spending that accounts for 70 percent of GDP, according to Boris Schlossberg, managing director at BK Asset Management in New York. "The market does not think it is a straw that breaks the camel's back," Schlossberg said. "The market thinks the consumer will catch up." The euro was on track for a second straight month of losses as euro zone annual inflation has slowed to a five-year low of 0.3 percent, well below the ECB's "danger zone" of 1.0 percent. The euro zone currency has shed 3.6 percent against the dollar in the past three months, partly due to the conflict in Ukraine, which is likely to weigh on growth in the bloc. Euro weakness against the dollar will persist for years and will lead to price parity between the euro and the greenback, a new report by Goldman Sachs said.
"We are revising down our (euro/dollar) forecast to 1.29, 1.25 and 1.20 in three, six and 12 months (from 1.35, 1.34 and 1.30 previously)," the analysts wrote. "We are also revising our longer-term forecasts lower, bringing the end-2015 number down to 1.15 (from 1.27), that for end-2016 to 1.05 (from 1.23) and that for end-2017 to 1.00 (from 1.20)."
As euro continues to move down, it is interesting what has happened with CFTC data. Brief look points on increase in all data – Open interest, Longs and shorts:
Open interest:
Longs:
Shorts:
Currently our ratio of short positions has increased to 208876/(208876+55226)=79,00%. Data shows increasing of shorts ~for 10 000 contracts and decreasng of long position. Simultaneously we see that open interest also is growing. This confirms strength of bearish trend on EUR. At the same time CFTC ratio has not reached yet crucial ~82% level when probability of reversal or at least retracement increases significantly. In turn, this means that market still has some room and possibility to reach our medium-term target around Yearly Pivot Point. When ratio approaches 80-82% this becomes significant, because it means that almost all speculators stand short and nobody can sell more to support trend down.
In long term perspective our suggestion that EUR will stay under pressure for long time. Initially we’ve made this suggestion in November 2011. Do you remember this quarterly chart of US Dollar Index? This analysis still suggests further USD growth.
Currently first driving factor is US economy improvement. Macroeconomy suggests that when economy comes out from recession into growth – the first stage is “desinflation growth”. Economy shows improvement without jump in inflation. May be right now we are entering in this stage, at least most analysts point on obvious improvements in US economy and there are no doubts about it.
Combining these two moments makes me think that probably this is really first stage. Second stage will be “inflationary growth” – this is a period when Fed’s rate dancing will start. Probably we will see first bell of this when wages in US will start to grow that we do not see yet.
Since we have at least 8-12 months when rate will not change. It means that although USD will keep moderately bullish sentiment and will dominate over EUR, but this domination will not be absolute and fast.
At the same time, it seems that EUR will remain under pressure as Draghi confirms this, and we see some reasons for this as well. Even before Ukranian crisis EU has its own problems that press ECB keeps rate low and even apply clearly dovish rethoric. As EU has intiated sunctions against Russia this will hurt trade balance and negatively impact on EU. At the same time this is just small part of goods that Russia could forbid potentially and recent data on GDP of Germany, France, Italy shows slightly worse that expected numbers. Other words, mutual sanctions do not assume improvement in economy.
Reducing of export for EU countries will mean also unemployment growth, reducing of trade balance, GDP and budget income. In current situation this is not good, especially for new members of EU that are more sensible to economic negative situations and that were hurted stronger in 2008. At the same time EU still has its own problems, such as desinflation in major economies.
All these facts make us think that EUR/USD will continue move south with moderate pace during the 8-12 months and even could accelearted when real menace of US rate hiking will appear if any positive shifts in EU economy will not come. Depending on how external political atmospehre will change – we will gradually adjust our view.
Technical
Recently guys, there were a lot of concern and questions about JPY and today we will take a look at this pair. Market right now already have some important patterns on higher time frames but also stands at the eve of creation patterns on daily and lower charts.
In general situation on monthly and weekly chart develops according with our long-term analysis, that we prepared first in the beginning of the year.
Let’s take a look at wide JPY chart first. Here is some very tricky moment hidden and if you careful enough you could find him. First of all, we see that 101.50 area is long-term natural support/resistance line. Sometimes market has pierced it significantly but this line holds. Now we also see that on previous touch market has pierced it as well, but has not broken it. Now price stands slightly higher than the line that I’ve drawn, but still lower than previous high. It means that market has not passed through this resistance yet, although at first glance it seems the opposite is true. Now I would ask you – what do you expect to happen when you have natural resistance line and slightly higher solid Fib resistance level? Will chances on true breakout of resistance be greater or smaller? Market could loss a lot of momentum on struggle against natural level and then it will meet Fib resistance. This situation starts to smell as possible W&R or even failure breakout. That’s why it’s very interesting. Anything could happen of cause, but if price will swamp and form some reversal pattern in 101.50-105.5 area this could trigger solid retracement down. That is our primary object to monitor – identifying and catching reversal pattern in this area.
Initially (on March 9th 2014) we noted that despite appearing of bearish engulfing pattern we see two possible risk factors here. First is that market has not quite reached Fib resistance, approximately for 30 pips. Second is now market has reached this 101.50 long-term level from upside and this could be just re-testing of broken level. Other words risk stands in possibility of upward continuation after re-testing of broken area.
On second monthly chart you can see modern picture of JPY.
Situation here is very interesting. Take a look at blue circle. This is bullish stop grabber that has been formed in February! But its low has not been taken out and this grabber is still valid. Monthly grabbers are very important since they set clarity for solid actions. Thus, our exemplar suggests taking out of 105.40 top and final reaching of Fib resistance level. Later on lower time frames we will estimate precise level of upward potential that will be based on definite pattern.
Although Yen has not tested YPP yet - it still can do this later, since we have 4 months till the end of the year. And this possible return down agrees with our trading plan. Recall that we expect downturn, but from slightly higher levels. Reasons for this could be different – pattern completion point, resistance etc. Not necessary this will be drastical reversal, but some retracement will be possible and very probable that Yen finally will touch YPP.
So, let’s investigate what we have on lower time frames and try to gather single picture.
Weekly
Second important issue stands on weekly chart. As market has stand flat for long period and formed higher lows while trend was bearish – this was a sign of hidden bullish dynamic pressure. Now it comes on surface – trend has turned bullish and market successfully moves up. Still, target of pressure setup is former top at the same 105.40 area.
Next imprortant issue is monthly pivots. On the chart you can see “new” september pivots, while, if you will take a look at august ones you’ll see that Yen has closed above MPR1. This has happened may be first time since the beginning of the year and gives additional confirmation of existing bullish trend.
Finally, pattern that is forming here can help us estimate upside potential with more precision. Thus, butterfly points on 106,50 area, while inner 1.618 AB=CD points on 106.20 area. But for weekly chart this difference insignificant. Appearing of butterfly itself is also imporant for our suggestion about possible downward reversal at 106.50 area, because the nature of butterfly is reversal. Hence it is not just points on target but also hints on nature of this action.
Daily
Daily chart is mostly indicative. On last time when we’ve taken a look at it (11th of August) we’ve made an assumption that if triangle breakout is true – market could re-test its border but should continue move up after that. And that is what we see here. Trend is bullish here. Market has paused upward action two times due reaching overbought level. Take a look that current upward action has solid foundation – weekly K-support area at 100-101 level. Let’s take a look at intraday charts to estimate what expect in nearest future.
4-hour
Take a look at daily chart again (above) and pay attention to fast white candle before current retracement. This is bullish sign. On 4-hour chart market has accelerated above 100% AB=CD target without any retracement, looks like right to 1.27. When price shows such sort of action we can state with high odd that price probably will continue to 1.618 extension ratio ~104.65 area. Interesting that 1.618 extension of recent retracement also stands in the same area. Thus, we dare to suggest that on coming week market will try to continue move higher and could start retracement after it will reach 104.65 area. May be market will form butterfly. This would be logical here.
1-hour
On hourly chart we also can see some kind of continuation triangle that does not exclude possible upward action. Trend here is bullish as well. Inside triangle you probably even can recognize “222” Buy pattern. Triangle has been broken and re-tested already on Friday.
Conclusion:
Our medium term analysis does not contradict to EUR outlook, since due recent downward action market probably will continue action to 1.3060 Yearly Pivot Support 1. Thus, on JPY we also suggest upward continuation to ~106.50 area. This analysis is confirmed by multiple patterns that were formed earlier but still stand in progress and valid.
After creating of bullish grabber market makes more and more visible presence of bullish dynamic pressure on weekly chart. On lower time frames breakout of long-term triangle supports this analysis.
In shorter-term perspective we will be watching on upward continuation to 104.65 first and then on possible retracement.
The technical portion of Sive's analysis owes a great deal to Joe DiNapoli's methods, and uses a number of Joe's proprietary indicators. Please note that Sive's analysis is his own view of the market and is not endorsed by Joe DiNapoli or any related companies.
") ). On daily chart we also could get grabber pattern...
). On daily chart we also could get grabber pattern...