Sive Morten
Special Consultant to the FPA
- Messages
- 18,695
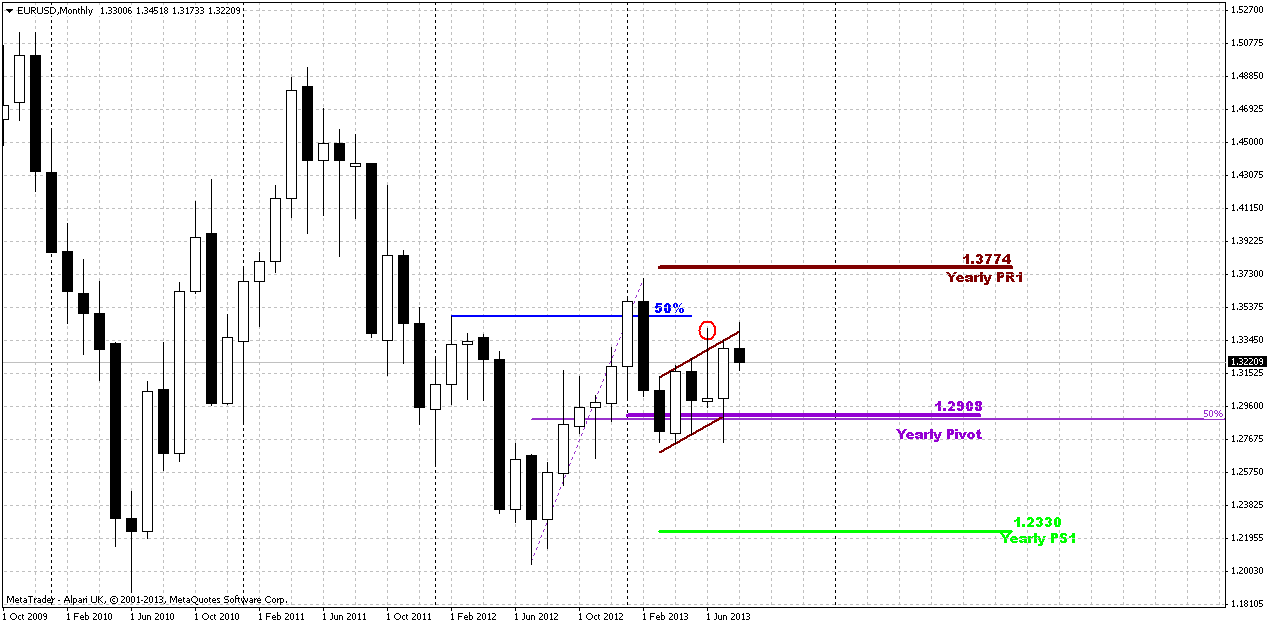
Monthly
On passed week market has continued gradual move down and as August candle has closed – it took the shape of failure upward breakout again and W&R of previous highs. With uncertainty around Syria it is difficult to suggest what will happen, but by taking a look at previous action we could make a conclusion that market should return right back to 1.29 area again. At least when market has failed to pass through upper border of current consolidation it has turned in opposite direction and reached other border of consolidation. May be this will happen again.
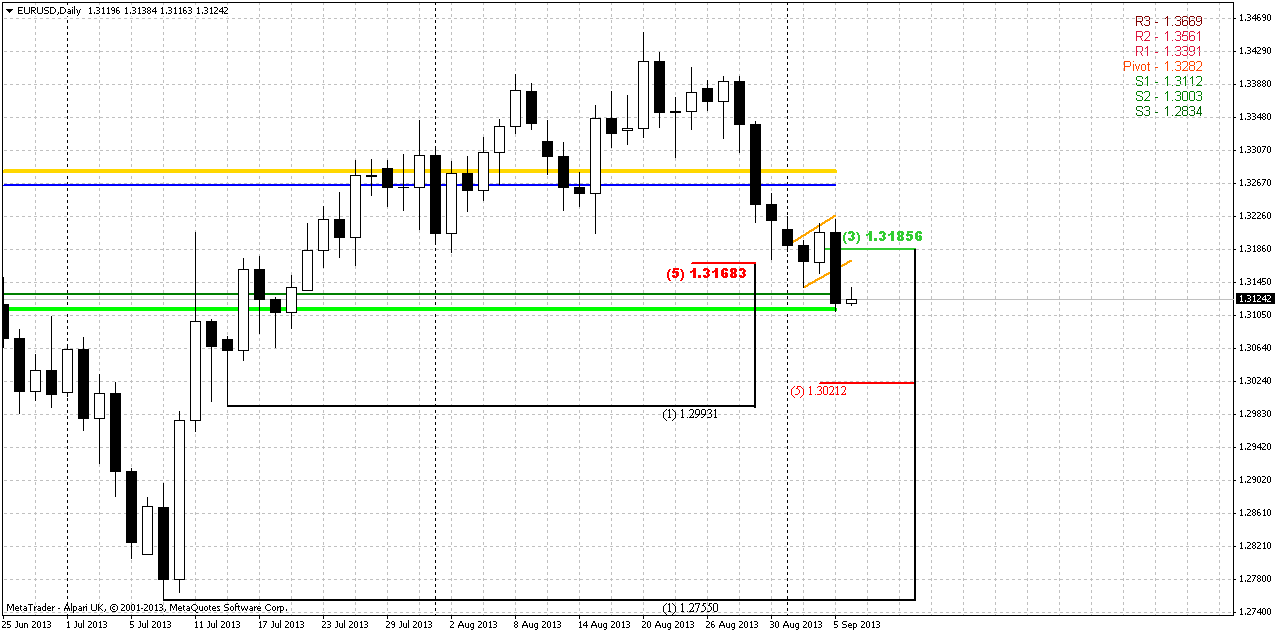
At the same time our longer term analysis remains the same, since market still stands inside flag consolidation. As we’ve said earlier, further direction will mostly depend on breakout. As a result, we could get either AB=CD down in area of yearly pivot support 1 or significant upward continuation. Yes, we have some bullish signs here – trend holds bullish, market has bounced up after testing yearly pivot point and that was not deep retracement after first challenge of 50% resistance, market has shown greater swing up, that has started in July 2012. All these moments are true, but direction will still depend on breakout, and it has failed 2 weeks ago. It means that we should be ready for some move inside the body of flag. As I’ve mentioned bullish signs here, I would like to point on single but significant bearish moment that could happen here. Usually when market shows reversal swing, it shows deeper retracement either, as a rule it takes a shape of some AB=CD. Thus, AB-CD action to the downside doesn’t seem unreal at all.
Weekly
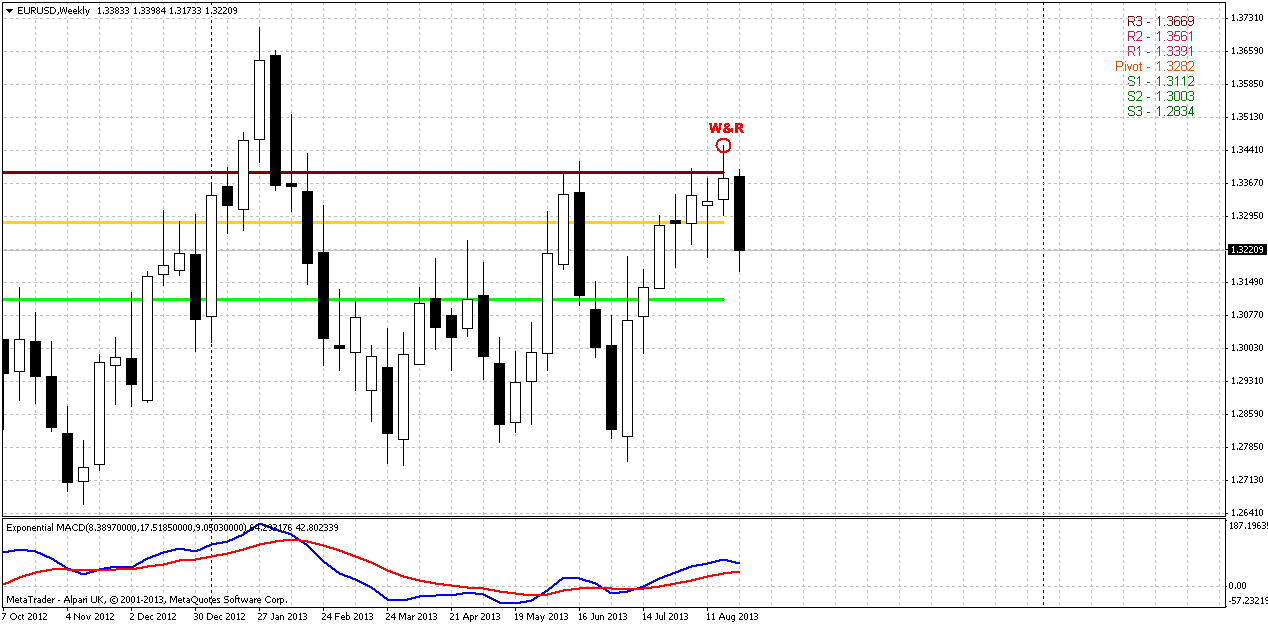
Situation on weekly chart relatively simple, mostly because we can say definitely that bullish trend has chances to appear again only if market will return right back above cleared out highs. Until this moment it is very difficult to find reasons take long position on weekly chart, although trend still holds bullish by MACD.
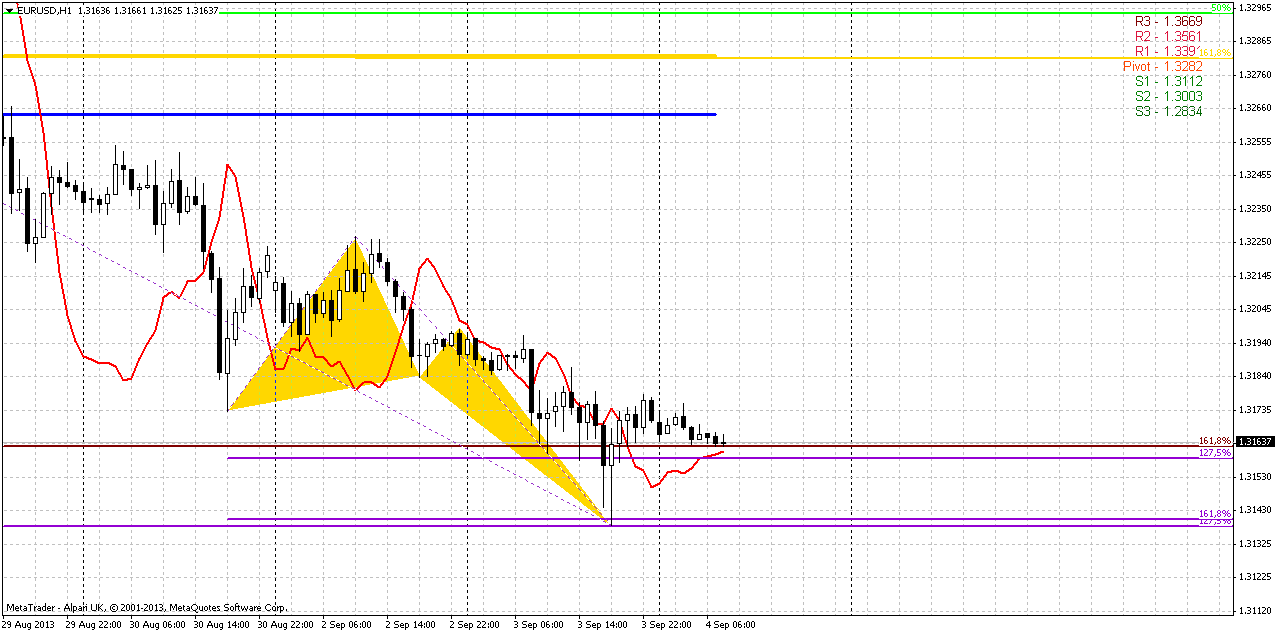
Now if we will take close look at previous candle, we will see not only W&R but also extended bearish engulfing, since market has erased 4-week upward action by just single one. Nearest level to watch for us potential destination is MPS1 at 1.3112. If you will take a look on contracted weekly chart, you’ll see that this area around 1.31 is also a historical support/resistance zone. Also market probably will show some retracement up, since it will open below new MPP and could show retracement to it on lower time frames. The way how market will response on MPP will also give us assistance in understanding of further action. Thus, as usual, if price will fail to move above MPP then this will become a confirmation of bearish sentiment here...
Daily
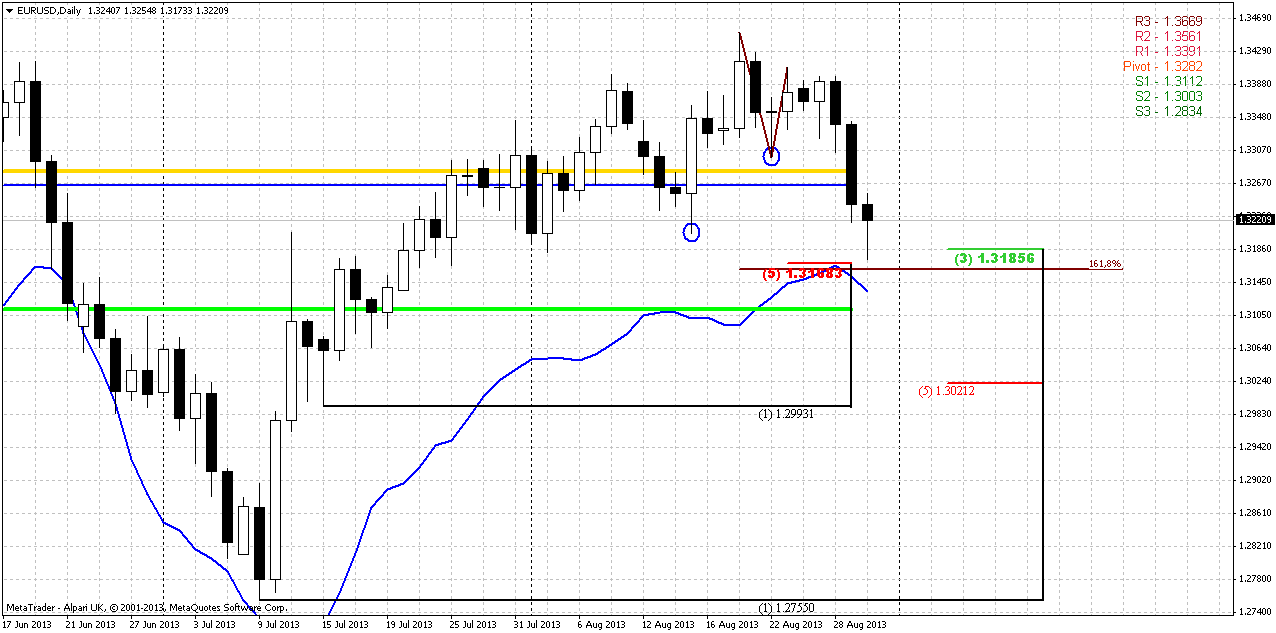
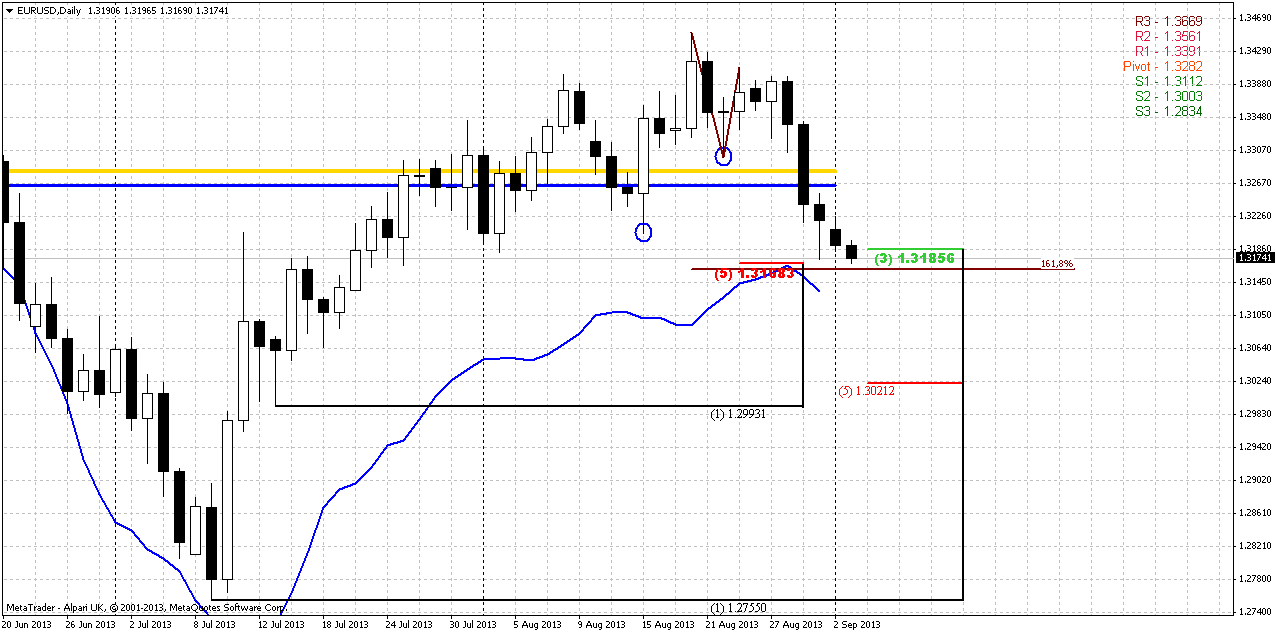
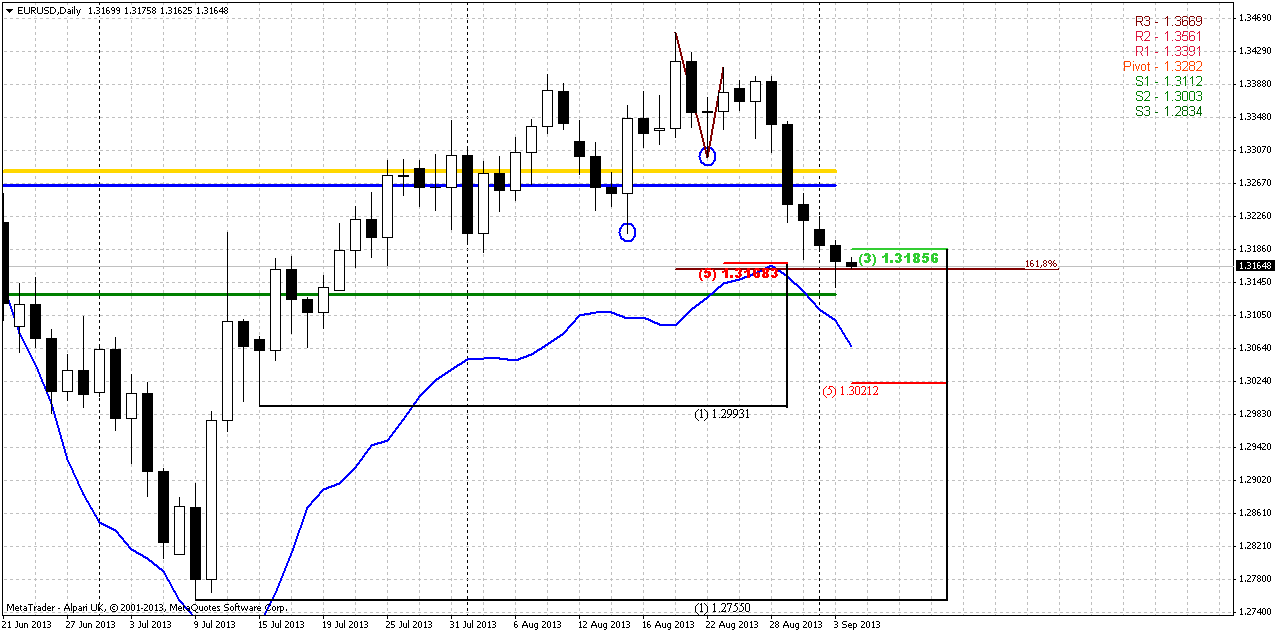
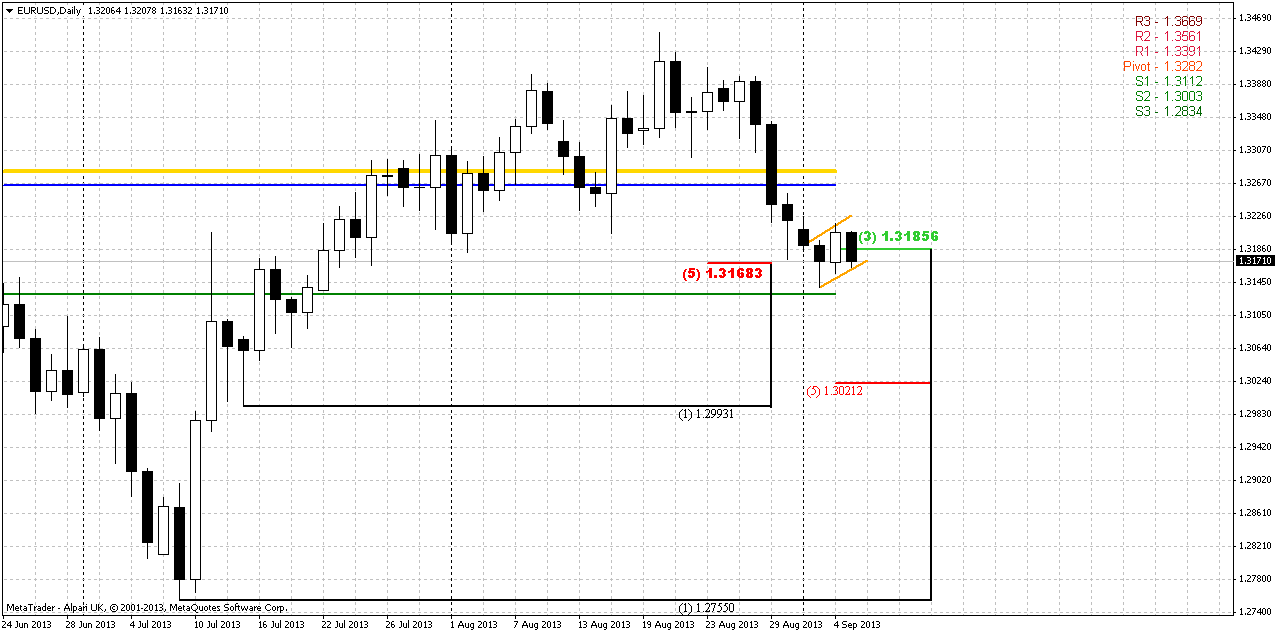
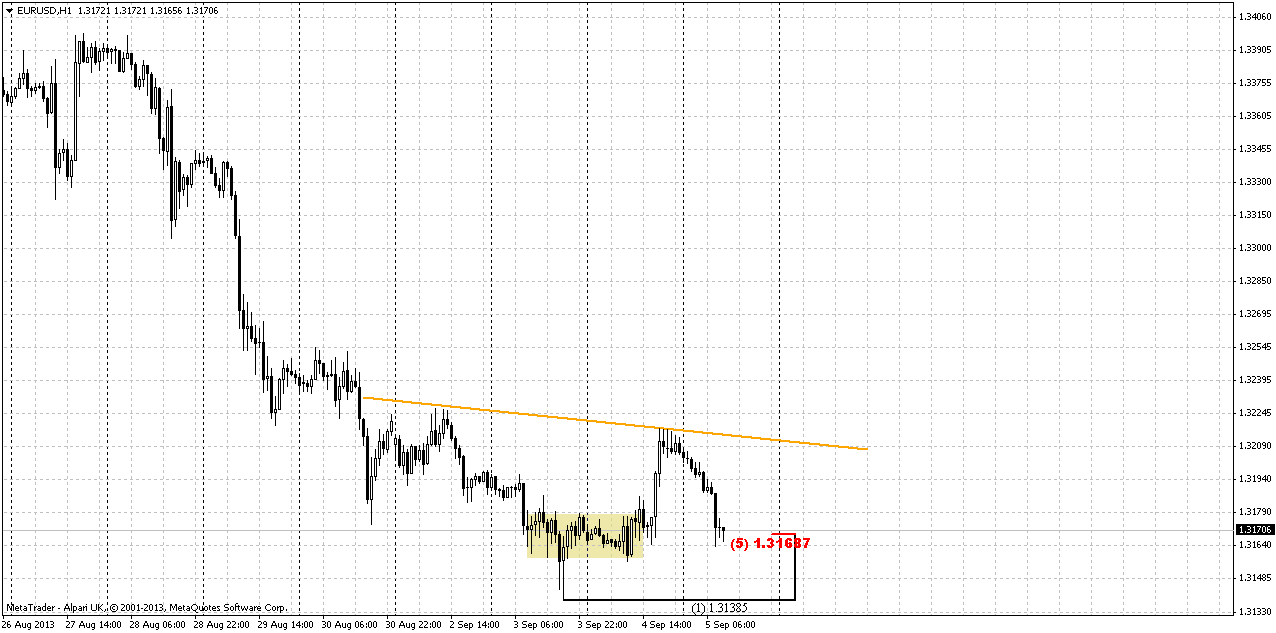
So guys, yesterday market has hit second our target of greater stop grabber pattern, and price has pierced 1.32 area. As it is followed from weekly chart, our major working swing on coming week will be current move down, since this is a week of W&R of previous highs and until market will not move above its highs again, we will think that context is bearish. Trend here is bearish as well.
Right below the market stands solid support cluster. IT includes daily K-support area that has been tested already on Friday – 1.3168-1.3185, slightly lower stands daily oversold and MPS1. Also take a look – we have an Agreement with 1.618 extension of small AB=CD pattern down here. Thus, probably we should be ready for upward bounce as soon as market will reach the target. Most probable first destination of this retracement up is combination of MPP and WPP around 1.3264-1.3282 area. This picture gives opportunities as to positional traders as to scalpers. Positional ones will wait upward bounce and search chance to take short position, while scalpers probably will try to enter long by some reversal pattern on intraday chart as 1.618 target will be hit.
4-hour
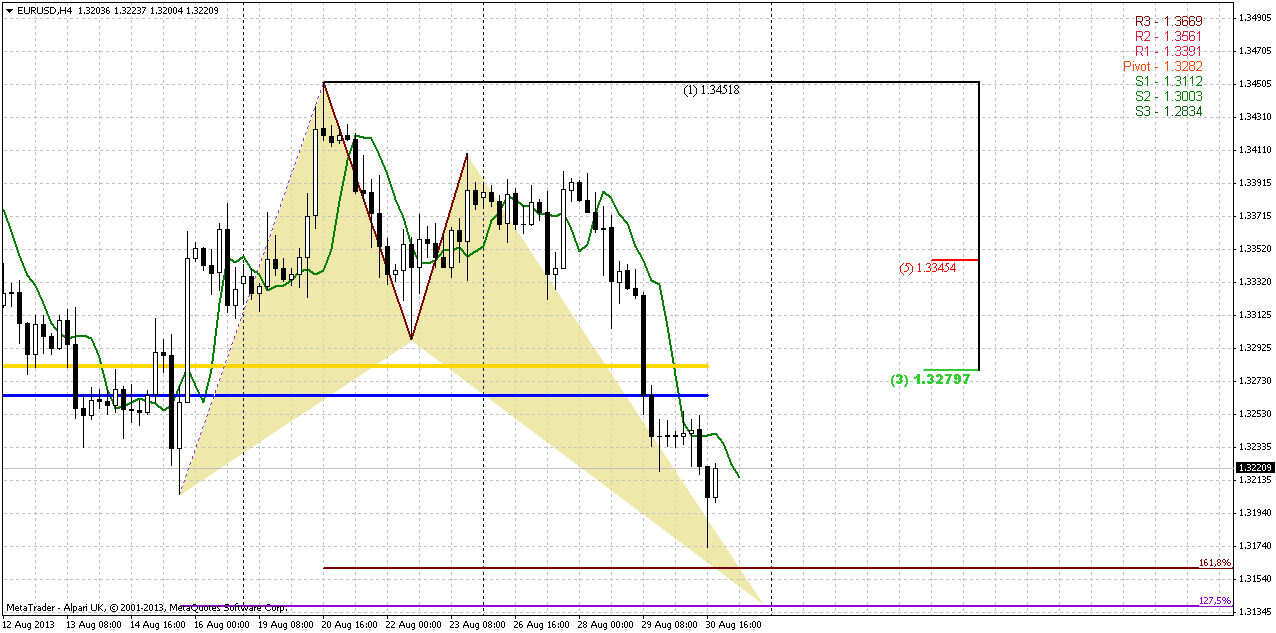
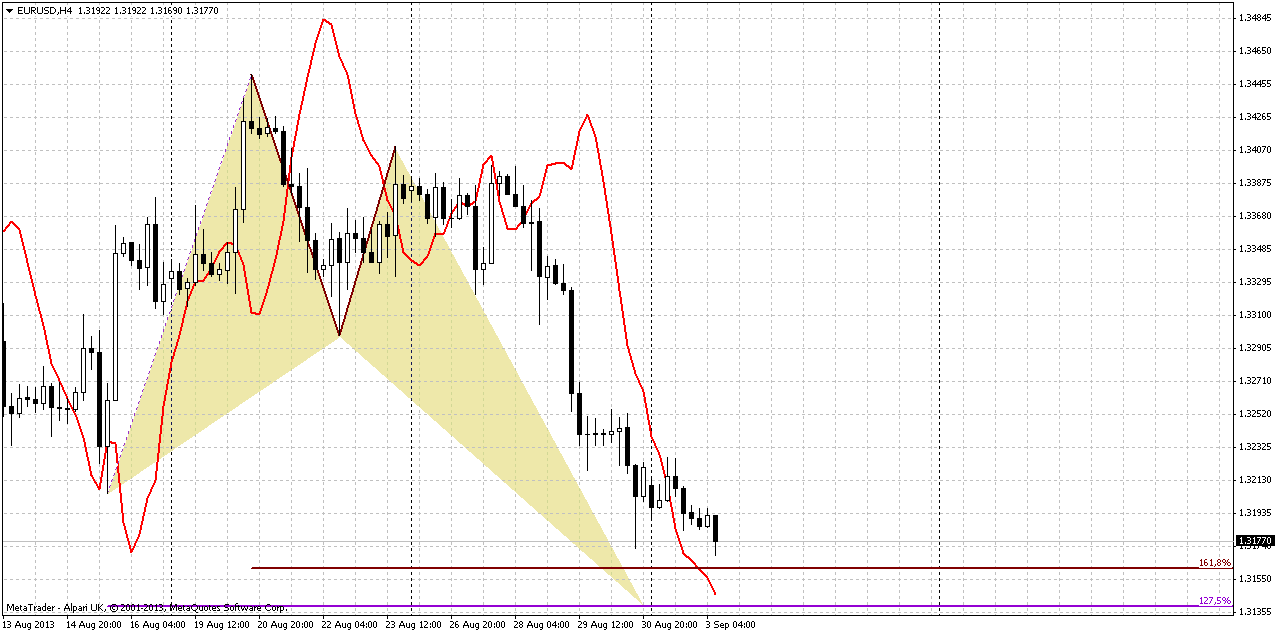
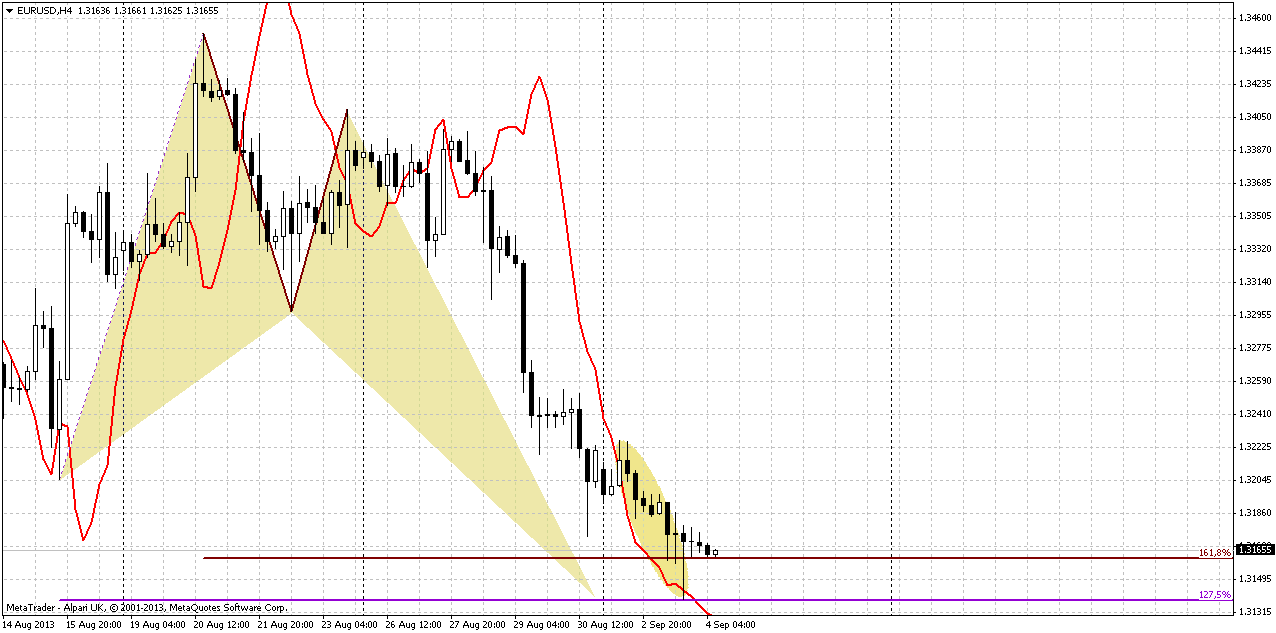
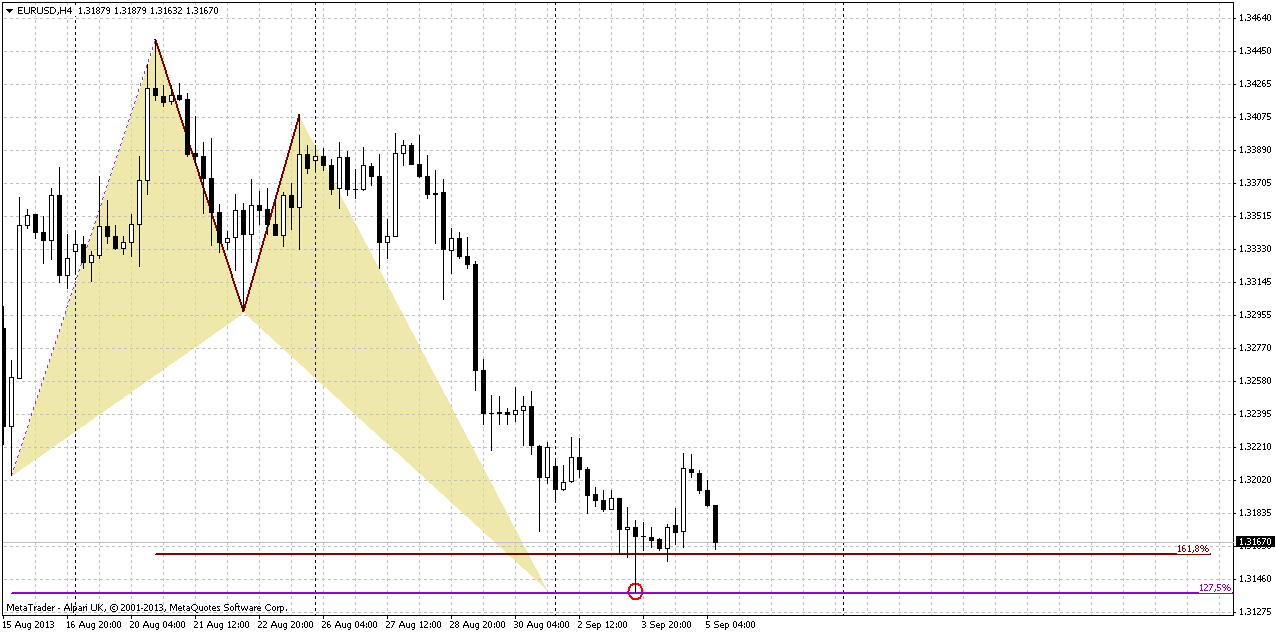
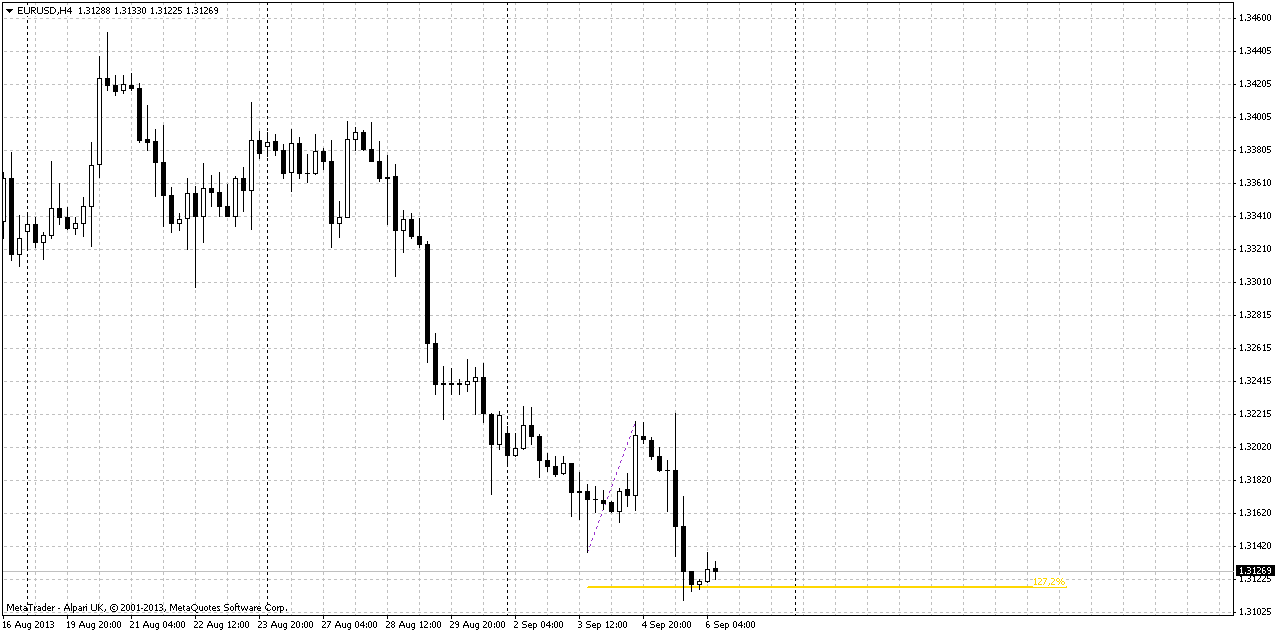
Trend is bearish here. I do not know, how to assess the results of H&S pattern that we’ve discussed on previous week, whether it has worked or not. But probably it is more worked rather than not, but judge about it by yourself. Here we have two patterns that has not quite reached the targets. Butterfly buy on top (special for you, guys), although I do not rely on butterfly “buy” on top, mostly because butterfly is reversal pattern and it could be upward reversal right at top. Anyway, the shape is the same. Second is – the same AB=CD down and market has not quite reached the 1.618 extension. You probably already know what I would say – until market will not hit it, it is unsafe to take long position here.
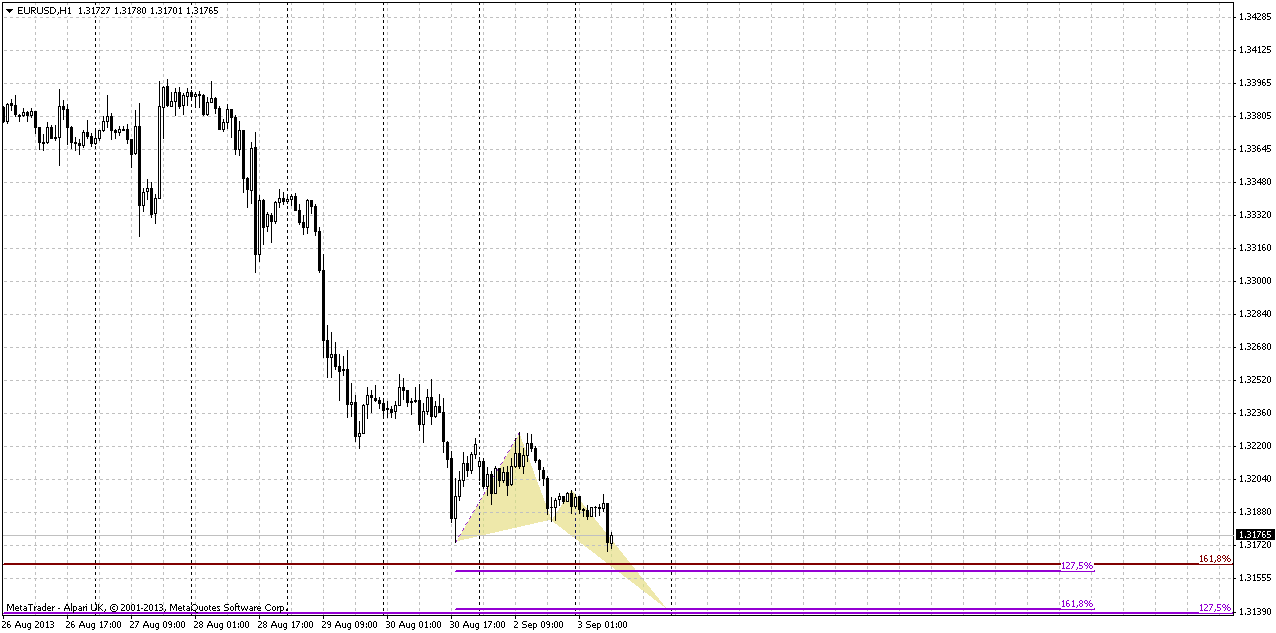
Second interesting moment here is thrust down. Although yesterday we’ve seen sideways action and thought that this could become start of DiNapoli directional pattern, but that has not happened. Despite this consolidation thrust is nice and absolutely suitable for directional pattern, because market has not reached any significant Fib level within this sideways action. Thus, it could happen that retracement up will still be started by some DiNapoli pattern when price will hit daily targets.
Finally take a look that combination of WPP and MPP is also a Fib resistance. Currently it is 3/8, but if market will drif slightly lower and hit target - 50% level could appear in this area.
Conclusion:
As on big picture market has failed to show upward breakout, this could lead price back to lower border of consolidation that stands around yearly pivot point and 1.29 area.
Meantime in short-term charts our trading plan suggests to wait when price will reach daily targets and then look for bounce up in area of agreement MPP and WPP. No doubts that scalpers could use this scenario for attempt to take long position based on possible reversal patterns that market could form around daily targets. Happy pips everybody on coming week. I hope that we will not become victims of rapid and unexpected moves on Syria question. This unfortunately stands out of our control. There will be Labor Day on Monday, market could be thin, and thus retracement could come a bit easier.
The technical portion of Sive's analysis owes a great deal to Joe DiNapoli's methods, and uses a number of Joe's proprietary indicators. Please note that Sive's analysis is his own view of the market and is not endorsed by Joe DiNapoli or any related companies.
On passed week market has continued gradual move down and as August candle has closed – it took the shape of failure upward breakout again and W&R of previous highs. With uncertainty around Syria it is difficult to suggest what will happen, but by taking a look at previous action we could make a conclusion that market should return right back to 1.29 area again. At least when market has failed to pass through upper border of current consolidation it has turned in opposite direction and reached other border of consolidation. May be this will happen again.
At the same time our longer term analysis remains the same, since market still stands inside flag consolidation. As we’ve said earlier, further direction will mostly depend on breakout. As a result, we could get either AB=CD down in area of yearly pivot support 1 or significant upward continuation. Yes, we have some bullish signs here – trend holds bullish, market has bounced up after testing yearly pivot point and that was not deep retracement after first challenge of 50% resistance, market has shown greater swing up, that has started in July 2012. All these moments are true, but direction will still depend on breakout, and it has failed 2 weeks ago. It means that we should be ready for some move inside the body of flag. As I’ve mentioned bullish signs here, I would like to point on single but significant bearish moment that could happen here. Usually when market shows reversal swing, it shows deeper retracement either, as a rule it takes a shape of some AB=CD. Thus, AB-CD action to the downside doesn’t seem unreal at all.
Weekly
Situation on weekly chart relatively simple, mostly because we can say definitely that bullish trend has chances to appear again only if market will return right back above cleared out highs. Until this moment it is very difficult to find reasons take long position on weekly chart, although trend still holds bullish by MACD.
Now if we will take close look at previous candle, we will see not only W&R but also extended bearish engulfing, since market has erased 4-week upward action by just single one. Nearest level to watch for us potential destination is MPS1 at 1.3112. If you will take a look on contracted weekly chart, you’ll see that this area around 1.31 is also a historical support/resistance zone. Also market probably will show some retracement up, since it will open below new MPP and could show retracement to it on lower time frames. The way how market will response on MPP will also give us assistance in understanding of further action. Thus, as usual, if price will fail to move above MPP then this will become a confirmation of bearish sentiment here...
Daily
So guys, yesterday market has hit second our target of greater stop grabber pattern, and price has pierced 1.32 area. As it is followed from weekly chart, our major working swing on coming week will be current move down, since this is a week of W&R of previous highs and until market will not move above its highs again, we will think that context is bearish. Trend here is bearish as well.
Right below the market stands solid support cluster. IT includes daily K-support area that has been tested already on Friday – 1.3168-1.3185, slightly lower stands daily oversold and MPS1. Also take a look – we have an Agreement with 1.618 extension of small AB=CD pattern down here. Thus, probably we should be ready for upward bounce as soon as market will reach the target. Most probable first destination of this retracement up is combination of MPP and WPP around 1.3264-1.3282 area. This picture gives opportunities as to positional traders as to scalpers. Positional ones will wait upward bounce and search chance to take short position, while scalpers probably will try to enter long by some reversal pattern on intraday chart as 1.618 target will be hit.
4-hour
Trend is bearish here. I do not know, how to assess the results of H&S pattern that we’ve discussed on previous week, whether it has worked or not. But probably it is more worked rather than not, but judge about it by yourself. Here we have two patterns that has not quite reached the targets. Butterfly buy on top (special for you, guys), although I do not rely on butterfly “buy” on top, mostly because butterfly is reversal pattern and it could be upward reversal right at top. Anyway, the shape is the same. Second is – the same AB=CD down and market has not quite reached the 1.618 extension. You probably already know what I would say – until market will not hit it, it is unsafe to take long position here.
Second interesting moment here is thrust down. Although yesterday we’ve seen sideways action and thought that this could become start of DiNapoli directional pattern, but that has not happened. Despite this consolidation thrust is nice and absolutely suitable for directional pattern, because market has not reached any significant Fib level within this sideways action. Thus, it could happen that retracement up will still be started by some DiNapoli pattern when price will hit daily targets.
Finally take a look that combination of WPP and MPP is also a Fib resistance. Currently it is 3/8, but if market will drif slightly lower and hit target - 50% level could appear in this area.
Conclusion:
As on big picture market has failed to show upward breakout, this could lead price back to lower border of consolidation that stands around yearly pivot point and 1.29 area.
Meantime in short-term charts our trading plan suggests to wait when price will reach daily targets and then look for bounce up in area of agreement MPP and WPP. No doubts that scalpers could use this scenario for attempt to take long position based on possible reversal patterns that market could form around daily targets. Happy pips everybody on coming week. I hope that we will not become victims of rapid and unexpected moves on Syria question. This unfortunately stands out of our control. There will be Labor Day on Monday, market could be thin, and thus retracement could come a bit easier.
The technical portion of Sive's analysis owes a great deal to Joe DiNapoli's methods, and uses a number of Joe's proprietary indicators. Please note that Sive's analysis is his own view of the market and is not endorsed by Joe DiNapoli or any related companies.
")

