mmhhh... i think i am confused... 20 as in 3120? now we are at 3210, that's about 90 pips from 3120. ok, even from 3180, it's still 60 pips from 3120. so how can you say that's so close? 60 or 90 pips is not so close IMO, especially considering how slowly e/u moves. of course, on a daily and above TF, it's not far.
also, what i don't understand is this: if all the signs are there indicating that it's gonna go up first, as sive explained it (and i say this because my system being different from sive also shows the same), why would you want to short? i don't get it.
also, what do you mean by 'standalone fractal'? as far as i understand, williams's fractal indicator is just a visual aid highlighting highs and lows, which can easily be seen by the naked eye if you display the wicks. all you need to do is look at the chart and one can see where the highs/lows and HHs/LLs are. so i never understood the use of that fractal indicator, which by the way williams recommend to use together with his alligator indicator which just another very simplistic set up, i.e. 3 displaced SMAs.
quite frankly, i tried it williams's approach (both alligator and fractal) and it seemed pretty useless on short TFs and forex (maybe it works better with equities and daily and longer TFs). could you explain why do you see any value in using it? perhaps i am missing something here.
finally, if i understand you correctly, your analysis seems to point to the exact opposite direction of sive's analysis. how do you handle this contradiction? what i mean to say is that if you are absolutely convinced that you analysis is more correct, that is, market will reach 3120 before 3260/80, how do systematically argue the correctness of your assessment and therefore the incorrectness of sive's assessment? i mean, the dinapoli based analysis seems pretty rock solid to me in this regard and i personally would find it rather difficult to argue against, at least as far as today's analysis concerned.
")
i mean, that is something i would be wondering about if i were in your shoes. i say this because to me it is far from obvious that this business of 'fractal' standalone or not is sufficient to call 3120 before 3260/80... perhaps some weird elliott voodoo is involved here that makes it more correct?
just thinking out loud... cheers
Triantus, here I am:
- yes, I am trying to do analysis based on Elliott; I am practicing also Pesavento & Carney;
- yes, Bill Williams fractals
- about wicks: lots of times stand alone fractal (no fractal opposite) appears and high/low is level for break; on the other hand also stand alone fractal in opposite direction of move appears and later move in its direction developes
- sorry, I am short but because 20 is so close and on 1H 5 wave structure could develop dont believe trade will last long
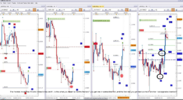
In the picture we can see stand alone low fractals on 4 and 2H and I think euro will go down and make new low fractal BUT I am no more sure we will establish new LL, at least not before hiting 1,32971; will take photo from time to time and publish...
View attachment 11063