Sive Morten
Special Consultant to the FPA
- Messages
- 18,771
Monthly
The dollar slipped on Friday after data showed U.S. employers added the fewest jobs in eight months, eroding confidence in the economy and reviving bets that the Federal Reserve might leave interest rates near zero for longer than anticipated.
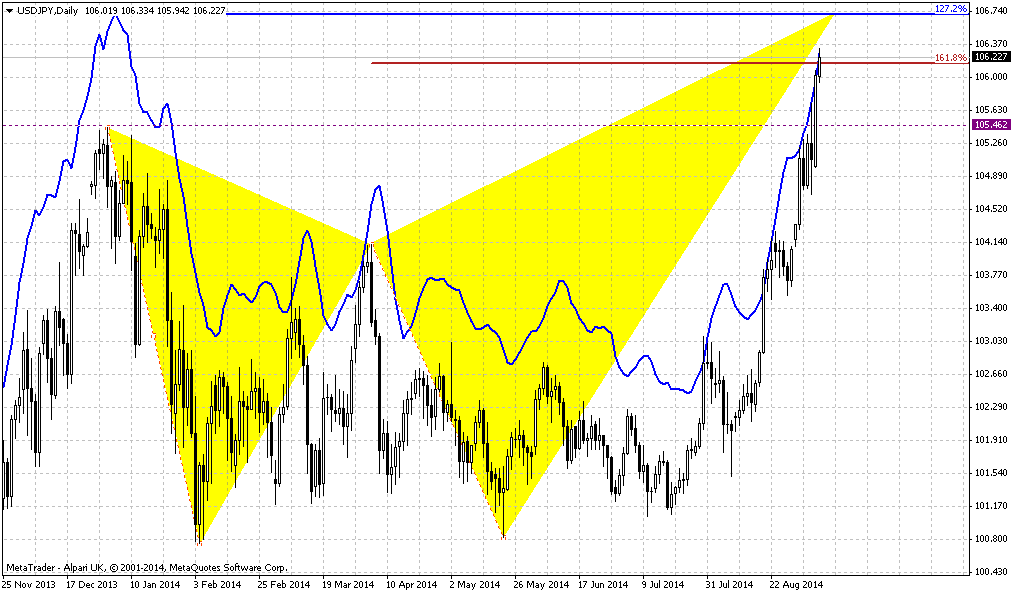
The U.S. Labor Department said non-farm payrolls grew by 142,000 last month, far below the 225,000 forecast by analysts polled by Reuters. The greenback scaled back from a nearly six-year high against the yen set in earlier trading. It managed to close 0.9 percent higher on the week above 105 yen, which has not happened since January.
The euro recovered from a 14-month low against the dollar the day after a surprise interest rate cut from the European Central Bank to help an anemic euro zone economy. The currency was still on track for its eighth week of losses against the dollar, the longest since it was introduced in January 1999.
"This payrolls report gives the currency market a reason to embark on a mild correction on the dollar," said Mark McCormick, currency strategist at Credit Agricole in New York.
The dollar's decline was mitigated by news of a ceasefire deal between Ukraine and rebels. The fighting had stoked safe-haven bids for the yen and the Swiss franc.
While the August reading on U.S. hiring fell far short of the median forecast, an increase in hourly earnings and a gauge on long-term joblessness were more promising.
That data, along with this week's robust figures on domestic manufacturing and car sales, supported the view that the world's biggest economy was expanding at a steady clip. This should keep the U.S. central bank on course to raise the policy rate from near zero into mid-2015, analysts said. "The market will likely begin to discount this jobs report as we head into the next Fed meeting," McCormick said.
The Federal Open Market Committee, the Fed's policy-setting group, will meet Sept. 16-17.
The dollar on the EBS trading system last traded down 0.21 percent at 105.035 yen after it touched a nearly six-year high of 105.71 in Asian trading.
The greenback was on track to rise against the yen for the fourth straight week, the longest stretch this year. The euro clung to a 0.1 percent gain against the dollar at $1.2954 after shedding 1.6 percent on Thursday, its steepest fall in almost three years, to a 14-month low of $1.2920 after the ECB cut rates to record lows and launched a bond purchase program to avert deflation.
Some analysts reckoned until U.S. bond yields breaks higher, the dollar has likely reached a top in the near term. "We need to see a substantial rise in U.S. yields for the dollar to gain further," said Eric Viloria, currency strategist at Wells Fargo Securities in New York. Benchmark 10-year Treasuries yields ended the week 12 basis points higher at 2.46 percent, the highest close in nearly four weeks.
And let’s keep this long-term forecast by Goldman Sachs:
"We are revising down our (euro/dollar) forecast to 1.29, 1.25 and 1.20 in three, six and 12 months (from 1.35, 1.34 and 1.30 previously)," the analysts wrote. "We are also revising our longer-term forecasts lower, bringing the end-2015 number down to 1.15 (from 1.27), that for end-2016 to 1.05 (from 1.23) and that for end-2017 to 1.00 (from 1.20)."
As euro continues to move down, it is interesting what has happened with CFTC data. Brief look points on increase in all data – Open interest, Longs and shorts:
Open interest:

Longs:

Shorts:

Currently our ratio of short positions has increased to 224229/(224229+59046)=79,15%. This brings nothing new in our previous analysis - we see increase as long position as short positon, but short grows faster and leads to growth of ratio. Growing open interest and short position confirms strength of bearish trend on EUR. At the same time CFTC ratio has not reached yet crucial ~82% level when probability of reversal or at least retracement increases significantly. In turn, this means that market still has some room. When ratio approaches 80-82% this becomes significant, because it means that almost all speculators stand short and nobody can sell more to support trend down. At the same time this does not mean that market can’t turn to retracement earlier.
In long term perspective our suggestion that EUR will stay under pressure for long time. Initially we’ve made this suggestion in November 2011. Do you remember this quarterly chart of US Dollar Index? This analysis still suggests further USD growth. On previous week there was significant ECB meeting that brings new colors to current balance. If we even will not take on recent rate cutting, Draghi has announced 1 Trln EUR QE program. It means that EU and US financial policy will go on opposite courses.
Currently first driving factor is US economy improvement. Macroeconomy suggests that when economy comes out from recession into growth – the first stage is “desinflation growth”. Economy shows improvement without jump in inflation. May be right now we are entering in this stage, at least most analysts point on obvious improvements in US economy and there are no doubts about it.
Combining these two moments makes me think that probably this is really first stage. Second stage will be “inflationary growth” – this is a period when Fed’s rate dancing will start. Probably we will see first bell of this when wages in US will start to grow that we do not see yet.Since we have at least 8-12 months when rate will not change.
At the same time, it seems that EUR will remain under pressure as Draghi confirms this, and we see some reasons for this as well. Even before Ukranian crisis EU has its own problems that press ECB keeps rate low and even apply clearly dovish rethoric. As EU has intiated sunctions against Russia this will hurt trade balance and negatively impact on EU. At the same time this is just small part of goods that Russia could forbid potentially and recent data on GDP of Germany, France, Italy shows slightly worse that expected numbers. Other words, mutual sanctions do not assume improvement in economy.
Reducing of export for EU countries will mean also unemployment growth, reducing of trade balance, GDP and budget income. In current situation this is not good, especially for new members of EU that are more sensible to economic negative situations and that were hurted stronger in 2008. At the same time EU still has its own problems, such as desinflation in major economies.
Besides, recent NATO meeting in Wales will totally put Europe in financial burden, since they call for increasing of military spending to 2% of GDP of each country. NATO was absolutely useless organisation in recent 20 years and now, when they have found phantom menace in Russia (after problems that EU and US have created by themselves), they finally has found sense to exist. US Military companies take 75% of all defense spendings and now European taxpayers and citizens will pay to US for approximately 2% of GDP annually. Hardly this will support EU economy.
All these facts make us think that EUR/USD will continue move south with moderate pace during the 8-12 months and even could accelearted when real hazard of US rate hiking will appear if any positive shifts in EU economy will not come. Depending on how external political atmospehre will change – we will gradually adjust our view.
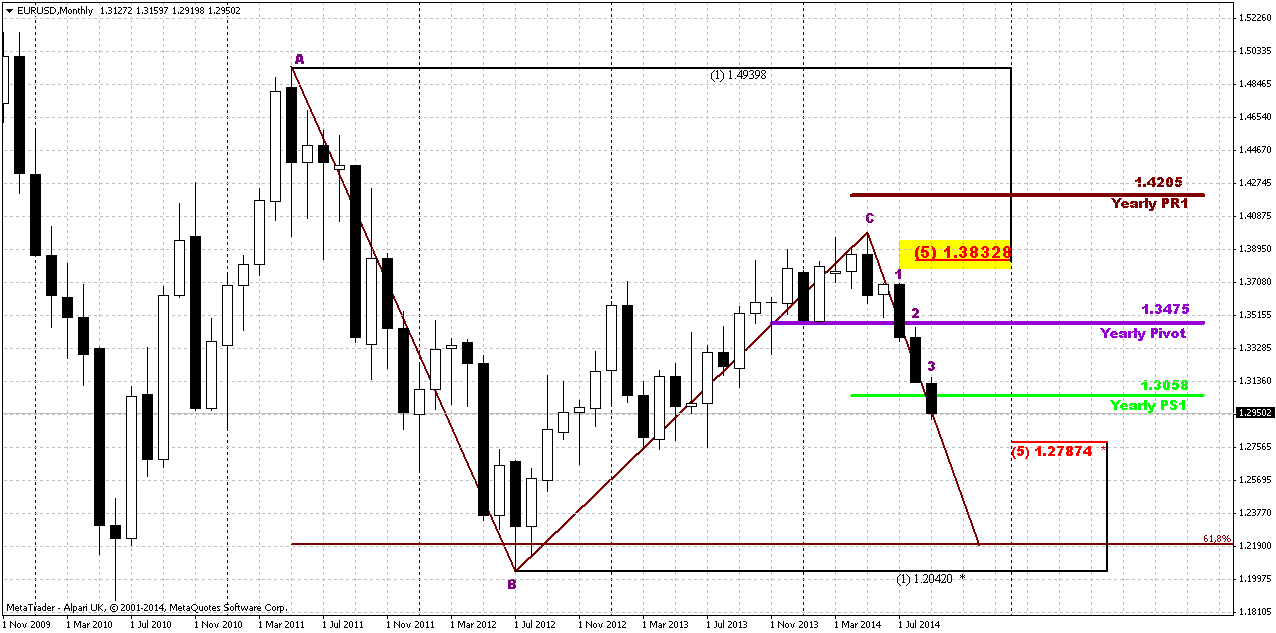
Technical
So, situation on long-term chart enters in new stage. Trend is bearish here and market has broken below Yearly PS1. As a rule, moving below any PS1 suggests appearing of new bearish trend or continuation of existing one. Since we’re talking about yearly pivots, we mean that 2015 could stand under sign of bears. Market is not at oversold – it stands below 1.20. So from this point of view market has no limits to move down further.
Now about targets. Looks like right now EUR stands at 50% Fib support that it likes very much. Next support is 1.2787 – major 5/8 Fib level. But sooner or later it seems that market will gravitate to 0.618 extension of Huge AB=CD pattern at 1.2190 level. This probably will become our next long-term target. And finally, I’m not sure but looks like here we have 3 black crows pattern – I’ve marked it by numbers. If this is indeed so, then it proves of new bear trend and 1.2190 target seems not as fantastic as it looks right now.
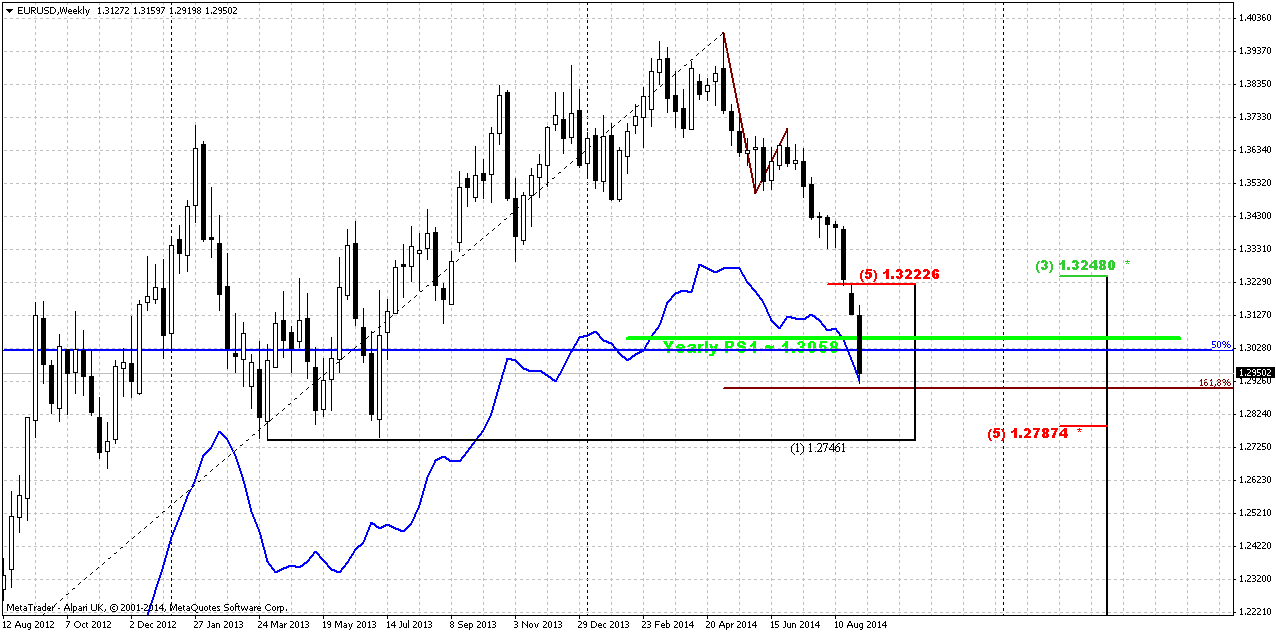
B]Weekly[/B]
Weekly... This picture gives some very important issues. Here plot 50% level. Actually it coincides with MPS1. Has market broken it or not – difficult to say. At first glance price has moved below as 50% as Montly and Yearly PS1 rather deep. But from the other side the reason for that could stand with AB=CD 1.618 target. In general this area between Pivots, 50% Fib support and 1.618 target and oversold looks like solid support cluster. As recent NFP data was worse than expected – EUR has chances to show retracement up or at least it could be sideways action to exit out from oversold condition.
Second moment that is worthy of our attention is former K-support at 1.3230-3260 area. Take a look that market has passed through it by gap down without any respect like it does not exist at all. This issue could help us with potential upside target. The point is that very often when you see fast movement through strong support area – market very often returns right back and re-test it.
And finally what else could we watch here... I do not have 3x3 DMA on this chart but if you will draw it then you’ll see that recent move down is suitable for DiNapoli weekly DRPO or B&B. And weekly pattern has absolutely different scale and it could point us direction for some weeks if any pattern will be formed.
Thus, here we can make following conclusion: do not take any long-term short positions by far. Market may be will show minor spike down to touch AB=CD target but right downward action will be under question. Second – watch for patterns. Third – possible upward retracement target, if it will happen at all, stands at former K-support around 1.3230-1.3250 area.
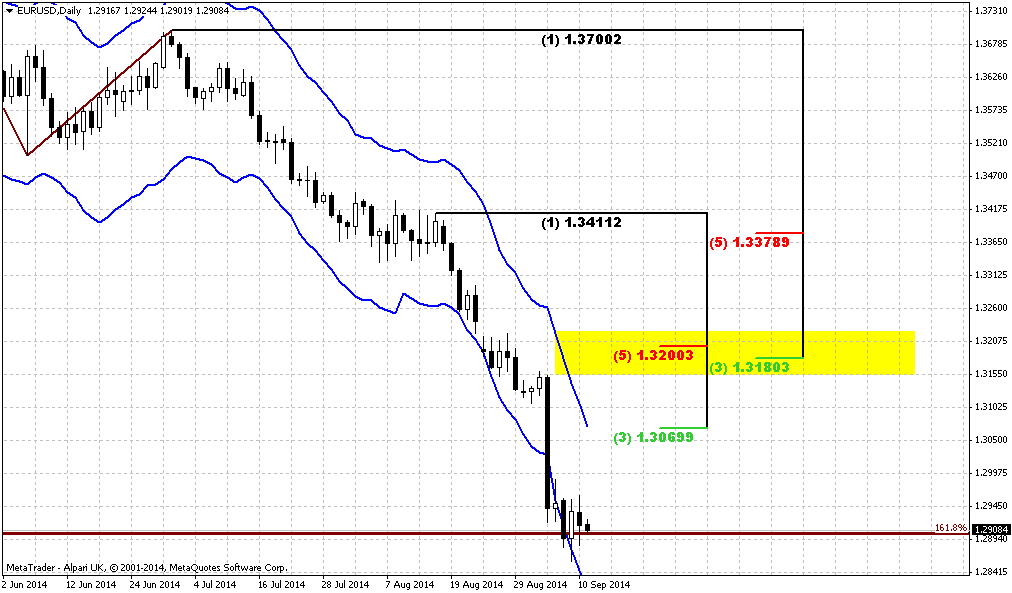
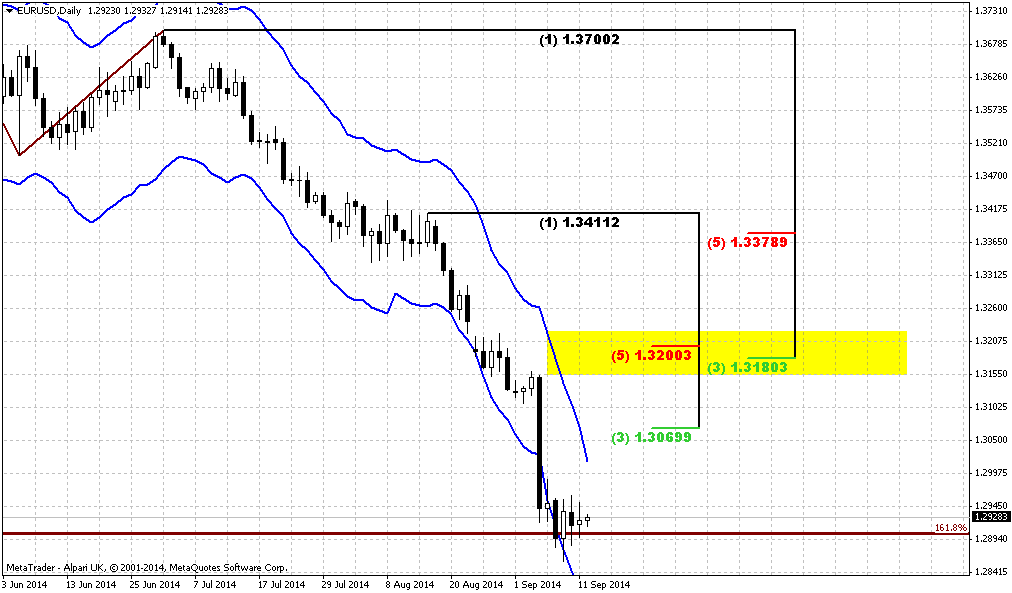
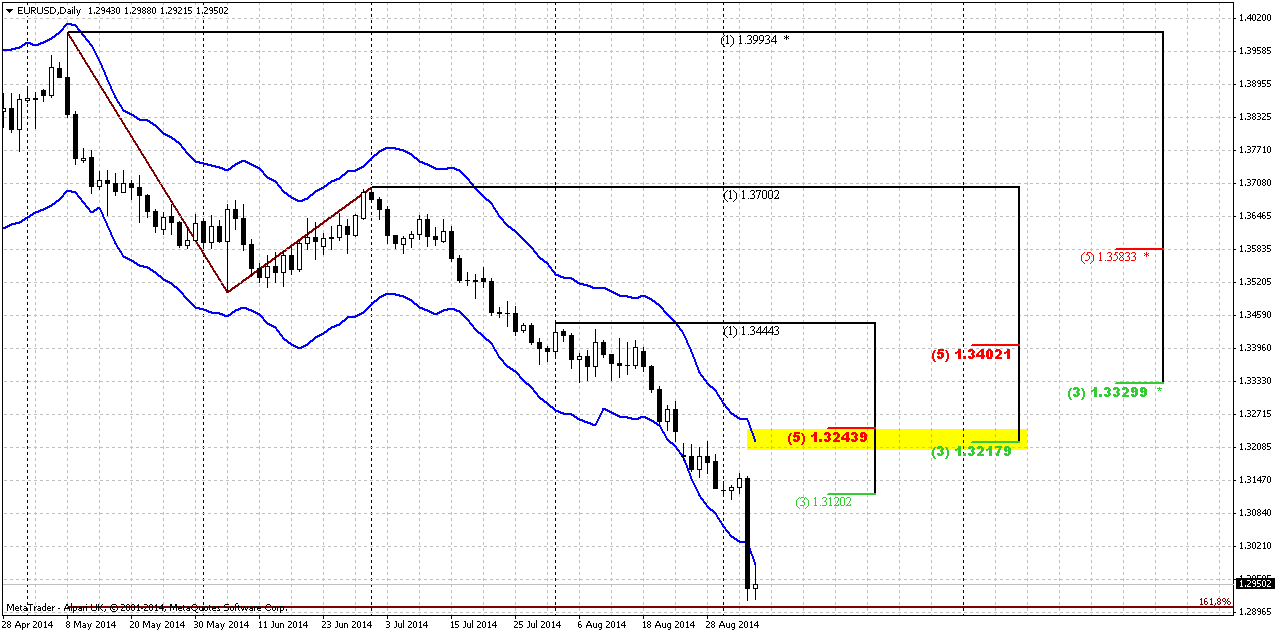
Daily brings nothing really new to overall analysis, but adds some details. Thus, market is oversold here either, but here you can see that price slightly has not reached 1.618 target. We do not interesting much with first Fib resistance, because market at oversold. In fact we’re mostly interested with 2 K-resistance levels and particular with first one. The point is that this 1.3217-1.3243 level coincides not only with daily overbought, although this is also very important, but it matches weekly disrespected K-support area. Still as this miserable plunge down has happened just 2 sessions ago – market has no sufficient time to create some pattern or something. Thus, on daily we currently can’t make any conclusion whether upward action will happen, when it will happen and how it will start. We need to wait a bit, give market time to calm down shut down emotions and accommodate to new price area.
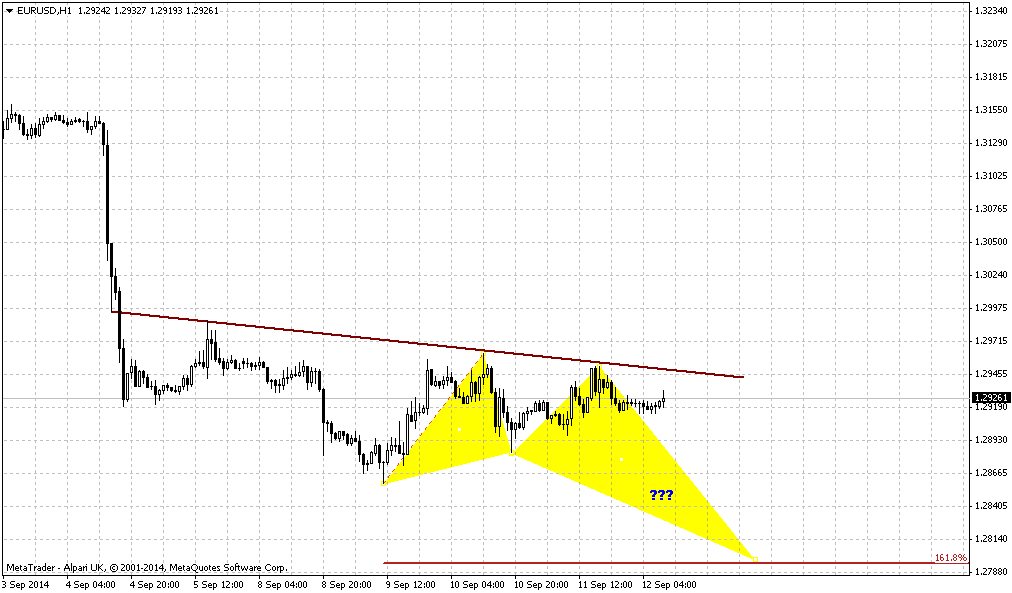
1-hour
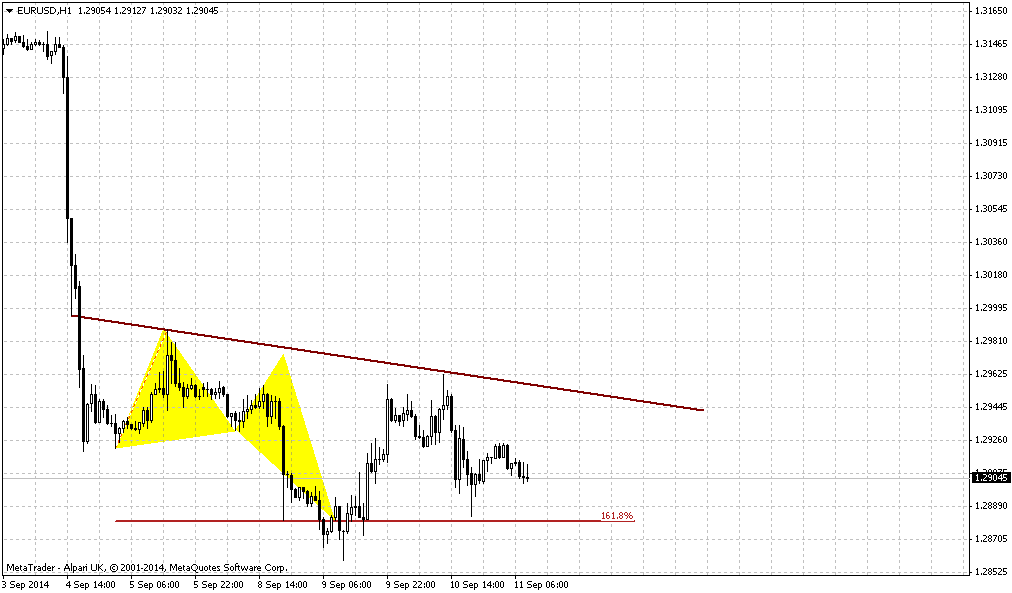
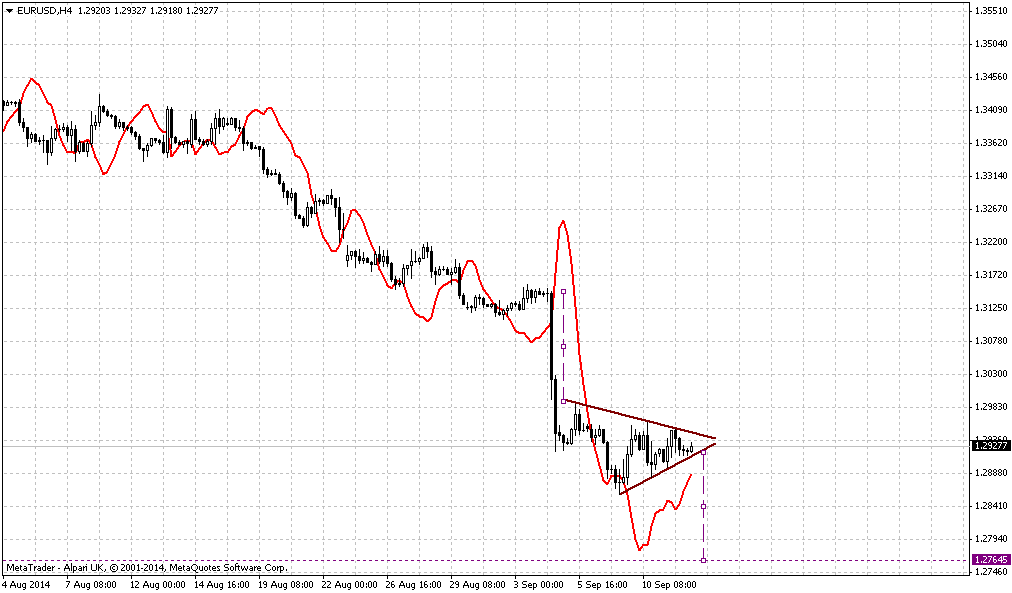
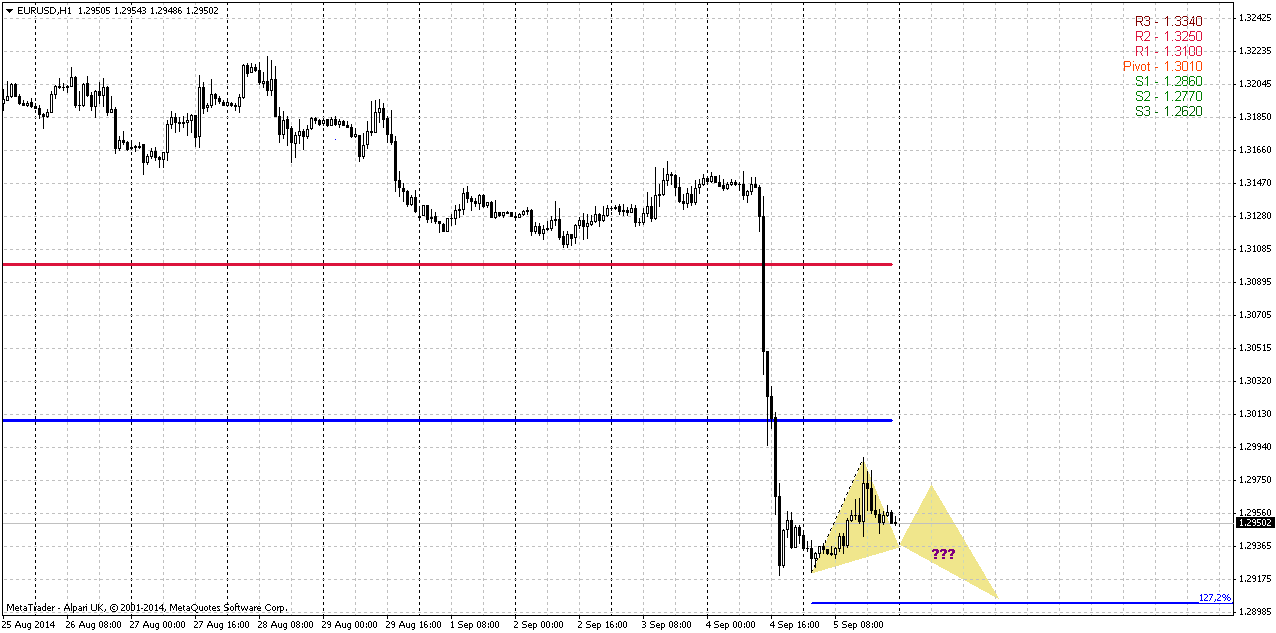
It is not big sense to take a look at 4-hour chart right now, since there is just one big black bar. On hourly chart we could suggest appearing of some pattern that will be simultaneously reversal and that suggest some downward action. I’ve drawn a butterfly. Appearing of this pattern will be enough to complete AB-CD 1.618 daily target.
Conclusion:
Big picture on EUR has entered in new phase. It could turn so that our next target could be 1.21.
In shorter-term perspective we should forget about taking short position, since EUR is oversold as on daily as on weekly chart. This moment significantly increases appearing of retracement up, especially after shyer NFP numbers. Most probable destination of retracement is an area around 1.3220-1.3240. Thus, on coming week, we should watch for reaching of AB=CD target first and second – appearing of any reversal patterns.
The technical portion of Sive's analysis owes a great deal to Joe DiNapoli's methods, and uses a number of Joe's proprietary indicators. Please note that Sive's analysis is his own view of the market and is not endorsed by Joe DiNapoli or any related companies.
The dollar slipped on Friday after data showed U.S. employers added the fewest jobs in eight months, eroding confidence in the economy and reviving bets that the Federal Reserve might leave interest rates near zero for longer than anticipated.
The U.S. Labor Department said non-farm payrolls grew by 142,000 last month, far below the 225,000 forecast by analysts polled by Reuters. The greenback scaled back from a nearly six-year high against the yen set in earlier trading. It managed to close 0.9 percent higher on the week above 105 yen, which has not happened since January.
The euro recovered from a 14-month low against the dollar the day after a surprise interest rate cut from the European Central Bank to help an anemic euro zone economy. The currency was still on track for its eighth week of losses against the dollar, the longest since it was introduced in January 1999.
"This payrolls report gives the currency market a reason to embark on a mild correction on the dollar," said Mark McCormick, currency strategist at Credit Agricole in New York.
The dollar's decline was mitigated by news of a ceasefire deal between Ukraine and rebels. The fighting had stoked safe-haven bids for the yen and the Swiss franc.
While the August reading on U.S. hiring fell far short of the median forecast, an increase in hourly earnings and a gauge on long-term joblessness were more promising.
That data, along with this week's robust figures on domestic manufacturing and car sales, supported the view that the world's biggest economy was expanding at a steady clip. This should keep the U.S. central bank on course to raise the policy rate from near zero into mid-2015, analysts said. "The market will likely begin to discount this jobs report as we head into the next Fed meeting," McCormick said.
The Federal Open Market Committee, the Fed's policy-setting group, will meet Sept. 16-17.
The dollar on the EBS trading system last traded down 0.21 percent at 105.035 yen after it touched a nearly six-year high of 105.71 in Asian trading.
The greenback was on track to rise against the yen for the fourth straight week, the longest stretch this year. The euro clung to a 0.1 percent gain against the dollar at $1.2954 after shedding 1.6 percent on Thursday, its steepest fall in almost three years, to a 14-month low of $1.2920 after the ECB cut rates to record lows and launched a bond purchase program to avert deflation.
Some analysts reckoned until U.S. bond yields breaks higher, the dollar has likely reached a top in the near term. "We need to see a substantial rise in U.S. yields for the dollar to gain further," said Eric Viloria, currency strategist at Wells Fargo Securities in New York. Benchmark 10-year Treasuries yields ended the week 12 basis points higher at 2.46 percent, the highest close in nearly four weeks.
And let’s keep this long-term forecast by Goldman Sachs:
"We are revising down our (euro/dollar) forecast to 1.29, 1.25 and 1.20 in three, six and 12 months (from 1.35, 1.34 and 1.30 previously)," the analysts wrote. "We are also revising our longer-term forecasts lower, bringing the end-2015 number down to 1.15 (from 1.27), that for end-2016 to 1.05 (from 1.23) and that for end-2017 to 1.00 (from 1.20)."
As euro continues to move down, it is interesting what has happened with CFTC data. Brief look points on increase in all data – Open interest, Longs and shorts:
Open interest:
Longs:
Shorts:
Currently our ratio of short positions has increased to 224229/(224229+59046)=79,15%. This brings nothing new in our previous analysis - we see increase as long position as short positon, but short grows faster and leads to growth of ratio. Growing open interest and short position confirms strength of bearish trend on EUR. At the same time CFTC ratio has not reached yet crucial ~82% level when probability of reversal or at least retracement increases significantly. In turn, this means that market still has some room. When ratio approaches 80-82% this becomes significant, because it means that almost all speculators stand short and nobody can sell more to support trend down. At the same time this does not mean that market can’t turn to retracement earlier.
In long term perspective our suggestion that EUR will stay under pressure for long time. Initially we’ve made this suggestion in November 2011. Do you remember this quarterly chart of US Dollar Index? This analysis still suggests further USD growth. On previous week there was significant ECB meeting that brings new colors to current balance. If we even will not take on recent rate cutting, Draghi has announced 1 Trln EUR QE program. It means that EU and US financial policy will go on opposite courses.
Currently first driving factor is US economy improvement. Macroeconomy suggests that when economy comes out from recession into growth – the first stage is “desinflation growth”. Economy shows improvement without jump in inflation. May be right now we are entering in this stage, at least most analysts point on obvious improvements in US economy and there are no doubts about it.
Combining these two moments makes me think that probably this is really first stage. Second stage will be “inflationary growth” – this is a period when Fed’s rate dancing will start. Probably we will see first bell of this when wages in US will start to grow that we do not see yet.Since we have at least 8-12 months when rate will not change.
At the same time, it seems that EUR will remain under pressure as Draghi confirms this, and we see some reasons for this as well. Even before Ukranian crisis EU has its own problems that press ECB keeps rate low and even apply clearly dovish rethoric. As EU has intiated sunctions against Russia this will hurt trade balance and negatively impact on EU. At the same time this is just small part of goods that Russia could forbid potentially and recent data on GDP of Germany, France, Italy shows slightly worse that expected numbers. Other words, mutual sanctions do not assume improvement in economy.
Reducing of export for EU countries will mean also unemployment growth, reducing of trade balance, GDP and budget income. In current situation this is not good, especially for new members of EU that are more sensible to economic negative situations and that were hurted stronger in 2008. At the same time EU still has its own problems, such as desinflation in major economies.
Besides, recent NATO meeting in Wales will totally put Europe in financial burden, since they call for increasing of military spending to 2% of GDP of each country. NATO was absolutely useless organisation in recent 20 years and now, when they have found phantom menace in Russia (after problems that EU and US have created by themselves), they finally has found sense to exist. US Military companies take 75% of all defense spendings and now European taxpayers and citizens will pay to US for approximately 2% of GDP annually. Hardly this will support EU economy.
All these facts make us think that EUR/USD will continue move south with moderate pace during the 8-12 months and even could accelearted when real hazard of US rate hiking will appear if any positive shifts in EU economy will not come. Depending on how external political atmospehre will change – we will gradually adjust our view.
Technical
So, situation on long-term chart enters in new stage. Trend is bearish here and market has broken below Yearly PS1. As a rule, moving below any PS1 suggests appearing of new bearish trend or continuation of existing one. Since we’re talking about yearly pivots, we mean that 2015 could stand under sign of bears. Market is not at oversold – it stands below 1.20. So from this point of view market has no limits to move down further.
Now about targets. Looks like right now EUR stands at 50% Fib support that it likes very much. Next support is 1.2787 – major 5/8 Fib level. But sooner or later it seems that market will gravitate to 0.618 extension of Huge AB=CD pattern at 1.2190 level. This probably will become our next long-term target. And finally, I’m not sure but looks like here we have 3 black crows pattern – I’ve marked it by numbers. If this is indeed so, then it proves of new bear trend and 1.2190 target seems not as fantastic as it looks right now.
B]Weekly[/B]
Weekly... This picture gives some very important issues. Here plot 50% level. Actually it coincides with MPS1. Has market broken it or not – difficult to say. At first glance price has moved below as 50% as Montly and Yearly PS1 rather deep. But from the other side the reason for that could stand with AB=CD 1.618 target. In general this area between Pivots, 50% Fib support and 1.618 target and oversold looks like solid support cluster. As recent NFP data was worse than expected – EUR has chances to show retracement up or at least it could be sideways action to exit out from oversold condition.
Second moment that is worthy of our attention is former K-support at 1.3230-3260 area. Take a look that market has passed through it by gap down without any respect like it does not exist at all. This issue could help us with potential upside target. The point is that very often when you see fast movement through strong support area – market very often returns right back and re-test it.
And finally what else could we watch here... I do not have 3x3 DMA on this chart but if you will draw it then you’ll see that recent move down is suitable for DiNapoli weekly DRPO or B&B. And weekly pattern has absolutely different scale and it could point us direction for some weeks if any pattern will be formed.
Thus, here we can make following conclusion: do not take any long-term short positions by far. Market may be will show minor spike down to touch AB=CD target but right downward action will be under question. Second – watch for patterns. Third – possible upward retracement target, if it will happen at all, stands at former K-support around 1.3230-1.3250 area.
Daily brings nothing really new to overall analysis, but adds some details. Thus, market is oversold here either, but here you can see that price slightly has not reached 1.618 target. We do not interesting much with first Fib resistance, because market at oversold. In fact we’re mostly interested with 2 K-resistance levels and particular with first one. The point is that this 1.3217-1.3243 level coincides not only with daily overbought, although this is also very important, but it matches weekly disrespected K-support area. Still as this miserable plunge down has happened just 2 sessions ago – market has no sufficient time to create some pattern or something. Thus, on daily we currently can’t make any conclusion whether upward action will happen, when it will happen and how it will start. We need to wait a bit, give market time to calm down shut down emotions and accommodate to new price area.
1-hour
It is not big sense to take a look at 4-hour chart right now, since there is just one big black bar. On hourly chart we could suggest appearing of some pattern that will be simultaneously reversal and that suggest some downward action. I’ve drawn a butterfly. Appearing of this pattern will be enough to complete AB-CD 1.618 daily target.
Conclusion:
Big picture on EUR has entered in new phase. It could turn so that our next target could be 1.21.
In shorter-term perspective we should forget about taking short position, since EUR is oversold as on daily as on weekly chart. This moment significantly increases appearing of retracement up, especially after shyer NFP numbers. Most probable destination of retracement is an area around 1.3220-1.3240. Thus, on coming week, we should watch for reaching of AB=CD target first and second – appearing of any reversal patterns.
The technical portion of Sive's analysis owes a great deal to Joe DiNapoli's methods, and uses a number of Joe's proprietary indicators. Please note that Sive's analysis is his own view of the market and is not endorsed by Joe DiNapoli or any related companies.
Last edited: