Sive Morten
Special Consultant to the FPA
- Messages
- 18,695
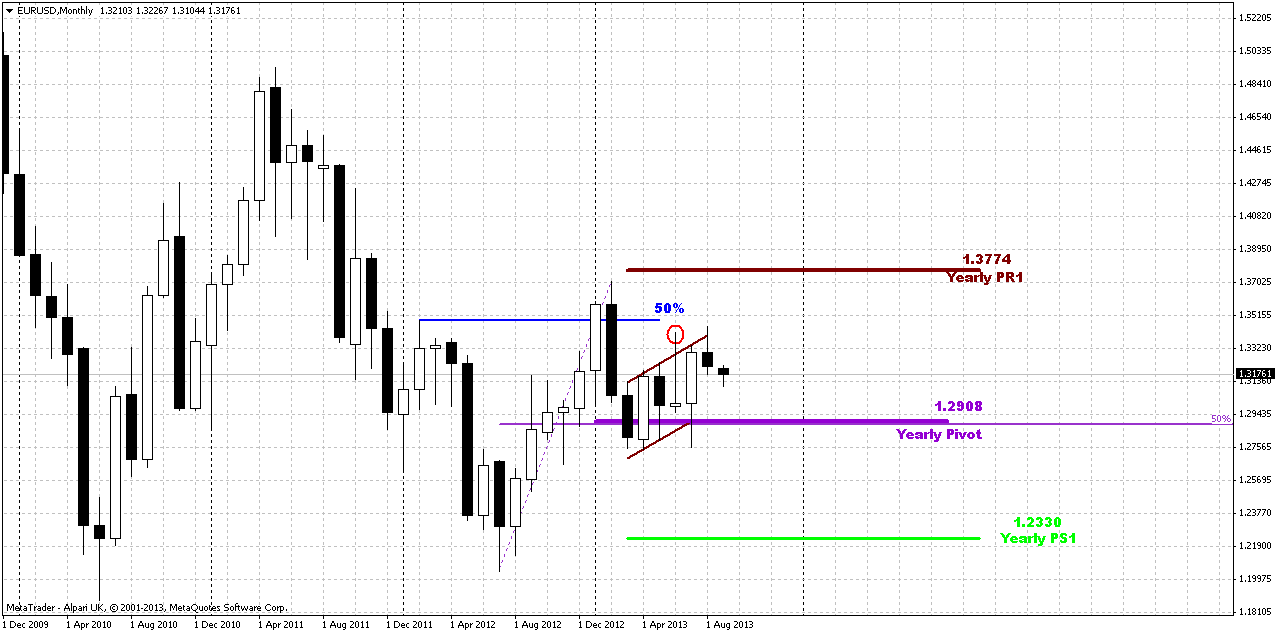
Monthly
On passed week market has continued gradual move down and as August candle has closed – it took the shape of failure upward breakout again and W&R of previous highs. With uncertainty around Syria it is difficult to suggest what will happen, but by taking a look at previous action we could make a conclusion that market should return right back to 1.29 area again. At least when market has failed to pass through upper border of current consolidation it has turned in opposite direction and reached other border of consolidation. May be this will happen again. On Monday there will be Congress voting on Syria strike and price action on passed week was mixed, especially after weaker NFP release. Still, major impact on USD was not due August data but due revising of July data down for ~60K employment.
At the same time all this stuff has not hit significantly our longer term analysis and mostly it remains the same, since market still stands inside flag consolidation. As we’ve said earlier, further direction will mostly depend on breakout. As a result, we could get either AB=CD down in area of yearly pivot support 1 or significant upward continuation. Yes, we have some bullish signs here – trend holds bullish, market has bounced up after testing yearly pivot point and that was not deep retracement after first challenge of 50% resistance, market has shown greater swing up, that has started in July 2012. All these moments are true, but direction will still depend on breakout, and it has failed in August. It means that we should be ready for some move inside the body of flag. As I’ve mentioned bullish signs here, I would like to point on single but significant bearish moment that could happen here. Usually when market shows reversal swing, it shows deeper retracement either, as a rule it takes a shape of some AB=CD. Thus, AB-CD action to the downside doesn’t seem unreal at all.
Weekly
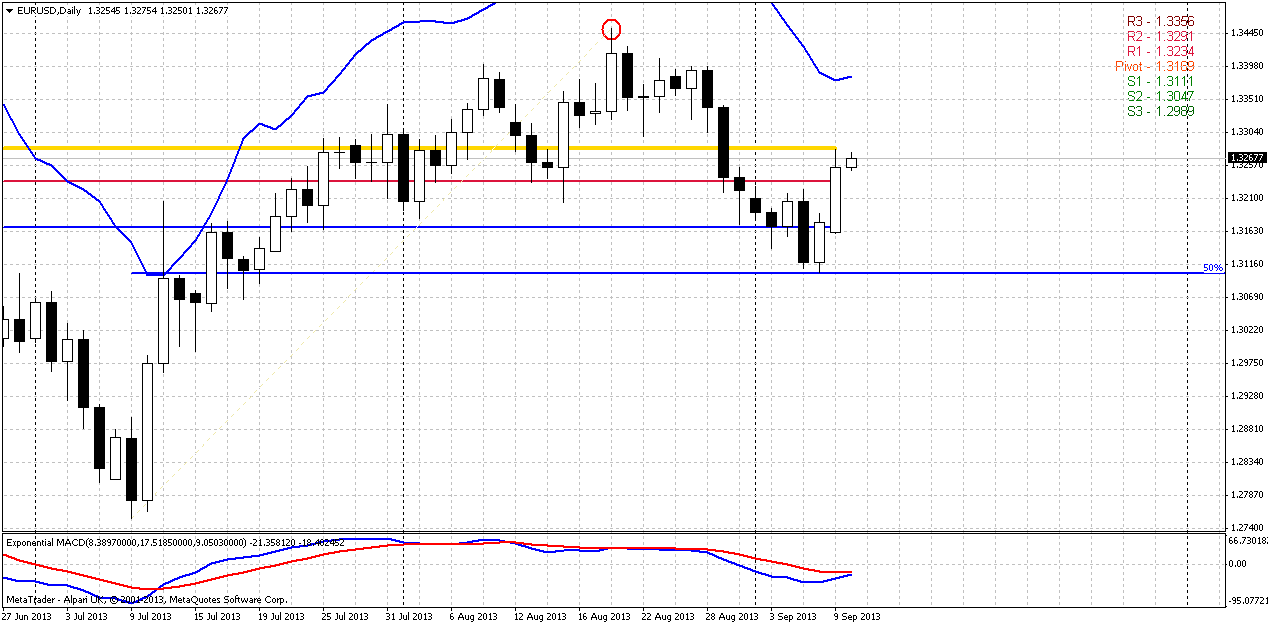
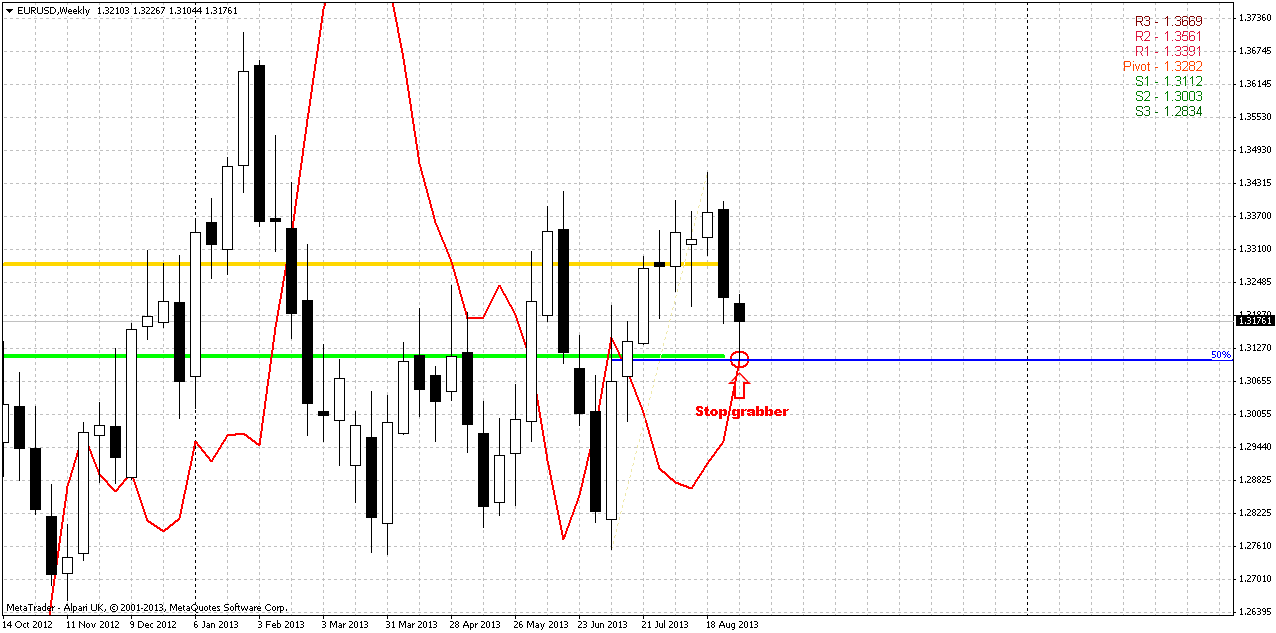
Guys, I find again and again that patience is a most valuable tool of trader and we do not have such issue as “missed the chance”. Sometimes on first glance it seems that all is lost and you’re out of the market if you wait, but in reality it could become a better chance. Here is again. On Friday we’ve said, that we do not have clear signals and patterns, market is coiling inside of support cluster and anything could happen. Thus, our recomendation was stay flat. Now we probably could get our patience prize. Just take a look what we have on weekly chart – bullish stop grabber right at 50% support (EUR prefferable level) and MPS1. What else do we need?
I think that additional comments here will be excessive, since you probably understand this setup well. I just add here that we have three major clues that will be difficult to overestimate. First is – we have direction and it’s up. Second – we know our working swing and invalidation point. This is a range of previous week and finally third – we know the target. This is previous highs that should be outcome due stop grabber nature – 1.3450 area. Really the royal gift from the market. Hope, that it will not fail (lol). Let’s see how we could play this situation...
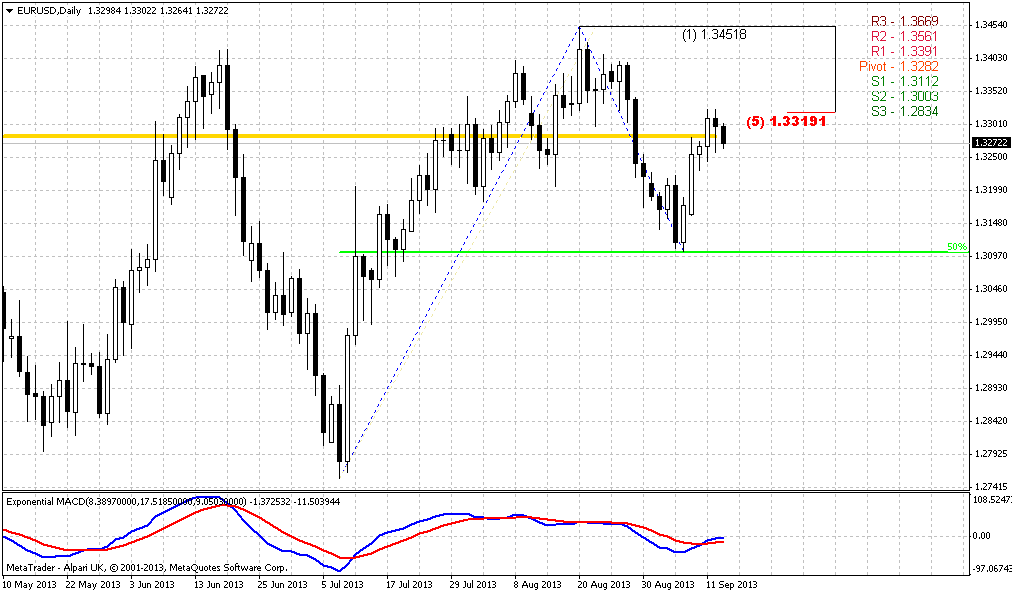
Daily
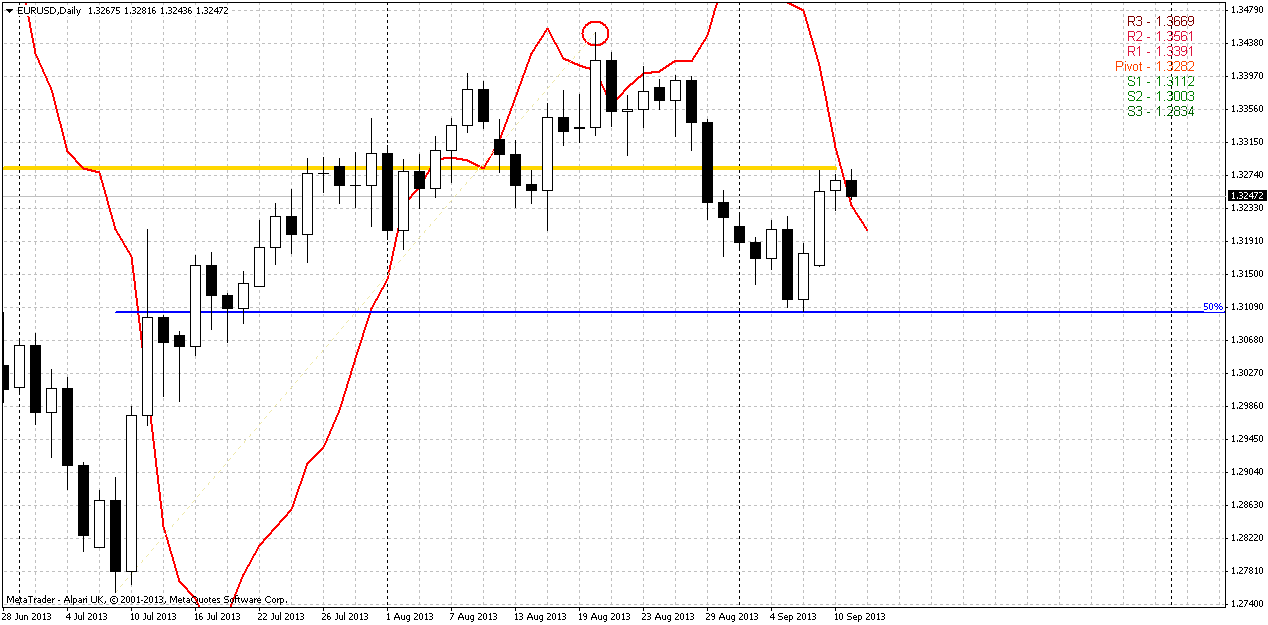
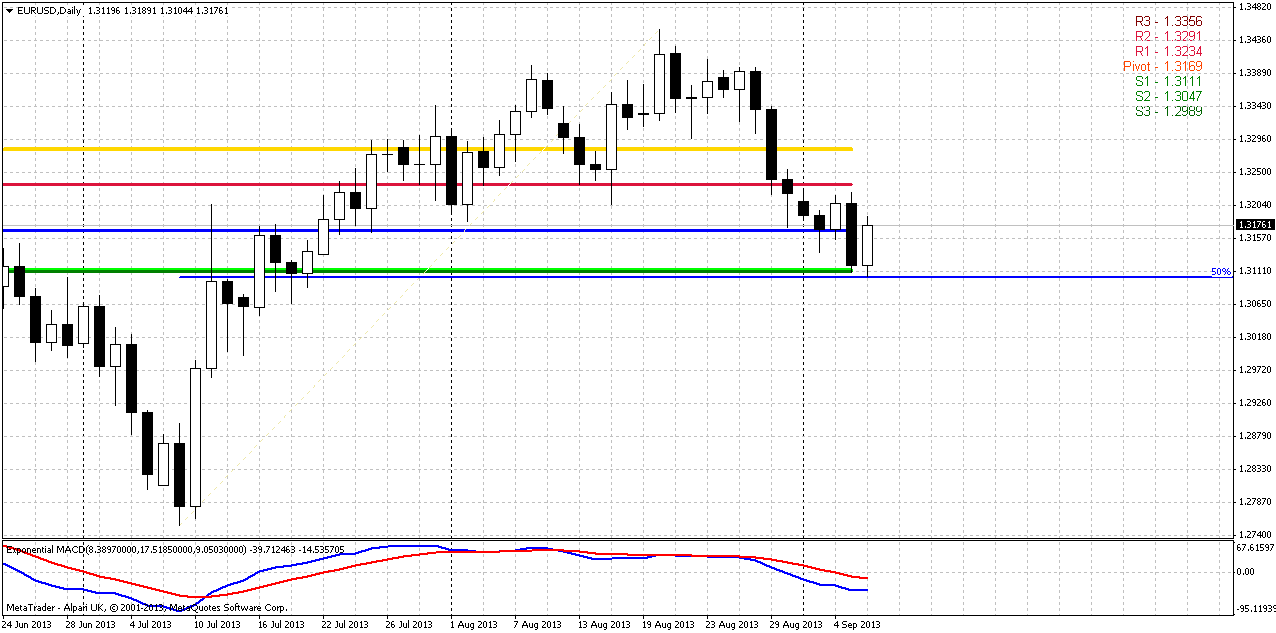
Well, daily chart is not very useful for us by far. Mostly because we already know the setup from weekly chart and here we do not have any additional information – now patterns, signals etc. Thus, here I just draw pivot points for coming week, I know that you watch for the numbers and want to make just minor note. Price probably will open around WPP. Within the coming week action around WPP and mostly MPR1 will have significant meaning for us. The point is since we expect extended move up, we prefer to get some confirmation from price action. One of these confirmations could become a breakout above MPR1. This will just prove us the serious of market intention to go higher. That’s why we probably will close monitor for weekly pivots on coming week. Second, there will be not a tragedy if market will show some bounce inside the body of weekly grabber pattern, even if this will happen below WPP. Our major point here is current low – it has to survive. Otherwise stop grabber will fail as the whole bullish setup, based on it. Later on the week, we surely want to see price move above WPP, no doubts.
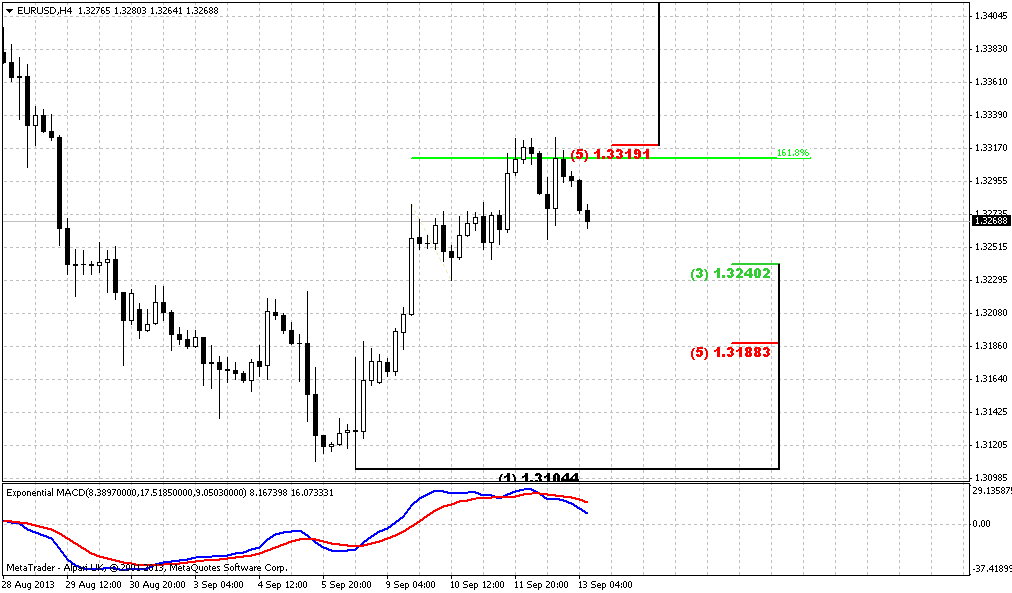
4-hour
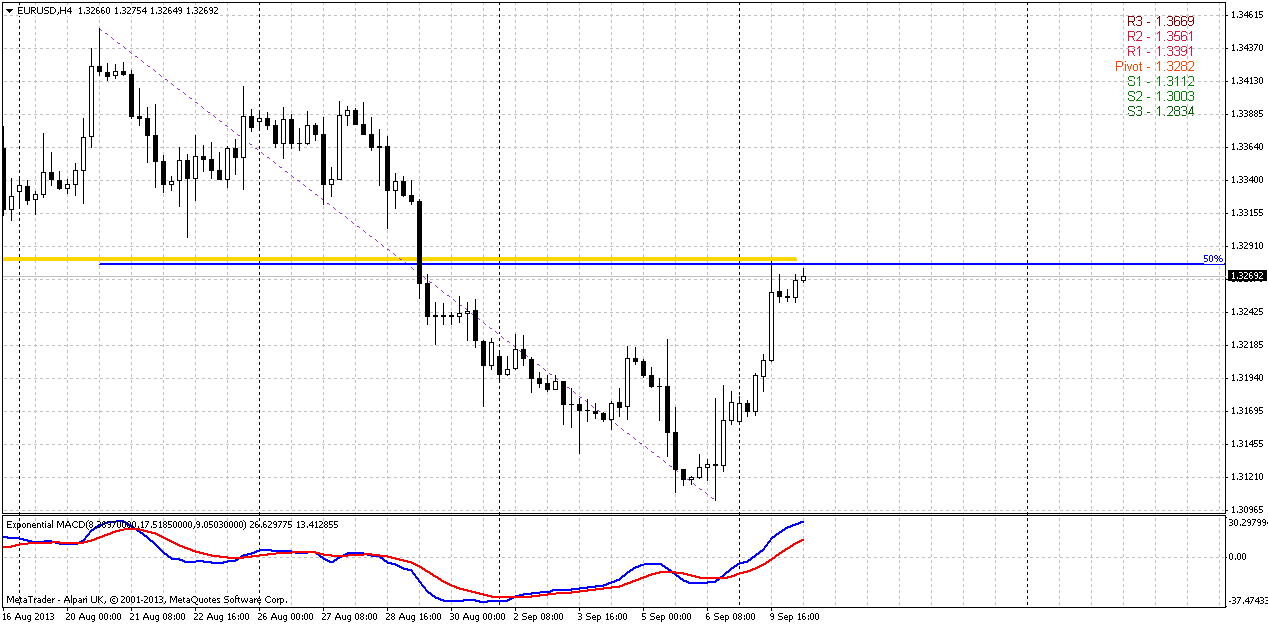
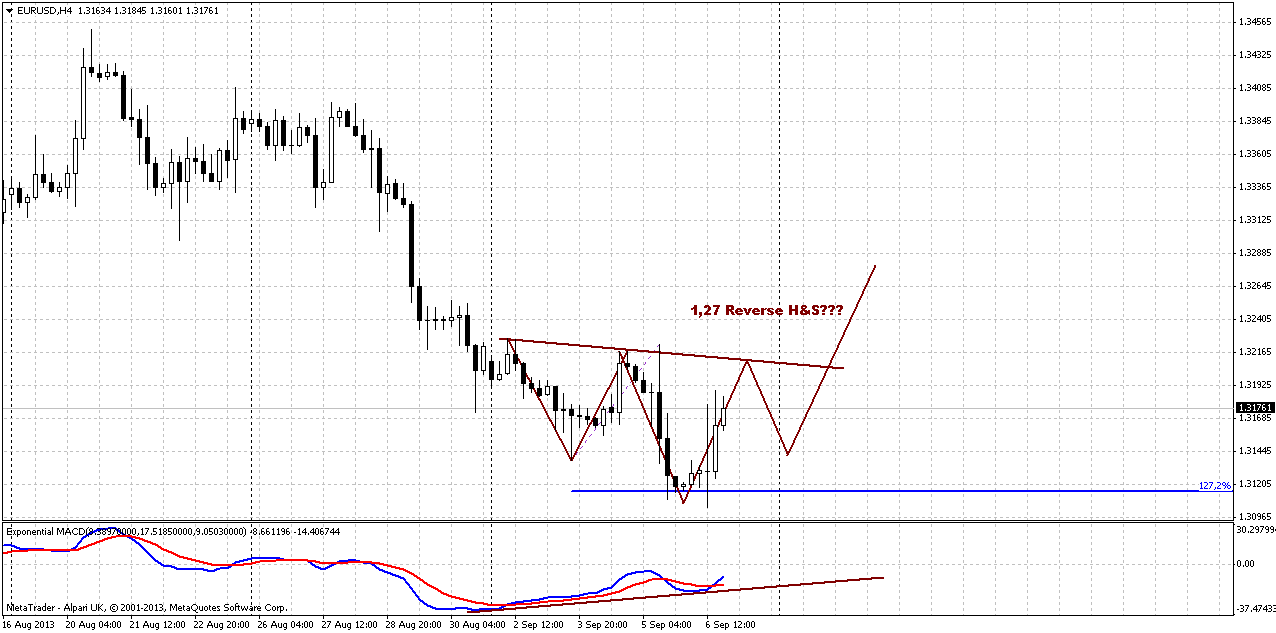
Finally we need last part of puzzle – reversal pattern and our entry. Trend has shifted bullish here. We have nice looking bullish divergence right at solid support. This is the kind of divergence that I like, since not any divergence has the same degree of relation and quality. And, guys, currently I see only one possible patterns and this is reverse 1.27 H&S. May be later we will get something different, but currently I do see nothing else.
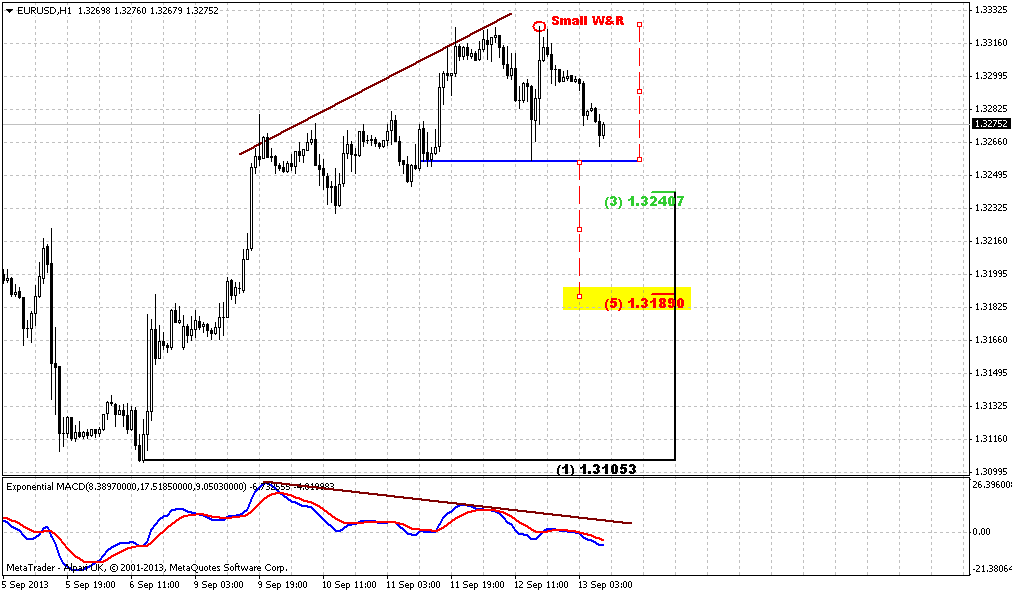
60-min
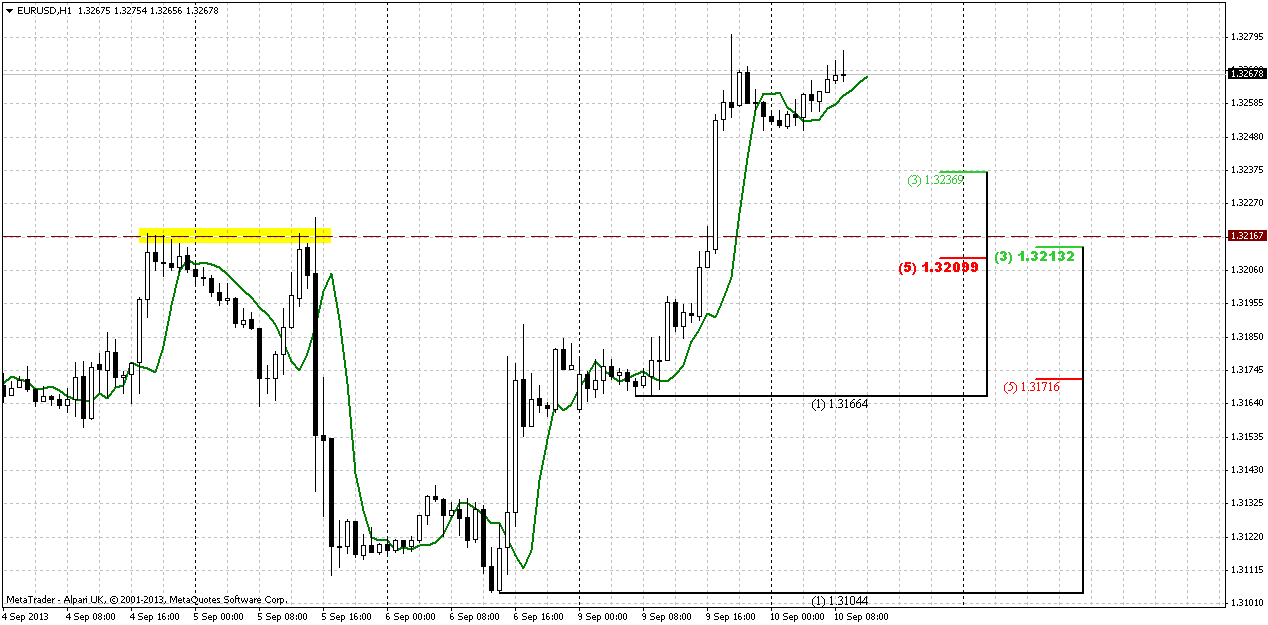
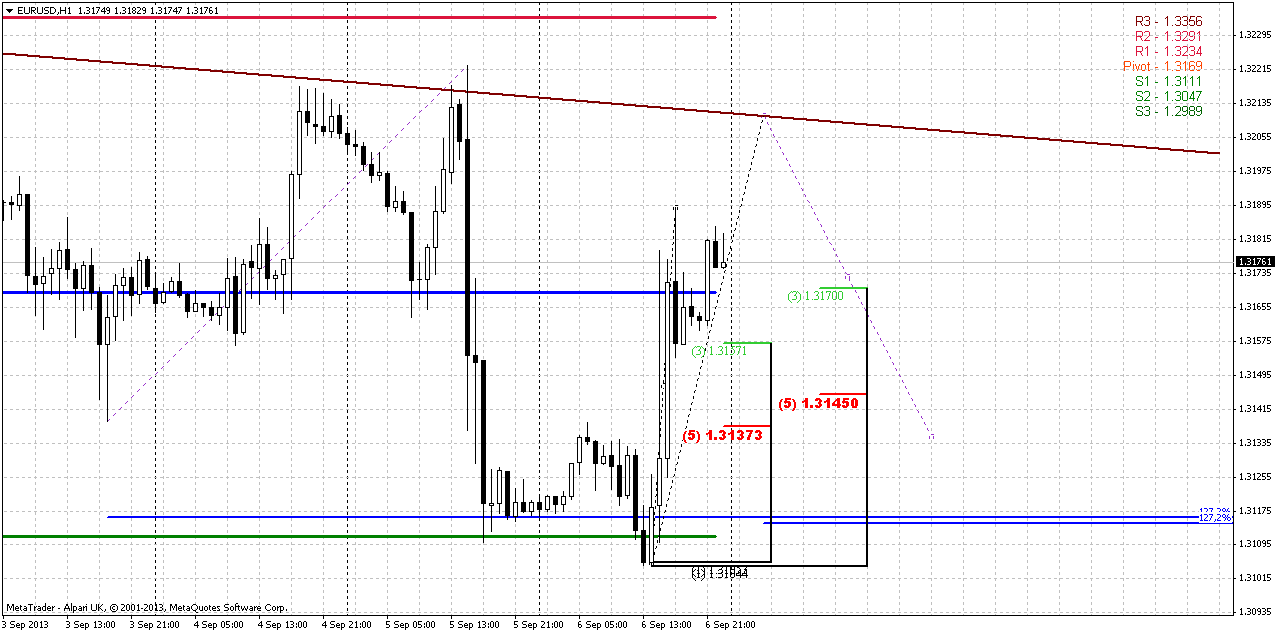
Here is the chart that needs some explanations, since I do not post such ones very often in researches. As we suggest that this could be H&S pattern, then some harmony of it should hold, I suppose. Thus, when market will reach neckline it should show some retracement down thus to match the right shoulder 1.27 to head, right? By current view it should be somewhere around 1.3135-1.3140 area.
Hence, we have two chances to take long position. Stop order will be the same – below the head. First chance is if market will show some retracement down right at the open on Moday. This is the first couple of Fib levels and it is based on real most recent swing up. This entry is prefferable, since you will be able to manage it as you want, if market will move up to the neckline.
Second chance is to enter when right shoulder will start to form. In this case we will keep an eye on second couple of Fib levels that is based on suggested swing up right to the neckline. Guys, do not follow this picture pips to pips – just follow the common sense. I just point here approximate trading plan. For example, market could move slightly higher or slightly lower than neckline drawn by me, price could retrace not right to 1.3135, but may be to 50% support around 1.3150. I suppose you’ve got the point.
But overall action and setup is very thrilling and definitely worthy of our attention. Let’s see what will happen. As beginning of the week carries a lot of surprises – do not be too stubborn in following with our pictures, keep your mind open. If, say, market will start to fall like a stone, this is not probably “deep” retracement, this probably a miserable plunge and it is not time to enter long. When reversal pattern is forming, we would like to see gradual movement.
Conclusion:
As on big picture market has failed to show upward breakout, this could lead price back to lower border of consolidation that stands around yearly pivot point and 1.29 area, since this is a common action in such situations. However, weekly chart has formed intriguing pattern that could change this practice. Weekly stop grabber will be our major object on coming week.
The technical portion of Sive's analysis owes a great deal to Joe DiNapoli's methods, and uses a number of Joe's proprietary indicators. Please note that Sive's analysis is his own view of the market and is not endorsed by Joe DiNapoli or any related companies.
On passed week market has continued gradual move down and as August candle has closed – it took the shape of failure upward breakout again and W&R of previous highs. With uncertainty around Syria it is difficult to suggest what will happen, but by taking a look at previous action we could make a conclusion that market should return right back to 1.29 area again. At least when market has failed to pass through upper border of current consolidation it has turned in opposite direction and reached other border of consolidation. May be this will happen again. On Monday there will be Congress voting on Syria strike and price action on passed week was mixed, especially after weaker NFP release. Still, major impact on USD was not due August data but due revising of July data down for ~60K employment.
At the same time all this stuff has not hit significantly our longer term analysis and mostly it remains the same, since market still stands inside flag consolidation. As we’ve said earlier, further direction will mostly depend on breakout. As a result, we could get either AB=CD down in area of yearly pivot support 1 or significant upward continuation. Yes, we have some bullish signs here – trend holds bullish, market has bounced up after testing yearly pivot point and that was not deep retracement after first challenge of 50% resistance, market has shown greater swing up, that has started in July 2012. All these moments are true, but direction will still depend on breakout, and it has failed in August. It means that we should be ready for some move inside the body of flag. As I’ve mentioned bullish signs here, I would like to point on single but significant bearish moment that could happen here. Usually when market shows reversal swing, it shows deeper retracement either, as a rule it takes a shape of some AB=CD. Thus, AB-CD action to the downside doesn’t seem unreal at all.
Weekly
Guys, I find again and again that patience is a most valuable tool of trader and we do not have such issue as “missed the chance”. Sometimes on first glance it seems that all is lost and you’re out of the market if you wait, but in reality it could become a better chance. Here is again. On Friday we’ve said, that we do not have clear signals and patterns, market is coiling inside of support cluster and anything could happen. Thus, our recomendation was stay flat. Now we probably could get our patience prize. Just take a look what we have on weekly chart – bullish stop grabber right at 50% support (EUR prefferable level) and MPS1. What else do we need?
I think that additional comments here will be excessive, since you probably understand this setup well. I just add here that we have three major clues that will be difficult to overestimate. First is – we have direction and it’s up. Second – we know our working swing and invalidation point. This is a range of previous week and finally third – we know the target. This is previous highs that should be outcome due stop grabber nature – 1.3450 area. Really the royal gift from the market. Hope, that it will not fail (lol). Let’s see how we could play this situation...
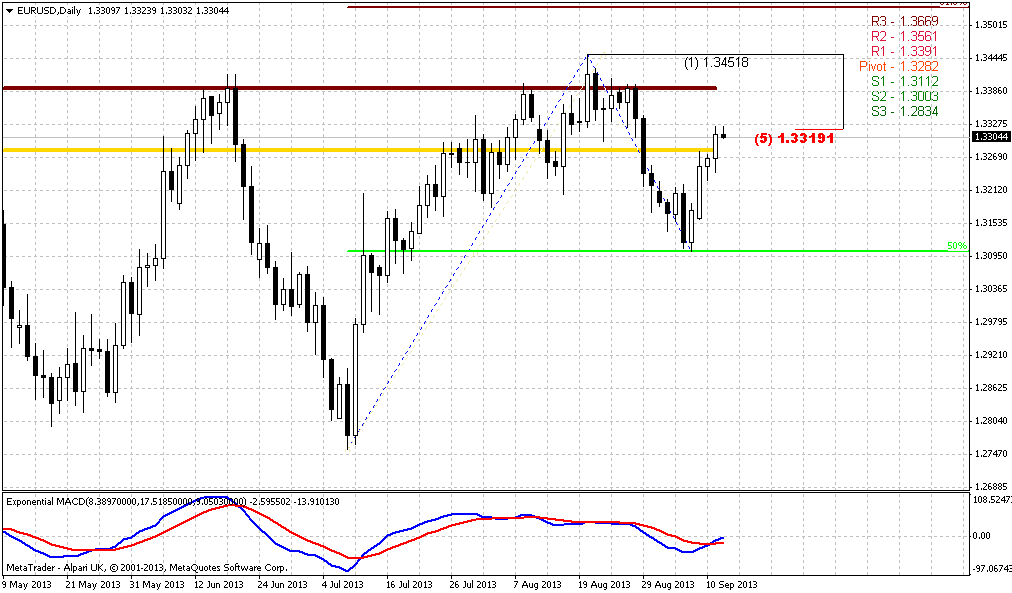
Daily
Well, daily chart is not very useful for us by far. Mostly because we already know the setup from weekly chart and here we do not have any additional information – now patterns, signals etc. Thus, here I just draw pivot points for coming week, I know that you watch for the numbers and want to make just minor note. Price probably will open around WPP. Within the coming week action around WPP and mostly MPR1 will have significant meaning for us. The point is since we expect extended move up, we prefer to get some confirmation from price action. One of these confirmations could become a breakout above MPR1. This will just prove us the serious of market intention to go higher. That’s why we probably will close monitor for weekly pivots on coming week. Second, there will be not a tragedy if market will show some bounce inside the body of weekly grabber pattern, even if this will happen below WPP. Our major point here is current low – it has to survive. Otherwise stop grabber will fail as the whole bullish setup, based on it. Later on the week, we surely want to see price move above WPP, no doubts.
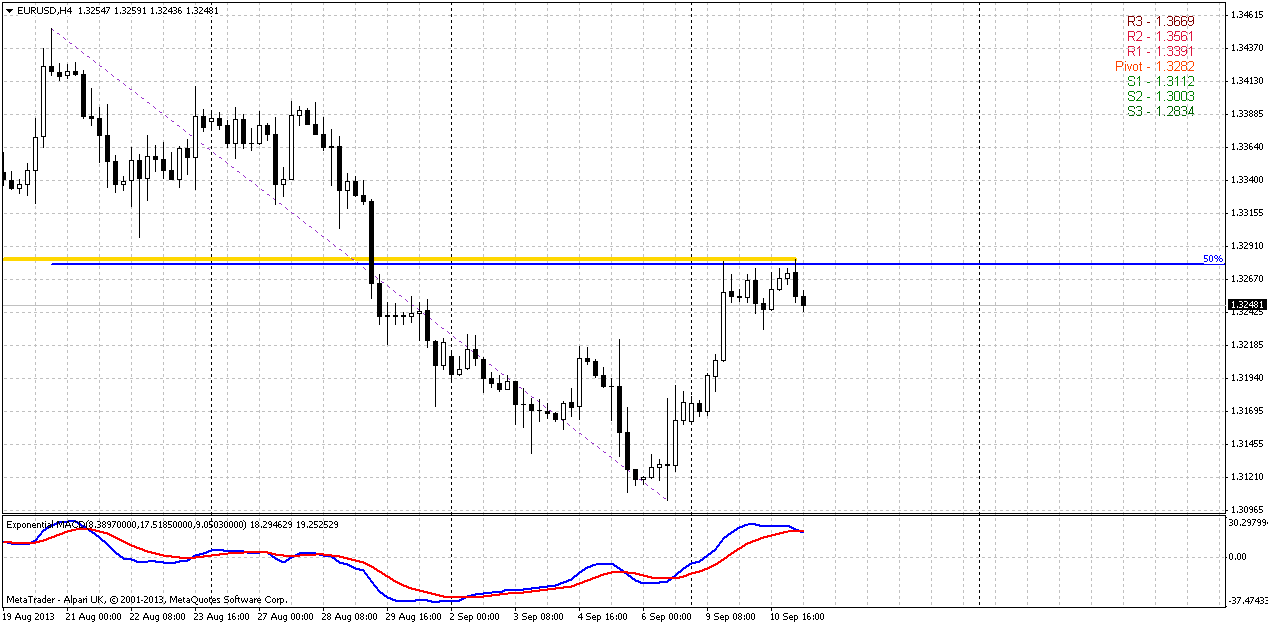
4-hour
Finally we need last part of puzzle – reversal pattern and our entry. Trend has shifted bullish here. We have nice looking bullish divergence right at solid support. This is the kind of divergence that I like, since not any divergence has the same degree of relation and quality. And, guys, currently I see only one possible patterns and this is reverse 1.27 H&S. May be later we will get something different, but currently I do see nothing else.
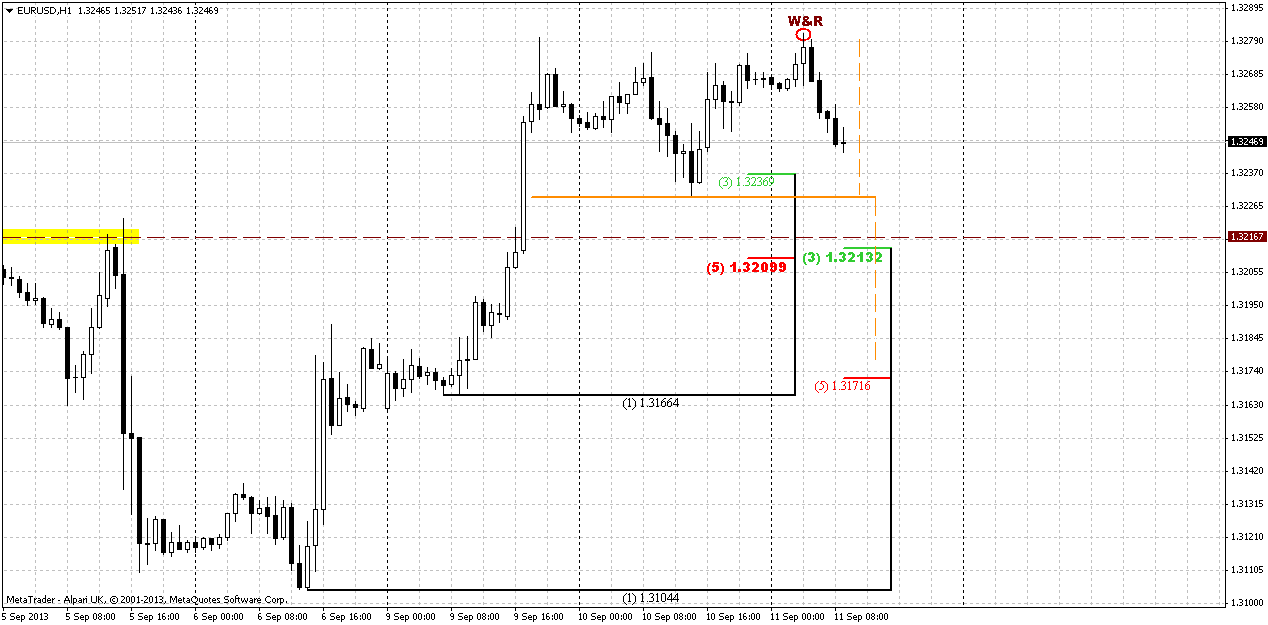
60-min
Here is the chart that needs some explanations, since I do not post such ones very often in researches. As we suggest that this could be H&S pattern, then some harmony of it should hold, I suppose. Thus, when market will reach neckline it should show some retracement down thus to match the right shoulder 1.27 to head, right? By current view it should be somewhere around 1.3135-1.3140 area.
Hence, we have two chances to take long position. Stop order will be the same – below the head. First chance is if market will show some retracement down right at the open on Moday. This is the first couple of Fib levels and it is based on real most recent swing up. This entry is prefferable, since you will be able to manage it as you want, if market will move up to the neckline.
Second chance is to enter when right shoulder will start to form. In this case we will keep an eye on second couple of Fib levels that is based on suggested swing up right to the neckline. Guys, do not follow this picture pips to pips – just follow the common sense. I just point here approximate trading plan. For example, market could move slightly higher or slightly lower than neckline drawn by me, price could retrace not right to 1.3135, but may be to 50% support around 1.3150. I suppose you’ve got the point.
But overall action and setup is very thrilling and definitely worthy of our attention. Let’s see what will happen. As beginning of the week carries a lot of surprises – do not be too stubborn in following with our pictures, keep your mind open. If, say, market will start to fall like a stone, this is not probably “deep” retracement, this probably a miserable plunge and it is not time to enter long. When reversal pattern is forming, we would like to see gradual movement.
Conclusion:
As on big picture market has failed to show upward breakout, this could lead price back to lower border of consolidation that stands around yearly pivot point and 1.29 area, since this is a common action in such situations. However, weekly chart has formed intriguing pattern that could change this practice. Weekly stop grabber will be our major object on coming week.
The technical portion of Sive's analysis owes a great deal to Joe DiNapoli's methods, and uses a number of Joe's proprietary indicators. Please note that Sive's analysis is his own view of the market and is not endorsed by Joe DiNapoli or any related companies.