Sive Morten
Special Consultant to the FPA
- Messages
- 18,644
Fundamentals
As we've mentioned last time - the major long-term driving factors are set. Fed has provided clarity last month on long-term policy, ECB position is relatively clear also as well as approximate situation of EU and US economies. The combination of these factors mostly supports downside trend of EUR/USD, as least as it seems right now.
This week, we've got just few elements of overall picture - statistics. In our daily reports we mention two major numbers - EU GDP and US NFP of course. EU GDP was released neutral, according to expectation. So, the possible negative surprise that we were worry on, has not happened. YoY numbers was even 0.1 better than expected. As a result - almost no effect on the market.
NFP numbers were a bit more complicated. At first glance - numbers were worse as it was definite lag to expected levels. But, as we talked about it many times already -take a look at unemployment rate. It is just 3.7%. Employment market is highly saturated and economy can't generate every month 100K+ new jobs.
High participation rate tells that US has no big problems with employment, and here we need to take in consideration very important indicator - wage inflation. It has increased as on YoY as on MoM basis for 0.1 and was better than expected. Yearly wage inflation now is 3.2%. This is the reason guys, why we think that Fed will avoid massive rate cut. So my view is overall NFP report was good, preventing Fed from too often rate cut, and supportive to USD.
Still Reuters reports that dollar was marginally lower on Friday against a basket of currencies, holding above a one-week low as a mixed report on the U.S. jobs market in August reinforced the view of a slowing expansion and chances of more interest rate cuts from the Federal Reserve.
Fed Chair Jerome Powell did little to ruffle those expectations. At an overseas event on Friday, he cited risks in particular U.S.-China trade tensions that may derail the current U.S. economic expansion, which is the longest one on record.
“The jobs data were sufficiently mixed,” said Marc Chandler, chief market strategist at Bannockburn Global Forex LLC in New York. “The market is not going to change its view of a rate cut later in September.”
The U.S. Labor Department said domestic employers hired 130,000 workers in August, fewer than the 158,000 forecast among economists polled by Reuters, while hourly wages grew 0.4% last month, a tad faster than the 0.3% increase projected by analysts.
Interest rate futures still implied traders positioned for a quarter-point rate decrease at the Fed’s Sept. 17-18 policy meeting, according to CME Group’s FedWatch program.
“We are going to act as appropriate to sustain the expansion,” said Powell on a panel in Zurich.
“The Fed will keep the record long expansion going with future rate cuts as significant risks to the outlook will warrant further accommodation,” said Edward Moya, senior market analyst at OANDA in New York.
The greenback lost ground against its rivals as global tensions receded this week, most notably with China and the United States agreeing to high-level trade talks in October.
Safe-haven bids for the dollar also abated in response to political opposition to a “no-deal” Brexit and Hong Kong leader Carrie Lam’s withdrawal of an expedition bill that triggered months of violent protests.
Still, global tensions have not dissipated, so there remain some underlying bids for the dollar and yen, analysts said. Meanwhile, riskier currencies are looking at weekly gains with improved investor sentiment.
Although it is mentioned above that investors supposedly oriented on new rate cut by the Fed, the data shows that probability of rate cut has dropped slightly. This is probabilities for December meeting and expected rate change. You can see minor odds drop that rate will be 1.25% and increasing that it remains in 1.5-1.75% range. Changes are small, but at the same time they do not show increasing of dovish sentiment. I would say the opposite.

Source: cmegroup.com
Second is, recent CFTC report. It shows increasing of net short positions on EUR, which also doesn't correspond to idea of rising dovish expectations:

Source: cftc.gov
Charting by Investing.com
Thus, mass media news could write anything but statistics is a stubborn thing and it shows the opposite - markets doesn't show any sign of dovish sentiment growth by far. In general recent NFP report doesn't break the major tendency and stands in a row with our long-term view on EUR/USD rate and support Fed's careful policy, avoiding any dovish cycle.
Technicals
Monthly
Technically market also shows no big shifts. The bearish engulfing pattern that we've mentioned here, is not exhausted yet and has some downside potential. As we've expected market hits YPS1 at 1.0950 and shows normal pullback after first touch.
So, in shorter-term we keep moving with bearish engulfing pattern here. September range is too small by far and makes no impact on overall picture. Actually, here we could recognize downside narrow channel and market stands accurately inside of it.
In longer-term view, take a look that EUR stands for a long time below upper border of rectangle, while normally, bullish market has to jump up after re-testing it. Dropping back inside rectangle and standing there, although near the border, is a sign of weakness. Besides, neither big support nor oversold levels stand around and it is free space till 1.03 lows. The only support is YPS1 where market stands right now.
View attachment 44258
Weekly
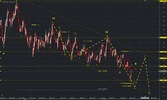
Although last week action was strong and showed tale close, this week data has not enough power to complete the breakout and price holds inside the channel by far, despite breakout of major 5/8 Fib support
Technically previous upward action was reaction on COP target, and downside action that we see right now should be continuation of major tendency to the next target, which is OP at 1.05 area. Now downward action is held by Yearly Pivot Support 1. Once response will be over, we will keep an eye on downside continuation.

Daily
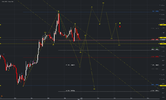
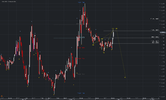
On daily chart in fact, we have the same setup as on Friday. Despite a lot of statistics, volatility was not too strong and our bearish grabber is still valid. As we've said - the background that has triggered upside action last week looks artificial and mostly emotional. Recent data, as we've estimated, also doesn't bring support to dovish sentiment.
Market failed to break 5/8 resistance and MPP. So, while our grabber is valid, we keep this scenario intact of possible downside reversal, although technically it doesn't look very probable. To erase this short-term setup EUR just need to continue upside action and erase the grabber.

Intraday
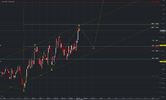
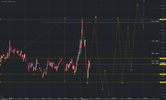
On 4H chart market still stands around K-resistance. First challenge was not successful. Here we do not have any specific patterns and mostly will keep an eye on the levels:

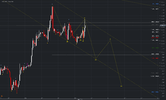
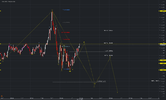
On 1H chart our major point is recent top, as the crucial level for daily grabber. On Friday's action market indeed has reached 5/8 Fib level, so those who have taken short position now could move stops to breakeven.
For others - since we do not have clear patterns here, there are two ways how to trade this setup. In general, it is possible to use Stop "Sell" entry order around WPP, when market start breaking the lows. Second way - wait for breakout and then try to take position on retracement.
For bulls - it would be better to wait grabber erasing and upside jump above the tops and daily K-resistance area.

Conclusion:
Despite a lot of data and talks around recent events - overall situation barely has changed. The tasks that we will decide on coming week are mostly tactical. In particular, whether this recent activity will live for another week and market still will show upside leg, or it will be extremely short-term and we will get downside continuation. The cornerstone of the answer is bearish grabber that we have on daily chart. We will use it as indicator of next direction.
The technical portion of Sive's analysis owes a great deal to Joe DiNapoli's methods, and uses a number of Joe's proprietary indicators. Please note that Sive's analysis is his own view of the market and is not endorsed by Joe DiNapoli or any related companies.
As we've mentioned last time - the major long-term driving factors are set. Fed has provided clarity last month on long-term policy, ECB position is relatively clear also as well as approximate situation of EU and US economies. The combination of these factors mostly supports downside trend of EUR/USD, as least as it seems right now.
This week, we've got just few elements of overall picture - statistics. In our daily reports we mention two major numbers - EU GDP and US NFP of course. EU GDP was released neutral, according to expectation. So, the possible negative surprise that we were worry on, has not happened. YoY numbers was even 0.1 better than expected. As a result - almost no effect on the market.
NFP numbers were a bit more complicated. At first glance - numbers were worse as it was definite lag to expected levels. But, as we talked about it many times already -take a look at unemployment rate. It is just 3.7%. Employment market is highly saturated and economy can't generate every month 100K+ new jobs.
High participation rate tells that US has no big problems with employment, and here we need to take in consideration very important indicator - wage inflation. It has increased as on YoY as on MoM basis for 0.1 and was better than expected. Yearly wage inflation now is 3.2%. This is the reason guys, why we think that Fed will avoid massive rate cut. So my view is overall NFP report was good, preventing Fed from too often rate cut, and supportive to USD.
Still Reuters reports that dollar was marginally lower on Friday against a basket of currencies, holding above a one-week low as a mixed report on the U.S. jobs market in August reinforced the view of a slowing expansion and chances of more interest rate cuts from the Federal Reserve.
Fed Chair Jerome Powell did little to ruffle those expectations. At an overseas event on Friday, he cited risks in particular U.S.-China trade tensions that may derail the current U.S. economic expansion, which is the longest one on record.
“The jobs data were sufficiently mixed,” said Marc Chandler, chief market strategist at Bannockburn Global Forex LLC in New York. “The market is not going to change its view of a rate cut later in September.”
The U.S. Labor Department said domestic employers hired 130,000 workers in August, fewer than the 158,000 forecast among economists polled by Reuters, while hourly wages grew 0.4% last month, a tad faster than the 0.3% increase projected by analysts.
Interest rate futures still implied traders positioned for a quarter-point rate decrease at the Fed’s Sept. 17-18 policy meeting, according to CME Group’s FedWatch program.
“We are going to act as appropriate to sustain the expansion,” said Powell on a panel in Zurich.
“The Fed will keep the record long expansion going with future rate cuts as significant risks to the outlook will warrant further accommodation,” said Edward Moya, senior market analyst at OANDA in New York.
The greenback lost ground against its rivals as global tensions receded this week, most notably with China and the United States agreeing to high-level trade talks in October.
Safe-haven bids for the dollar also abated in response to political opposition to a “no-deal” Brexit and Hong Kong leader Carrie Lam’s withdrawal of an expedition bill that triggered months of violent protests.
Still, global tensions have not dissipated, so there remain some underlying bids for the dollar and yen, analysts said. Meanwhile, riskier currencies are looking at weekly gains with improved investor sentiment.
Although it is mentioned above that investors supposedly oriented on new rate cut by the Fed, the data shows that probability of rate cut has dropped slightly. This is probabilities for December meeting and expected rate change. You can see minor odds drop that rate will be 1.25% and increasing that it remains in 1.5-1.75% range. Changes are small, but at the same time they do not show increasing of dovish sentiment. I would say the opposite.
Source: cmegroup.com
Second is, recent CFTC report. It shows increasing of net short positions on EUR, which also doesn't correspond to idea of rising dovish expectations:
Source: cftc.gov
Charting by Investing.com
Thus, mass media news could write anything but statistics is a stubborn thing and it shows the opposite - markets doesn't show any sign of dovish sentiment growth by far. In general recent NFP report doesn't break the major tendency and stands in a row with our long-term view on EUR/USD rate and support Fed's careful policy, avoiding any dovish cycle.
Technicals
Monthly
Technically market also shows no big shifts. The bearish engulfing pattern that we've mentioned here, is not exhausted yet and has some downside potential. As we've expected market hits YPS1 at 1.0950 and shows normal pullback after first touch.
So, in shorter-term we keep moving with bearish engulfing pattern here. September range is too small by far and makes no impact on overall picture. Actually, here we could recognize downside narrow channel and market stands accurately inside of it.
In longer-term view, take a look that EUR stands for a long time below upper border of rectangle, while normally, bullish market has to jump up after re-testing it. Dropping back inside rectangle and standing there, although near the border, is a sign of weakness. Besides, neither big support nor oversold levels stand around and it is free space till 1.03 lows. The only support is YPS1 where market stands right now.
View attachment 44258
Weekly
Although last week action was strong and showed tale close, this week data has not enough power to complete the breakout and price holds inside the channel by far, despite breakout of major 5/8 Fib support
Technically previous upward action was reaction on COP target, and downside action that we see right now should be continuation of major tendency to the next target, which is OP at 1.05 area. Now downward action is held by Yearly Pivot Support 1. Once response will be over, we will keep an eye on downside continuation.
Daily
On daily chart in fact, we have the same setup as on Friday. Despite a lot of statistics, volatility was not too strong and our bearish grabber is still valid. As we've said - the background that has triggered upside action last week looks artificial and mostly emotional. Recent data, as we've estimated, also doesn't bring support to dovish sentiment.
Market failed to break 5/8 resistance and MPP. So, while our grabber is valid, we keep this scenario intact of possible downside reversal, although technically it doesn't look very probable. To erase this short-term setup EUR just need to continue upside action and erase the grabber.
Intraday
On 4H chart market still stands around K-resistance. First challenge was not successful. Here we do not have any specific patterns and mostly will keep an eye on the levels:
On 1H chart our major point is recent top, as the crucial level for daily grabber. On Friday's action market indeed has reached 5/8 Fib level, so those who have taken short position now could move stops to breakeven.
For others - since we do not have clear patterns here, there are two ways how to trade this setup. In general, it is possible to use Stop "Sell" entry order around WPP, when market start breaking the lows. Second way - wait for breakout and then try to take position on retracement.
For bulls - it would be better to wait grabber erasing and upside jump above the tops and daily K-resistance area.
Conclusion:
Despite a lot of data and talks around recent events - overall situation barely has changed. The tasks that we will decide on coming week are mostly tactical. In particular, whether this recent activity will live for another week and market still will show upside leg, or it will be extremely short-term and we will get downside continuation. The cornerstone of the answer is bearish grabber that we have on daily chart. We will use it as indicator of next direction.
The technical portion of Sive's analysis owes a great deal to Joe DiNapoli's methods, and uses a number of Joe's proprietary indicators. Please note that Sive's analysis is his own view of the market and is not endorsed by Joe DiNapoli or any related companies.