Global Prime: Daily Market Digest

Hi all,

Find my latest market thoughts (all charts in the link)

Also, find the recap in video format


Market Thoughts Sept 28: USD Strength Assisted By Italy, Month & Quarter-End Flows


Key Themes at Play in the Forex Market:


  • The market transitioned from the FOMC into its new focal point, the Italian budget deficit. From very early in the European session, a clear clash of views over the spending targets by the Italian coalition government led to a major sell-off in the Euro that lasted until the very last minutes of NY.
  • It was this broad-based weakness in the shared-currency and assisted by other flow-related factors, that benefited the USD throughout as the top performer. In the Italian conundrum, the Deputy PM Di Maio eventually reported that the government had reached an agreement on a 2.4% deficit GDP target for 2019, confirming the disappointment by the market and well manifested through EUR price action.
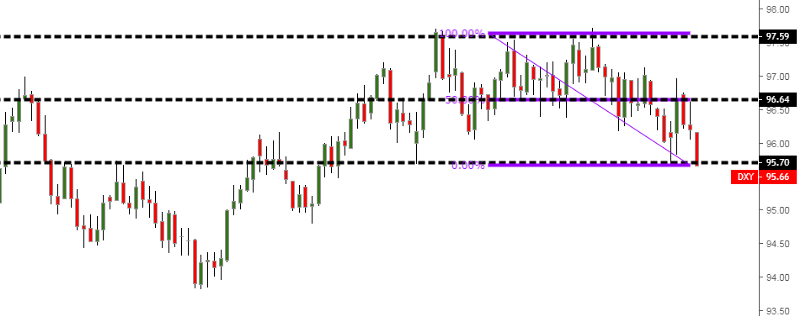
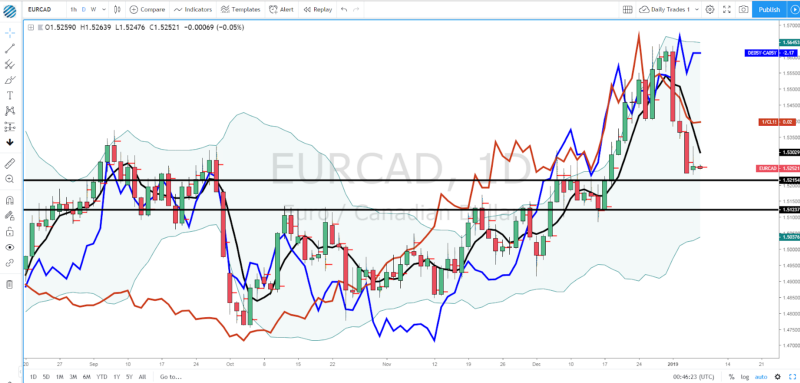
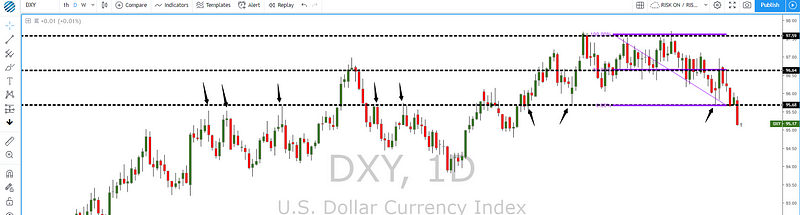
  • A quick look at the currency pairs leave no ambiguity, the USD stormed back with tremendous strength, as reflected by the 120 pips sell-off in the EUR/USD. The Sterling followed suit and if 1.3050 now gives in, the cracks in the daily bullish structure will be evident. Meanwhile, USD/JPY printed a very commanding bullish outside day, negating the FOMC’s bearish reaction; note, this move is in line with the pick up by large specs to play longs as per the latest CoT data.The Aussie was inevitably dragged towards 0.72, as was the Kiwi down to 0.68, while surprisingly, the Swiss Franc, which continues to behave strongly correlated to the Euro, had a terrible day, and we see USD/CHF now testing the 100dma. The Canadian Dollar put up a fight against the USD, rejecting 1.3050. Despite the USD strength, Oil held firm above 72.00, which comes in stark contrast with the performance of Gold, hitting a one month low. Global equities saw gains on Thursday, as the Nikkei 225 breaks above 24k, the DAX 30 printed a bullish outside day and is now retesting the 100dma, while SP500 recovered the FOMC-led losses, up +0.3%.
  • The moves in the USD today left me scratching my head, and I suppose this has to do with the juncture we found ourselves. The rolling into quarter and month-end led to a rebalancing of portfolios and when these readjustments occur, there is a risk for flows to play a role in market dynamics, leading to a temporary distortion of the usual behavior we are accustomed. Otherwise, the strength in the USD is hard to justify amid rising equities or the subdued performance by US bond yields.This is a time when foreign-denominated currency holders, the likes of banking institutions, must also hedge their exposure while in need to plan cash balance into year-end. This leads to lending being more restrictive (higher funding costs), resulting in cross-currency basis swaps to have an effect; this all underpins the USD too.
  • The most powerful approach that as traders we can tap into is to seek congruence between the price action and fundamentals, only when we merge them together, we can gain more clarity and conviction. And I must say that judging by the performance of the Italian stocks on Thursday, with the MIB up by over 1.3%, along with the Italian bond yield up a mere 5bp to 2.87% from 2.85%, I think the Italian budget saga is soon going to become a sideshow that markets are going to look past. Remember, earlier this week, I also stressed how the market had spoken via higher Chinese equities or a jump in risk appetite despite the cancellation of trade talks between the US and China, implying that Chinese vs US trade war has become a secondary focus for now.
  • There are many moving pieces, but I believe, the market is soon going to move away from the Italian budget impasse, as has done with China trade, and attention will quickly be moving back to fixed income, economic data, Brexit, and NAFTA to determine the next movements in capital flows and currency performances.
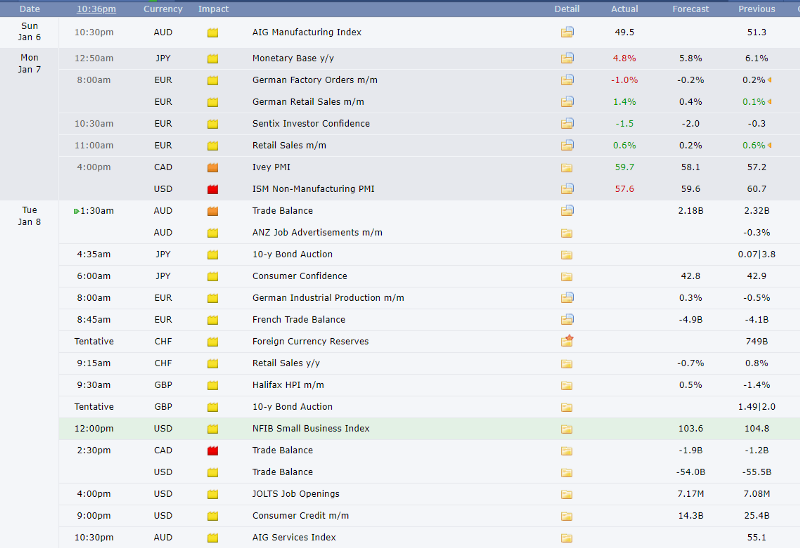
  • In the data front, we saw some mixed data out of the US on Thursday. The US final GDP came unchanged at 4.2%, while US durable goods orders left a bitter/sweet taste, with the headline number at 4.5% vs 2% exp, while the core figures dropped to 0.1% vs 0.4%. Other second-tier data in the US gave traders reason for optimism, even if the US trade balance got deeper into the red, which is only going to worsen the rhetoric between the US and other trading partners. When it comes to Europe, the German CPI printed a strong number, coming at an annual reading of 2.3%, which will undoubtedly support the notion that the ECB is slowly but surely preparing the markets for an exit of its QE era and moving into a tightening phase mid-2019.
  • On Brexit, there was an absence of fresh news in the negotiations. The fairly low volatility in the Sterling is a testament of that. The brinkmanship by UK and European politicians of trying to convince the other party about their own deal is a dangerous game currently at play. On Thursday, UK Foreign Minister Hunt reiterated that the chequers in the basis of any agreement, while EU’s Brexit negotiator Barnier keeps harping on the notion that they are still working with the goal in mind for an agreement with the UK to avoid a no deal.
  • The NAFTA negotiations between the Canadians and the American went on another day without any breakthrough. A comment by the Canadian PM Trudeau that it’s still very possible to get a good and fair deal allowed the Canadian Dollar to perform better on Thursday. Looking at the big picture, the currency has been punished, especially this week, as the negotiations look set to drag on for weeks potentially. For now, the market has been discounting both countries to meet the deadline of Sept 30. The hints one gets from Trump’s random bluster is not the most promising, as he recently noted that Canada has treated the US very badly in trade, adding that they are not getting along at all with Canada’s trade negotiators.
 
Find my latest market thoughts

Also, find the recap in video format


Market Thoughts Oct 1: Italy Weighs on the Euro as the Loonie Outperforms
icon_clock.png
Oct 1, 2018 10:11 am
Key Themes at Play in the Forex Market


  • Notwithstanding a round of sell-off into the month and quarter end, the USD ended on a strong footing last week, especially against the likes of the yen, Swiss franc, euro or pound. Less so against the oceanic currencies or the Canadian dollar. The latter has been boosted on the prospects of a NAFTA deal.
  • One aspect worth highlighting is the commanding bullish outside week on the DXY last week. While factors such as the month andquarter end flows were at play, price action is king and it definitely feels like a major victory by the bulls. The recovery in appeal by the USD comes on the heels of an FOMC last week that reinforced the notion of a hawkish stance short term. However, for the USD to further anchor its price action advantage, we now need to see a few scenarios play out. These include risk aversion conditions which lead to safe-haven bids, a renewed steepening of the US curve, orfurther pressure in Italian yields, and that alone by default may see the continuation of last week’s theme where market participants resort to the attractiveness of the USD as an alternative option. Also, one must keep a close eye on the 10-yr US yield and whether or not acceptance continues to be found at 3%, also key this week.
  • The situation in Italy remains very fluid, as Italy stick to its 2.4% budget deficit to GDP target. The country is flooded with high debt and this episode of defiance against the European Union won’t help. As a result, the Italian 10-yr bond yield, which has acted as a barometer, spiked to 3.12% last Friday, the highest levels since May, when fears of the populist government coming to power were at its peak. October 15th is the time to submit the budget to the European Union for review. One should expect both sides to play hardball but overall, the month of October is off to a rough start for the Euro and the prospects are not looking any better as long as Italy dominates the headlines. Keep an eye on the Italian yield as the ultimate gauge for the risks emanating from Italy. Also notice that unlike last Thursday, on Friday we saw Italian stocks sold aggressively, and that’s going to weight further on the negative sentiment in the Euro, as its evidence of a loss in confidence towards Italy. Remember, one of the extreme yet conceivable scenarios is for the populist government of Italy to threaten theEU with an exit of the EUR. I personally don’t see that happening at all, but the volatility it may cause could be quite damaging for the outlook of the Euro short term, even if that’s a debate for another time altogether.
  • The Canadian Dollar has received a trifecta of positive inputs all at once. An upbeat Canadian GDP reading last Friday, which came at 0.2% vs 0.1% exp, coupled with USD selling flows during the month and quarter end led to intense selling. The straw that broke the camel’s back as Asia open on Monday is the emergence of new reports that seem to suggest the US and Canada are very close to a NAFTA deal. If the latter is confirmed, the Canadian Dollar should see a wave of buying interest throughout the week, with the usual initial retracement as short-term momentum trader take profits, leading up to a temporary removal of liquidity, before the real money steps in to keep riding the trend.
  • A headline over the weekend by Fed’s Williams, which in a way has been the member endorsing the most the concept of neutral rates, confirmed that the Fed is moving away from utilizing neutral rates as a communication strategy. Williams said neutral rates is less relevant as policy normalizes. This is very much in line with Fed’s Powell position to simply adapt to economic data, and it somehow vindicates that the Fed can’t come to an agreement where the short term neutral setting stands.
  • Over the weekend, we saw the Chinese PMI figures missing out expectations. Both the Caixin and official headlines came on the soft side and as Caixin notes, after 15 months of expansion, export orders fell the fastest in over two years, suggesting U.S. tariffs are starting to take a toll on the economy’. Personally, I think we shouldn’t forget that even if US sanctions start to bite the Chinese, a lower Yuan has an offsetting effect. USDCNY broke above sept range. Overall damage from the trade conflict on China’s economy much less than 0.5% of GDP, even if the policy is not loosened again.
  • It’s worth highlighting the incredible resilience by the Sterling even as the negative headlines around Brexit keep pouring in. What this means is that if some progress is achieved or at least the perception of it, even if eventually carries little substance, the Sterling looks set to benefit. The positive headlines have been consistently giving buyers a greater bang for their buck, which has led to speculators recently bailing out of their perma bear view as the most recent COT illustrates. Back to the negative headlines, late last week, we learned that UK PM May is losing support from her own cabinet and that essentially makes her option of a no-deal brexit one teetering to collapse. As a reminder, that’s one card May can still play to threaten the EU in case, as it’s expected, the EU rejects the chequers proposal. May keeps saying that a no deal l is better than a bad deal” and that remains, as said, her only plan B as the convoluted state of the Brexit negotiations stand. Volatility in the Sterling is set to be dependent on a brexit headline by headline basis but at the same time, from this week, the focus will too be shifting towards the Tory party conference, which comes at a time of growing dispute between UK PM May and Boris Johnson.
  • Looking ahead, the key events for this week include: German retail sales, UK manuf (today) and services pmi, US ISM manuf (also today) and non-manuf PMI, Australia’s RBA policy decision and Australian retail sales, two speeches by Fed’s Powell, and the monthly job reports by the US and Canada. Don’t forget, the Chinese markets are closed the whole week.
 
Find my latest market thoughts

Also, find the recap in video format


Market Thoughts Oct 2: The Loonie Reigns Amid Resurgence In Risk

Key themes at play in the forex market


  • The week kicked off with a last minutenew and not so punchy USMCA trade agreement, effectively replacing the NAFTA deal, as the US and Canada finally found a compromise for what US President Trump termed a ‘win-win-win’ for all parties. From very early in the Asian session, the Canadian Dollar was the main beneficiary, building upon last Friday’s gains after an upbeat Canadian GDP number and with higher Oil prices also underpinning the CAD trend. The outperformance by the Canadian Dollar has led the USD/CAD to trade at a 4-month low.
  • The positive risk appetite was reflected via higher bond yields, buoyant equities and a mixed performance by the US Dollar. The fact that Italy continues to cast a shadow in the Euro led to further losses in EUR/USD, which under more normal circumstances, may have seen more resilience by the Euro. The symbiotic upward moves in equities and bond yields, including the steepening of the US yield curve in both measures, the 10y -3m (Fed’s favorite) and the 10y-2y, suggest a market still betting on the reflationary trade of higher growth and inflation, and when such context is in place, the USD tends to see limited flows as foreign capital finds more attractive alternatives.


  • It’s undeniable that the higher-than-expected Italian budget deficit at 2.4% has severely hit sentiment in the shared currency, with a lower-than-expected German retail sales reading on Monday (0.1% vs 0.4% exp) not helping either. As Credit Agricole emphasizes in a weekend note, “fears about a potential downgrade of the Italian sovereign rating and/or outlook next month or an escalation of the tensions between Italy and the European Commission are likely to keep investors cautious.”


  • The sharp losses in the Euro come on the back of a firmer inflation outlook by the ECB, as it keeps laying the ground for a transition from a QE era into a tightening of policies by around mid-2019. What this means is that sooner or later, once the Italian concerns fade out, buying cheap Euros may represent a decent opportunity as the divergence in monetary policies between the ECB and G10 FX Central Banks may narrow. For now, a point I keep reiterating is that it remains risky buying the EUR given the event risks ahead.


  • The recovery in risk appetite has also morphed into the outperformance of EM currencies vs the USD, with our prop EM currency index, which monitors 7 of the most relevant EM-linked currencies, down a full point at 68.00. The Indian Rupee, Indonesian Rupiah or Argentine Peso are the main laggards, but the index finds a respite from the gains seen via the Russian Ruble, the South African Rand or the Turkish Lira.


  • The release of Monday’s US ISM manufacturing index for Sept came at 59.8 vs 60.00. The snippets of information the report contained were highly interesting, as producers of various industries start to outline that the higher tariffs imposed to US products are taking a bite out of profitability and margin compressions. There are two significant risks for the US economy heading into 2019, one being the fiscal effect starting to fade by early next year, while at the same time, there are worries that business margins and hence the outlook for growth may be capped by the higher trading barriers imposed by China as retaliation to US trade policies.
  • Looking at the Pound, the ‘risk on’ lent support to the currency, while an off-the-cuff and potentially misplaced headline by Bloomberg reporting on the UK considering a compromise on the Irish backstop to reach a Brexit deal saw the currency spike through 1.31 before retracing all its gains. No other news agency reported on the sensitive topic of custom checks, and that led to the notion that the headline may not carry enough substance, especially since it wasn’t quoting any official name either. This week, a key focus when trading the Sterling must be on the UK Conservative party conference and to what extent UK PM May can find enough endorsement to reinforce her hard-line stance to stick with the Chequers’ Brexit plan.
  • Amid such an ebullient ‘risk on’ environment, the Japanese Yen was always set to suffer. By the end of NY, the USD/JPY reached another milestone by filling offers at the 114.00, where it found a temporary ceiling. The major bull run in the Nikkei 225, which has led to handsome gains in the pair through the Asian session since mid Sept, has undoubtedly been a contributing factor acting as an accelerant. As a reminder, the CoT data since mid-Sept continues to show large specs piling into shorts Yen.
  • Under renewed optimism, one would think the Aussie would see a solid performance, but the currency, along with the Kiwi, didn’t quite live up to the expectations despite the friendly risk environment. As a reminder, the RBA monetary policy is due today, with the neutral tone to prevail. During the first half of 2018 though, the Australian economic activity has remained firm, which should anchor the view that heading into mid/late 2019, it places the risks of a rate move to the upside vs previously feared lower rates. At the current level of around 72 cents, it provides support for trade balance and the overall economy. As long as fears over the consequences of a full-blown trade between China and the US remain on the backseat, which leads to stabilization on EM currencies, it should see a very solid interest for the Aussie to be bought on weakness.
 
Oct 3: EUR Down On Ballooning Italian Yields, Will Amazon Move Lead To More Hawkish Fed?
icon_clock.png
Oct 3, 2018 10:07 am
Key themes at play in the forex market:


The shine was taken away from risk appetite conditions on Tuesday. The strength in the Japanese Yen, which ended topping the climbers’ board is a testament to that, while the US Dollar and the Swiss Franc traded head to head disputing the second place. On the flip side, the Aussie found no underpinning factor from a largely neutral RBA monetary policy decision with some slightly dovish remarks on housing (“remains a source of uncertainty”), ending as the worst performing currency by breaking below the 0.72 level; the price of gold was catapulted higher, but it couldn’t help to stem the tide of selling pressure of the Aussie, as this time the yellow metal was driven by safe-haven bids rather than a function of USD weakness. Looking at Oil, notwithstanding the wave of ‘risk-off’ moves, it trades stubbornly high near $75, a 4 ½ year high, which continues to lent support to the CAD on the back of the reworked USMCA trade deal.

The Euro remains pressured as concerns over the Italian budget deficit reign, which led to ballooning Italian bond yields, upby a whopping 60bp from 2.82% to 3.41% in a matter of just one week. Nonetheless, the weekly area of support around the 1.15 has acted as a major sticky barrier and a rejection off the lows saw the EUR/USD end near the 1.1550 in a rebound that is far from impressive. It won’t be easy for bulls to take control as the context stands, one characterized by the return of risk aversion. Italian yields traded at the highest since mid-2014 and the German vs US yield spread knocked down further towards the -2.64%, which is a new trend low. The comments that really opened the can of worms and saw the implosion in Italian yields came courtesy of Italy’s Lega party economic chief Claudio Borghi, who said the country would solve its problems if it had its own currency, reminding investors the not so distant memory ghosts of the Greek financial crisis. The downward spiral in the Italian bonds is in part a response of the heightened risk that the Italian credit rating or outlook gets revised lower by Fitch or Moody’s in the near future, which may lead to a very difficult situation and a potential escalation with the European Union on the need to adjust deficit targets lower.


It’s also interesting to see the bearish cracks in the Sterling, finalizing the day below the 1.30 round number against the US Dollar despite UK Conservative politician Boris Johnson endorsed unity amongst the party to support UK PM May. However, some cold water was thrown, as expected, by expressing the well-telegraphed criticism towards the Brexit chequers plan. Another snippet of information we learned on Tuesday, which under different risk circumstances may have provided support to the Sterling is the report that UK PM May is prepared to limit trade deals by staying in the customs union. What this means is that May would limit Britain’s ability to agree on free trade deals after Brexit, with the clear aim of breaking the current deadlock with the EU.

The deterioration in risk barely budged equity traders over the appeal to buy into Tuesday’s weakness through Europe and the US, which led to the German DAX 30 and the S&P 500 to recover its early losses and end flat. In Asia, a different story played out, with the MSCI EM index, the Nikkei and the Hang Seng in Hong Kong coming under pressure. The US 30-yr bond yield traded down to 3.22% as capital flocked off from risky bets into US treasury bonds, while US corporate credit yields surged in response to a more uncertain environment, diverging off the more robust response seen in the S&P 500, and probably to do with the wave of selling seen in the Nasdaq, down by 1.4%. Our prop macro risk-weighted index, to be referenced as a form of barometer for risk conditions, is starting to show a bearish structure of lower lows on the hourly, trading sub the 100-HMA. It’s also worth noting how in EM, the Indonesian Rupiah is one of the currencies dragging the Asian complex lower. The currency trades at its worst levels since the 1997 Asian financial crisis, as it struggles to put its house in order amid higher Oil prices, a current account deficit, and higher USD-denominated debt to be serviced.

screenshot_20181003_074840.png


One of the news worth highlighting on Tuesday is the announcement by Amazon to raise the salaries to all its employees (250k+ full time and 100k+ seasonal) from as lows as $10 up to a new minimum threshold of $15, with the policy coming into effect on Nov 1st. Jeff Bezos, Amazon’s CEO and richest man in the world, encouraged competitors to follow their steps too. Moreover, the company will also be revising up salaries in the UK, while advocating for a campaign of higher Federal minimum wage. The implications of this move might be significant, as it occurs at a time of relatively high wage growth in the US (2.9% y/y), so this decision may add to the momentum and assist the US economy to generate a cycle of solid growth and inflation; the latter has been the puzzle of the last decade, that is, poor inflation at a time of very low employment rate and full capacity utilization. It’s precisely this symbiosis that Fed’s Powell needs to manage carefully. On Tuesday, the Fed Chairman gave a speech about the outlook for employment and inflation at the National Association for Business Economics, reiterating the balanced approach the Fed must take between not slowing down the economy by raising rates too quickly nor overinflating prices by the complacency of staying pat. The latest news from Amazon, all else being equal, does suggest risks skewed towards the latter, hence the continued gradual rise in rates to avoid runaway inflation, which as we know, has been well contained since the GFC. For now, the market continues to price a chance of about 75% that the Fed will raise again in December.

Heading into Wednesday, be reminded that the Chinese markets remain closed the entire week, while Germany will also go through a bank holiday today to celebrate the German Unity Day. In terms of risk events, in the UK we have the services PMI next, while in the US the ADP non-farm employment and ISM non-manuf PMI are due. Also note, several FOMC members are due to speak, including another intervention by Fed’s Chairman Powell.
 
The Daily Edge: The Global Slowdown Theme Cements On US ISM Big Miss

0*I8pGsSq8XSRyrlPF


The Daily Edge is authored by Ivan Delgado, Head of Market Research at Global Prime. The purpose of this content is to provide an assessment of the market conditions. The report takes an in-depth look of market dynamics, factoring in fundamentals, technicals, inter-market, futures and options, in order to determine daily biases and assist one’s decisions on a regular basis. Feel free to follow Ivan on Twitter& Youtube.

Summary — Jan 4, 2019

0*HBN_IIPGxCV_ES16


As we head into European trading, we find ourselves in an environment dominated by US Dollar weakness across the board courtesy of further evidence that the “global slow down” phenomenon is sinking in. The turnaround is a radical shift of dynamics from what just 24h ago in what’s been a very lively start of forex trading in 2019 due to the Yen flash surge.

The moves on Jan 3rd carry some important messages that should not be overlooked. First and foremost, it portrays the difficulty that any market will face finding any type of equilibrium when the rubber stretches as much as it did in the event of yesterday’s ‘flash crash’. Unless driven by a major geopolitical event such as the declaration of war or any other black swan-type occurrence, which wasn’t the case during the JPY crosses flash crash, the efficiency of a market will prevent the overextensions of the move to find sufficient players to maintain the overstretched equilibrium as seen.

However, and here is where the main message lies. In light of a US Dollar that ended the day weaker against most of its peers after a quantitative advantage in the hundreds of pips earlier on the day, we really need to question ourselves the outlook for the currency. The background noise in the form of a flattening US curve, 20bp of rate cuts discounted for 2020, the major miss on Thursday’s US ISM PMI sure will keep reverberating in Fed’s Powell head as the case to keep the path of further normalization weakens.

Onto the US ISM. It wasn’t just a mere drop, but it has significance for 2 key reasons. Firstly, it was the sharpest MoM contraction since 2008 (GFC era), and secondly, it makes the case of a dreaded global slowdown more palpable and believable if last year’s poster child (US) is now also starting to limp.

Let’s not forget that this is the year of Central Banks’ date dependency. What this will equate to is that each data point will be taken with a higher degree of relevance to determine the path of least resistance when it comes to setting monetary policy. Countries that accumulate on aggregate a streak of negative economic reports, and it will not take long for considerations that may involve dovish tilts. From the Fed, ECB, RBA, RBNZ, BoC, PBoC, BoJ, BoE. None are in the safe camp when we talk of a context characterized by a global contraction.

I must say that after the poor ISM report (inventory build-up appears to have been the main culprit to keep it as high as of late), and with the US government shutdown still ongoing, the US is off to an ugly start. The cliff is getting steeper for the Fed to climb. While the upbeat ADP jobs report may give the false perception of acting as a consolation, be aware that this data is much more lagging in nature.

What the weak showing in the US ISM manufacturing does, too, is to further cement the view that the global slowdown in growth continues to spread, becoming a global phenomenon. From East to West, China’s industrial and manufacturing data earlier this week undershot and that keeps lowering prospects for economic activity in the whole Asian region, European PMIs have been underperforming for some time now, the UK remains a political mess, and now we get this US ISM. You get the picture.

The global slowdown so well-telegraphed in late 2018 via the decline in the prices of crude oil or the synchronized flattenings of the yield curves around the world is today, more than yesterday, a reality quickly sinking into the psyche of the market. Let’s not forget that the acknowledgment by Apple that China is a market in deep trouble where revenue prospects are no longer what they used to be, on its own, carries enough substance to be very wary. Even Kevin Hassett, Trump’s advisor, said today he predicts a “heck of a lot” of US companies to follow Apple in lowering its revenue guidance in China.

Shifting gears, in today’s report, I find no reason to revert the focus in the overall risk-off sentiment, which appears to have become a perpetual feature of my daily takes. It’s just what it is. We find ourselves with prolonged flatter yield curves globally (worsened prospects for growth), US bonds on an absolute tear as a preferred shelter amid the recent topsy-turvy movements, Gold continuing its majestic run to the upside as $1,300.00 comes into contact, and the ES rolling over.

In the next 24h, there will be 2 major events to keep in mind. The first comes in the form of the US NFP payrolls, where calls are fairly optimistic, including for a marginal pick up in earnings MoM. Equally, if not more important given the market context, is the speech by Fed’s Chairman Jerome Powell, due to participating in a panel discussion titled “Federal Reserve Chairs: Joint Interview” at the American Economic Association’s Annual Meeting.

No End In Sight For Risk-Off Conditions
The risk index remains under pressure circa 75.41 with no signs in the horizon of a sea change any time soon. The environment is dominated by US Dollar weakness with equities offered, hence why we are seeing risk still on the backfoot. The late 2018 risk-off theme stays for now.


0*rRZ5wX8g_gF5Pzit

Access the chart via Tradingview

The bid caught by US fixed income accelerated further with ZN1! (10y US bonds) exhibiting the highest volume since Dec 6 of last year. The 10y now exchanges hands at 2.56% and given the sharp moves seen, I’ve drawn a more macro projected target, which means there might be further room for bonds to appreciate. Besides, most of the volume is now found trapped on the lower end of Thursday’s range. It’s not looking good for the US Dollar.

Akin to the surge in US bonds, Gold continues its stellar performance but with a much-needed caveat to be aware of. The precious metal has now met its 100% projected target + faces $1.3k overhead. The bullish rhythm is clear and you don’t want to fight it, but if there is an area in the entire trend where significant bouts of profit-taking may be present, around this periphery it is.

The bearish outlook for US equities continues intact, especially on the back of Apple’s poor revenue guidance. The sell-side candle on the ES mini closed near the lows of the day, and as in the case of the US bond dynamics, weak-handed buyers ended up finding themselves trapped long wrong-sided judging by where the PoC (Point of Control) is vs the daily candle close. More pain is possible and I am afraid that neither the VIX nor the HYG (junk bonds) gives us opposing signals.

In the US Dollar index, I am paying attention to the range structure 97.6–95.7 with a midpoint of 96.65, which is critical to help us understand the US Dollar outlook going forward. Ever since the range was established back in mid-October, the index spent the majority of its time on the top 50%. However, as 2019 got underway, we saw this critical mid-point broken. If the index can consolidate on the bottom-side of its range, it harbingers a poorer outlook for the currency. If it breaks higher, then we know what’s the next level of resistance as a reference (97.6).

Last but not least, if we look at the tendencies of the yield curves out of Germany, the US, or Japan, we can extract a clear message. The market envisions an environment of poor growth, which again, should keep the reflationary profile at bay and the overall outlook for risk dire.

Charts Insights: What Are You Missing?

EUR/USD — Best Risk Reward At The Edges Of The Perpetual Range
0*V4OTU4jZoOnQ4OfD

I’ve been endorsing to play EUR from the long-side against the US Dollar on the basis that the spread between the German and the US bond yields is screaming the pricing of the pair remains at a significant discount. However, I still find it hard to believe we can break much higher beyond 1.15 knowing that the German yield curve is also hinting the ECB is facing a tough challenge in 2019 in order to exit its stimulus program and revert back to normalization. The magenta line (German yield curve) keeps the upside limited, while the blue line (German vs US yield spread) provide the downside cap.

The end result appears to be, more stagnant and low vol conditions between 1.13–1.15. Note, the rejection away from 1.15 round number on Jan 2nd should speak volumes of the conviction that still exist to be a seller on strength, while Jan 3rd bullish rejection cements my range-type view. Be aware, that with implied volatility running above historical by a small margin, it does suggest that a small risk for the range to be broken exist, mainly due to the current risk-off environment. Bottom line, keep playing the range at the extremes for the best possible risk-reward opportunities.

GBP/USD — Wide Range To Cover Short Term Eventualities

0*tDXduY_AkcAtz4Zn

Just 24h ago I mentioned that, similar to the outlook in the EUR/USD, any downside resolution in the Sterling, unless driven by negative Brexit headlines, would have a hard time finding acceptance sun 1.125.

The reason lies on the increasingly obvious divergence in the UK vs US bond yield spread. Think about it, investors worldwide can exchange their USDs or local currency for GBPs at a major discounted rate, which gives them more firepower to then allocate greater sums into higher-yielding Gilts (UK bonds).

But again, analogous to my explanation on the EUR/USD, the unresolved Brexit issues is a fundamental risk that is keeping the upside (1.27 and above) well capped. The daily candle rejection is the best testament to the view laid out here. It’s basically communicating that the market is far from prepared to find equilibrium at these low levels.

Also, consider the levels of implied vs historical volatility on the Sterling for the next 7 days as a suggestion that the chances of the 1.2750–1.25 to be broken being quite thin. Once the UK parliament reconvenes on Jan 9, and as clearly reflected in implied vols 2 weeks forward and beyond, the risk of a range breakout should creep up on the meaningful vote, due Jan 15th.

USD/JPY — A Technical Look Beyond The ‘Flash Crash’

0*5jfhHvAMlg_oSofB

On the aftermath of the Yen flash surge, it’s reasonable to have produced such a major correction away from an unjustified sub 105.00 level. However, as the dust settles, unlike the sense of victory by bulls on that Sterling bullish candle print, USD/JPY buyers are far from being in such position.

The losses experienced in the last 24 on a closing basis (down by over 120p) are well justified as the full-blown bullish rally in US bonds (lower US yields) extends, which when combined with lower equities, it will only exacerbate the pains in the pricing of the pair.

The key question we need to ask ourselves now is, what levels to the upside would start to justify re-engaging in topside sell-side action? You will notice in the chart above, I’ve drawn a couple of 100% projection targets, which due to the flash crash, were unequivocally broken. The first one at 108.82 under a time of more efficient markets, while the second target at 108.30 was taken out on the ‘flash’ event.

What this means is that on the way up, and amid a treacherous context for risk, I’d expect the the 108.85–30 to act as the first level of sticky resistance. Judging by where the US 30y bond yield stands, there is just simply no case to be made for a long-lasting recovery in the pair for now.

NZD/USD — Opportunity To Buy On Weakness w/Yield Spread Edge

0*ymgcTT7L2GS71_g9

This is a pair that has caught my attention this morning. The best play here would have been buy it on the way down as the 0.66 round number was re-tested, considering the major divergence between the NZ and US bond yield spread. The decline also met the 100% projection target but not only that, you could have been leaning at the origin of a demand area from Oct 31st. The bullish print on Thursday, nonetheless, suggest that a follow-up buy-side campaign on weakness makes sense in line with the dominant weekly trend, plus the evidence of volume trapped on the wrong side.

Like What You See?
Soon you will be able to subscribe to receive ‘the daily edge’. In the meantime, feel free to follow Ivan on Twitter.

Important Footnotes


    • Risk model: The fact that financial markets have become so intertwined and dynamic makes it essential to stay constantly in tune with market conditions and adapt to new environments. This prop model will assist you to gauge the context that you are trading so that you can significantly reduce the downside risks. To understand the principles applied in the assessment of this model, refer to the tutorial How to Unpack Risk Sentiment Profiles
    • Cycles: Markets evolve in cycles followed by a period of distribution and/or accumulation. The weekly cycles are highlighted in red, blue refers to the daily, while the black lines represent the hourly cycles. To understand the principles applied in the assessment of cycles, refer to the tutorial How To Read Market Structures In Forex
    • POC: It refers to the point of control. It represents the areas of most interest by trading volume and should act as walls of bids/offers that may result in price reversals. The volume profile analysis tracks trading activity over a specified time period at specified price levels. The study reveals the constant evolution of the market auction process. If you wish to find out more about the importance of the POC, refer to the tutorial How to Read Volume Profile Structures
    • Tick Volume: Price updates activity provides great insights into the actual buy or sell-side commitment to be engaged into a specific directional movement. Studies validate that price updates (tick volume) are highly correlated to actual traded volume, with the correlation being very high, when looking at hourly data. If you wish to find out more about the importance tick volume, refer to the tutorial on Why Is Tick Volume Important To Monitor?
    • Horizontal Support/Resistance: Unlike levels of dynamic support or resistance or more subjective measurements such as fibonacci retracements, pivot points, trendlines, or other forms of reactive areas, the horizontal lines of support and resistance are universal concepts used by the majority of market participants. It, therefore, makes the areas the most widely followed and relevant to monitor.
    • Trendlines: Besides the horizontal lines, trendlines are helpful as a visual representation of the trend. The trendlines are drawn respecting a series of rules that determine the validation of a new cycle being created. Therefore, these trendline drawn in the chart hinge to a certain interpretation of market structures.
    • Correlations: Each forex pair has a series of highly correlated assets to assess valuations. This type of study is called inter-market analysis and it involves scoping out anomalies in the ever-evolving global interconnectivity between equities, bonds, currencies, and commodities. If you would like to understand more about this concept, refer to the tutorial How Divergence In Correlated Assets Can Help You Add An Edge.
    • Fundamentals: It’s important to highlight that the daily market outlook provided in this report is subject to the impact of the fundamental news. Any unexpected news may cause the price to behave erratically in the short term.
    • Projection Targets: The usefulness of the 100% projection resides in the symmetry and harmonic relationships of market cycles. By drawing a 100% projection, you can anticipate the area in the chart where some type of pause and potential reversals in price is likely to occur, due to 1. The side in control of the cycle takes profits 2. Counter-trend positions are added by contrarian players 3. These are price points where limit orders are set by market-makers. You can find out more by reading the tutorial on The Magical 100% Fibonacci Projection
 
The Daily Edge: Risk Soars As Powell’s Blinking Is What Counts

0*DEQtN32aMOiL94IW


The Daily Edge is authored by Ivan Delgado, Head of Market Research at Global Prime. The purpose of this content is to provide an assessment of the market conditions. The report takes an in-depth look of market dynamics, factoring in fundamentals, technicals, inter-market, futures and options, in order to determine daily biases and assist one’s decisions on a regular basis. Feel free to follow Ivan on Twitter& Youtube.


The State of Affairs in Financial Markets — Jan 7, 2019

It didn’t take long for Fed’s Chairman Jerome Powell to cave in by sounding more dovish during last Friday’s joint interview alongside former Fed Chairs Bernanke and Yellen. The hint that the Central Bank is prepared to adjust its course on QT (quantitative tightening) should market forces continue to determine — via the sell-off in equities — that the rubber has stretched too much, is the theme at play igniting an abrupt reversal seen since Friday.

Also, make no mistake, Fed’s Powell has walked back all this…


0*AUPwG3JLIQnl91X9

Not because Fed’s President Trump has added pressure on the Central Bank’s policies, as much he tried, but because at the end of the day, no one, even Central Banks, can fight the market. It’s been well-telegraphed through the contraction in Oil prices, US asset valuations through the roof, Apple’s downgraded revenue guidance, depressed manufacturing PMIs, an unprecedented global yield curve inversion in many countries, and the list goes on… that the Fed was reaching a plateau in its cycle.

Headlines of the following caliber: Fed will be “patient, prepared with flexible policy” or “wouldn’t hesitate to change balance sheet policy if needed” were music to the ears of bulls and for the overall recovery in risk sentiment.

Will it last? The comments came directly from the horse’s mouth, so I believe they must be respected and they add credence to see further legs up in risk.

After all, one wonders how long was the Fed ready to delay the inevitable “blink” given the obvious disparity between their rate hike dot plot estimates (3 for 2019) and the Fed fund futures (none).


0*U09uFzrHRklyQpUH

Source: MacroTechnicals

So, while Powell’s hint for concessions in the Fed’s shrinking balance sheet in case of further disruptive market movement is the overarching dominant theme in markets, there is another major development worth noting.

I am talking about the outstanding US payrolls report. It was simply incredible after an increase of 312k jobs, an upward revision of 58k the previous month, an increase in participation (led to a tick up in the unemployment rate) all while wage increases jumped to 0.4% MoM for an annual rate of 3.2% YoY. The take via bank researches was unanimous, it was a big positive.


0*XtBypeFo3HdP-jSc

Source: ING

However, there are a few caveats that are worth outlining for traders not to get ahead of themselves on their bullish views on the US Dollar. Firstly, the US jobs report tends to be a lagging indicator vs other leading measures of which we already had a sour taste last week after a massive decline in the US ISM manufacturing PMI. Take note. Secondly, with no end in sight for a resolution to the US government shutdown, the prospects for the US job figures in Q1 are far from promising. Thirdly, the market is currently emboldened by a sense of renewed risk appetite, even if the cycle is going to be short in nature, and that places currencies the likes of the USD or JPY on the back foot against beta plays the likes of the Aussie, the Canadian Dollar, the Kiwi, EM FX. Fourthly, the US Treasury is about to add liquidity into the system by reducing its cash holdings due to an anticipated debt ceiling suspension, hence this technical liquidity event is another temporary negative risk for the USD.

Andreas Steno Larsen, Senior Global FX/FI Strategist at Nordea Markets, comments on this underlying risk for the USD in Q1: “The likely upcoming debt ceiling excess liquidity surge is interesting, as liquidity developments will then be at odds with Feds balance sheet trend.” You can access the latest Nordea weekly market research by clicking the following link.


0*_CrdK_mA2SjQaQVw

I want to emphasize that as strong as the US NFP may have looked for December, there is a clear risk that the markets, as a discounting mechanism, will gradually be dismissing this positive input, to instead be eclipsed by the underlying signs of a significant contraction in the US economy in H1 ‘19.


0*jccUVnaXsURouY0F

This quote, by Nordea’s Andreas, highlights the overwhelming signs of a top reached in the US economic cycle and should be a great reminder that the focus will be firmly maintained in the global growth slowdown front in 2019 and how the US may continue to “catch down” on trends seen elsewhere.

I can’t foresee how the Q4 2018 risk-off profile gets unwound from a macro perspective, hence why we should remain in an environment where all types of asset classes stay under pressure (risk off) in a theme fairly analogous to what’s been the norm in the last few months. In between, we will obviously have to contend with short-term hiccups of risk appetite, as the one currently underway, on the back of the Fed’s stark change of stance in the monetary options that will be on the table during 2019.

It’s important to remember that there is still a lot more room for the Fed to stay sidelined under a thoughtful waiting mode until the day of reckoning comes to announce a radical reversal back into full-fledged easing mode again. They now have some ammunition ready after the completion of a tightening campaign back towards near neutral levels, while also having the comfort of waiting, courtesy of lagging US NFP numbers that are disguising the true forward-looking direr state of the US economy.

Bottom line, the day in which the Fed goes back into full-blown easing mode is still far from materializing, that’s why we should be mindful that short-term, this run on risk should be a bleep or a drop in a red macro ocean. It may last days, but the environment remains a dangerous one and the trend is clear.

The following chart by the Financial Times, speaks volumes about the attractiveness of short-term fixed-income allocations, a reminder that the market is non-committal and the growth outlook severely disregarded.


0*xDWri5HHuoLQtaVC

Source: Financial Times

As Wikipedia explains: “A money market fund (also called a money market mutual fund) is an open-ended mutual fund that invests in short-term debt securities such as US Treasury bills and commercial paper.[1] Money market funds are widely (though not necessarily accurately) regarded as being as safe as bank deposits yet providing a higher yield.”

To fully understand the impending dangers the US and the global economy face in 2019, I highly recommend to read the latest quarterly investor letter Q4 2018 by Crescat Capital, a value-driven global macro hedge fund, which ended last year as one of the top performing funds according to the HFRX Global Hedge Fund Index, a rare occurrence indeed.


0*g3aj06mRGutv0v0L

Source: Bloomberg

Let’s keep moving along. Talking about ammunition, the one Central Bank that finds itself with no tools left to counteract any downside risks in the Eurozone economy is the ECB. The following picture via Kai Pflughaupt, Inter-Market Analyst with twitter handle @MacroTechnicals speaks a thousand words. The Fed is walking a tightrope, but the ECB is really trapped in a massive hole with no way out.


0*P8cEPjCOkBPg8VHQ

Source: @MacroTechnicals

With the European PMIs in full on deterioration mode and last Friday’s EZ CPI undershooting well below the ECB’s mandate as low Oil prices exert downward pressure, the ECB appears to be the next shoe to drop with a more dovish tilt to its forward guidance.

As Bert Colijn, Senior Economist at ING notes: “Even though wage growth has undoubtedly started to improve in the Eurozone and is now back at growth rates seen during the 2000s, this is not yet translating into stronger core inflation. With other input prices weakening and uncertainty about the Eurozone economy increasing, businesses are not yet pricing through the higher wages.”

Morgan Stanley Economics Team remains fairly optimistic that the ECB will be able to navigate through this patch of weakening data:“The mixed print should not affect the ECB’s view on the inflation trajectory. That said, the central bank does not seem to be in any rush to hike rates. We continue to expect the ECB to hike the depo rate in October, with a dovish tilt in the communication of this first hike. It’s likely to be depicted more as a ‘technical adjustment’ to move away from an overly negative policy rate than the start of a hiking cycle.”

But not only the economic indicators in the Euro Area are faltering amid tentative signs of a broader economic slowdown, but the social unrest in France is getting out of control. That’s one of the key reason why I can’t see a breakout of the EUR/USD 1.13–1.15 range anytime soon. The French credit-default swap has been ticking up as of late, a source of concern for markets.

Judge by yourself:


0*AzOUdtaGyDGcFjob

Click to watch video

Since global growth has been pinned at the very top of everyone’s list as the hot topic to monitor, we cannot ignore the latest developments in China, the economy that in the last decade, has contributed to half the growth in global GDP! Last Friday, we learned that amid the country’s unprecedented credit bubble and consistently weaker economic data for the last 2 years, the PBOC announced a cut of 1% to its reserve requirement ratio to ensure greater pockets of liquidity in the system.


0*h0kKxdbol_HxSWSw

Source: Reuters FXWW room

This news out of China, coupled with the blinking of Fed’s Powell, strengthens a short-term thesis in which a recovery in risk asset (micro in nature) within a wider macro risk-off context ensues.

By having a look at the performance of the most risk-sensitive assets, the latest movements are characterized by a classic risk-appetite swing. The risk-weighted index seems to be carving out a temporary short-term bottom (area chart), US bonds were sold the most since Oct 3rd ’18, the S&P 500 printed a commanding bullish outside day while Gold was trounced off 1.3k with the sell-off in the GC futures contract carrying the highest volume since the second week of Oct ‘18.

In the grand scheme of things, the macro trend of global yield curve inversions (bottom left chart) should be a useful reminder that this current risk-on cycle should be short-term in nature and until proven wrong, I believe that at the end, when juxtaposing global growth vs Fed’s dial down on its QT, the former will continue to keep risk assets underperforming macro-wise until the Fed does really commit to reverse course.


0*g87bsxj5ZJn-FLF2


Charts Insights: What Are You Missing?

EUR/USD — Perennial Range With Opportunities at the Extremes

0*gqdXwKqYPvqNTsgA

By drawing a volume profile from the onset of the eternal daily range between 1.15 and 1.1220, we can extract some valuable insights. We can observe how the majority of the volume ever since late October has been concentrated in a 1 cent range as depicted via the dash lines (1.1330–1.1430). That would be our micro range as guidance. Then we have the macro range delimited by 1.15 to the upside and 1.1270 to the downside. We will disregard the drop on Nov 12 as a one-off event which if accounted for would misrepresent the accuracy of the range measurement.

We can also see how the POC is found circa 1.14, which carries a fairly strong message, as it communicates than after months of interactions within the confined range, the perceived fair value within the range is largely skewed towards the upside. This strengthens the notion that any revisit of the lower end of the range, between 1.1330 and 1.1270 should continue to offer buy-side opportunities as has been the case throughout the duration of the range (see magenta arrows). Similarly, the interactions between 1.1430 and 1.15, given the weakening economic trends in the EZ, should continue to provide formidable selling opportunities, even if my conviction, due to the potential reversion in Fed’s policies and the German vs US yield spread, is not as strong.

GBP/USD — Fast Approaching A Selling Area

0*rKrHeRxOPCRsurdQ

If you, like me, believe that the Sterling cannot possibly justify a break outside its macro range, which now I perceive to be between 1.28 and 1.25, until the Brexit situation clears up, then you’d probably agree that the Sterling is fast approaching an area of high interest to be a seller on strength. I’ve drawn the POC (Point of Control) that represents the highest accumulation of volume through Oct/Nov to highlight how stiff this resistance should become for a currency that keeps surging as a function of USD weakness and vague hope that the anticipated defeat of the UK May’s Brexit deal as part of the meaningful vote may lead to a second referendum vote or a general election being called as the next step. Hard to see any risk-reward to be a high timeframe buyer here unless you really are betting for a breakout of the EURUSD range or 2nd referendum.

AUD/USD — Buy on Weakness With Short-Term Target of 0.7170

0*_ioYDjtecBleBgnj

It hasn’t really mattered whether or not the ratio of the S&P 500 / Gold kept falling, the Aussie has shown extreme resilience to reject lower levels. The trap of volume circa 7050 with the 5-day MA now turning bullish, which is a sign of short-term positive momentum, does suggest that we are in the midst of a buy-side campaign until the short-term target of 7170 is achieved and buyers can start finding sufficient pockets of liquidity to close their short-term long exposure as macro accounts are likely to step back into sell-side interest. For now, I am a buyer on weakness, with my order waiting to be filled on a retracement back towards 7060.

EUR/AUD — Time To Be A Seller On Rallies

0*kFZEUuapmgGE-vgx

As I was scanning through my markets today, I feel compelled to report on what’s potentially a short-term opportunity to capitalize on the strength on the Aussie, this time vs the Euro. As the Fed Put is out of Powell’s hat, coupled with China’s easier policies, this has induced a short-term change in market dynamics, which is being supported by EUR/AUD technicals too. The price has broken below its previous swing low, with the VIX and the German vs Aus yield spreads moving in tandem to favor the downside momentum in the pair. However, with the move looking overstretched, the best play here appears to be engaging in relief rallies above the 1.61/6150 area.

Options — 25 Delta RR & Vols

0*SQ-6XdnbrjlPV_xN

* The 25-delta risk reversal is the result of calculating the vol of the 25 delta call and discount the vol of the 25 delta put. … A positive risk reversal (calls vol greater than puts) implies a ‘positively’ skewed distribution, in other words, an underperformance of longs via spot. The analysis of the 25-delta risk reversals, when combined with different time measures of implied volatility, allows us to factor in more clues about a potential direction. If the day to day pricing of calls — puts increases while there is an anticipation of greater vol, it tends to be a bullish signal to expect higher spot prices.

Source: http://cmegroup.quikstrike.net (The RR settles are ready~1am UK).

Options — Ratio Imp/Hist Vol & Insurance Protection
Find below today’s implied / historical vol levels. Are we entering a regime of higher vol in the Australian and New Zealand Dollar? According to the ratios seen, it looks like we may transition from a protracted gamma — scalping market profile to much slipper price action in coming weeks.


0*lSZFKQUqKrjdjYIV

Source: https://www.investing.com/currencies/forex-options

* If implied vol is below historical vol, represented by a ratio < 1% in the table above, the market tends to seek equilibrium by being long vega (volatility) via the buying of options. This is when gamma scalping is most present to keep positions delta neutral, which tends to result in markets more trappy/rotational. On the contrary, if implied vol is above historical vol, represented by a ratio > 1%, we are faced with a market that carries more unlimited risks given the increased activity to sell expensive volatility (puts), hence why it tends to result in a more directional market profile when breaks occur. The sellers of puts must hedge their risk by selling on bearish breakouts and vice versa.

Like What You See?
Soon you will be able to subscribe to receive ‘the daily edge’. In the meantime, feel free to follow Ivan on Twitter.

Important Footnotes
  • Risk model: The fact that financial markets have become so intertwined and dynamic makes it essential to stay constantly in tune with market conditions and adapt to new environments. This prop model will assist you to gauge the context that you are trading so that you can significantly reduce the downside risks. To understand the principles applied in the assessment of this model, refer to the tutorial How to Unpack Risk Sentiment Profiles
  • Cycles: Markets evolve in cycles followed by a period of distribution and/or accumulation. The weekly cycles are highlighted in red, blue refers to the daily, while the black lines represent the hourly cycles. To understand the principles applied in the assessment of cycles, refer to the tutorial How To Read Market Structures In Forex
  • POC: It refers to the point of control. It represents the areas of most interest by trading volume and should act as walls of bids/offers that may result in price reversals. The volume profile analysis tracks trading activity over a specified time period at specified price levels. The study reveals the constant evolution of the market auction process. If you wish to find out more about the importance of the POC, refer to the tutorial How to Read Volume Profile Structures
  • Tick Volume: Price updates activity provides great insights into the actual buy or sell-side commitment to be engaged into a specific directional movement. Studies validate that price updates (tick volume) are highly correlated to actual traded volume, with the correlation being very high, when looking at hourly data. If you wish to find out more about the importance tick volume, refer to the tutorial on Why Is Tick Volume Important To Monitor?
  • Horizontal Support/Resistance: Unlike levels of dynamic support or resistance or more subjective measurements such as fibonacci retracements, pivot points, trendlines, or other forms of reactive areas, the horizontal lines of support and resistance are universal concepts used by the majority of market participants. It, therefore, makes the areas the most widely followed and relevant to monitor. The Ultimate Guide To Identify Areas Of High Interest In Any Market
  • Trendlines: Besides the horizontal lines, trendlines are helpful as a visual representation of the trend. The trendlines are drawn respecting a series of rules that determine the validation of a new cycle being created. Therefore, these trendline drawn in the chart hinge to a certain interpretation of market structures.
  • Correlations: Each forex pair has a series of highly correlated assets to assess valuations. This type of study is called inter-market analysis and it involves scoping out anomalies in the ever-evolving global interconnectivity between equities, bonds, currencies, and commodities. If you would like to understand more about this concept, refer to the tutorial How Divergence In Correlated Assets Can Help You Add An Edge.
  • Fundamentals: It’s important to highlight that the daily market outlook provided in this report is subject to the impact of the fundamental news. Any unexpected news may cause the price to behave erratically in the short term.
  • Projection Targets: The usefulness of the 100% projection resides in the symmetry and harmonic relationships of market cycles. By drawing a 100% projection, you can anticipate the area in the chart where some type of pause and potential reversals in price is likely to occur, due to 1. The side in control of the cycle takes profits 2. Counter-trend positions are added by contrarian players 3. These are price points where limit orders are set by market-makers. You can find out more by reading the tutorial on The Magical 100% Fibonacci Projection
 
Find my latest market thoughts

The Daily Edge: USD Feels The Pain As Fed’s Blink Effects Linger

picfc29986f3685f0898a655b619ca3f089.


The Daily Edge is authored by Ivan Delgado, Head of Market Research at Global Prime. The purpose of this content is to provide an assessment of the market conditions. The report takes an in-depth look of market dynamics, factoring in fundamentals, technicals, inter-market, futures and options, in order to determine daily biases and assist one’s decisions on a regular basis. Feel free to follow Ivan on Twitter& Youtube.

The State of Affairs in Financial Markets — Jan 8, 2019

The risk rally ignited by the blinking of Fed’s Powell and further supported by the easing in China after the PBOC announced a 1% RRR cut to its banks, continues to underpin risk assets. The underperformance of the Japanese Yen, now well below its pre-flash crash levels, portrays the improved picture, even if the cynic within me, still tells me we are far from being out of the woods.

The reason I am adamant to place too much weight on a protracted relief rally is that I still have very present in my mind where we come from in late 2018. One of the ugliest Dec equity sell-off ever, US companies’ earnings estimates to follow Apple’s downgraded guidance, an Oil exchange rate that still screams a low growth/deflationary environment, a record-high move into US money markets, just to name a few. As an analogy, the current recovery in risk assets still feels like too minuscule and with a few major hurdles to overcome before a more convincing phase can take shape.

Fed’s Powell has caused technical damage to overblown risk-off extensions, but as I argued in yesterday’s report, the Fed will still need to transition from a mere dovish stance about its readiness to act and adjust its balance sheet to more dovish action. Even if the market buys into the idea that the Fed tightening campaign is clearly over (no more hikes priced in this year), the Central Bank needs to follow up with the type of signals that will keep the market’s hopes of a slowdown in QT alive. If you check today’s 25-delta risk reversals updates (provided below), it should be concerning that the premium to buy Puts on the E-mini S&P 500 keep rising as the correction higher continues. Similarly, the Calls in US fixed income seem to be reverting back up, now more expensive than the Puts again, after a brief spell in which Fed’s Powell interview caused the pricing to even out.

The weak US PMI, which follows a broader negative theme worldwide, Apple’s miss unlikely to be an isolated incident, recently extreme equity valuations, a housing market in trouble… must still contend with residual strong US economic data emanating from the jobs market or consumers’ consumption. So, while we’ve been offered the first catalyst courtesy of Powell to see risk premiums come down, the process of reckoning the true risks of a deterioration in the US economy may end up being a slow process, with the pendulum swinging from optimism to pessimism.

All the walk-back the Fed has done ever since Chairman Powell told us that US rates were at a significant distance from neutral to now even consider adjusting the Fed’s balance sheet, draws a clear trend. One that is starting to show some clear cracks via the USD index, as it threatens a major technical breakout after closing at the bottom of its multi-month range circa 95.70, just as the EUR/USD keeps re-aligning itself with its higher macro valuation based on the German vs US yield spread. It’s still too early to claim victory by the bulls, but the highest close in the EUR/USD in the entire duration of its torturous range is a pretty negative presage for the USD worth monitoring.

piceac912260b2222bdc543ef63c8ed8ae0.


The undershoot in the US Dec ISM non — manufacturing PMI at 57.6 vs 59.00 exp on Monday adds to the growing worries that the US economy may start limping of one leg, as it occurs just days after we learned that the US ISM manuf PMI saw one of its sharpest drops on record. As a reminder, statistically, last week’s miss in the key manuf data out of the US heightens significantly the chances of a potential recession in the US as the economic cycle falters. As a consolation, today’s US ISM non-manuf data saw a minor uptick in new orders which still argues for residual demand.

In Europe, after a weakening trend in the EZ CPI last Friday, even if expected on the back of the massacre suffered by Oil prices, we had to contend with another very poor showing in German factory orders. The release further cements the downward trend in manufacturing read we are seeing across major countries and places the ECB in a very difficult position to be the next one to follow the Fed’s step and blink on its intentions to normalize the policy this year. A positive German retail sales reading on Monday, far exceeding expectations, felt like not enough to offset the negatives.

A currency that has started 2019 on a tear, which comes in stark contrast to its depressive performance from late 2018, is the Canadian Dollar. The last economic data release — Ivey PMI — at 59.7 vs 57.2 stands out as quite impressive considering the trend seen elsewhere.

Whether or not the CAD outperformance keeps on going, will be highly dependable on tomorrow’s BoC policy meeting, with the market recently starting to price in the chances of a rate cut in ‘19.

Allow me to quote Adam Cole, Chief Currency Strategist at RBC Capital Markets, and its take:

“We are in line with the consensus in seeing no change in the overnight rate on January 9th. Financial market developments have been huge in the month since the December confab, with 2-, 5- and 10-year yields all ~30bp lower in the broad global risk-off move. Governor Poloz & Co. were noticeably more dovish at the December meeting and associated economic progress report, highlighting risks from lower oil prices and the possibility of an output gap re-emerging due in part to GDP revisions and softer Q3 GDP details. Near-term growth looks to be soft at just over 1%, with oil production curtailments and a postal strike weighing. We do expect GDP growth beyond to be at or above potential and see 2019 at 1.7% overall. Combined with underlying inflation remaining around 2%, this should be enough to see two hikes later this year.”

Economic Calendar

pic1f2062aca80963bdc3399c6e02a9bcfa.png


Charts Insights: What Are You Missing?

EUR/USD — The Most Bullish It’s Been For Months

picf6ca0b9eafe89245d5ce6cc734aebf85.


The USD weakness playing through after Powell’s Put is evident in the valuation of the Euro. While I’ve argued that I simply can’t envision the multi-month range to be decisively broken, price action and volume is king as they reflect the market’s intentions. The close above the first layer of resistance at 1.1443 is a major warning sign that yet another attack towards 1.15 is on the cards. Notice, the retest of 1.15 would be just 4 days after it was last tested, which suggests sellers’ conviction is definitely waning. The pick up in the risk environment underpins the USD liquidation short-term, as does the latest fundamental developments by the Fed (blinking), which was well telegraphed by the widening of the German vs US bond yield spread. However, the economic data in the EZ is far from giving us much enthusiasm as the repercussion for a dovish tilt in the ECB monetary stance cannot be underestimated. The bond yield curve in Germany should be a red flag. Overall, it looks like an opportunity to be a buyer on weakness remains the scenario most attractive, especially if one considers that the downside is now supported by the backside of the 1.1443 + range POC at 1.14.

GBP/USD — Enters Resistance Amid Broad-Based USD Weakness

picc8974d84340de49f1019f0a3ecf12688.


Fundamentally, if you can’t foresee the Brexit situation getting better before it gets worse, the Sterling is currently exchanging hands at an area of high interest. The area it trades at, circa 1.28, constitutes the POC through October and what I expect to be a major wall of offers. The area highlighted in red should be very solid in terms of liquidity for a potential sell-side campaign ahead of next week’s second Brexit meaningful vote. Also, bear in mind that the Put premiums remain elevated vs Calls, so there is still a genuine perception that the Sterling is trading at too rich levels based on the risks ahead. One of the possible scenarios to play out, as recently reported, is that the EU and the UK find a way to extend the article 50 in order to keep kicking the can down the road and going back to the drawing table for the necessary concessions. The pair is still subject to major erratic vol.

EUR/CAD — Heading Into Buy-Side Territory

pic874691e3e444dc582f1eb843e3c23672.


A chart that caught my attention this morning is the CAD against the EUR. It’s fast approaching the origin of a major demand area where we saw an impulsive move up. What’s most compelling is that we could be buying Euros at a rate that makes the deal really attractive from a valuation perspective, as the German vs Canadian bond yield spread exhibits a major divergence with price. If we look back the last quarter, the price has been moving in lockstep with the spread, hence making a buy-side campaign off 1.52–5220 an idea worth considering. The meteoric rise in the Loonie in the early days of ’19, also appears to be out of whack with the more moderate recovery observed in the price of Oil, now heading back to retest $50.

NZD/USD — Revisits The 50% Retracement After Structure Break

pic0ece46b330c9090bbf6e17795b38d790.


The Kiwi found a bottom at the 100% projected target anticipated at 6580–85. Since the retest of the low came amid a major divergence in the bond yield spread, it’s no coincidence that the market found genuine value to engage in a buy-side campaign. The price appears to have rebounded too fast, too quick towards a major area of interest now, depicted by a 3rd touch of a descending trendline, which coincides with the 50% fib retrac of the latest move down. The symmetries in this market as of late have been playing out with great accuracy, so I’d expect significant sell-side interest. Note, the yield spread still shows a macro advantage for the Kiwi, so one must be mindful that pockets of downside liquidity to bid the Kiwi at nearby levels could lead to significant challenges to push further up. What matters here and the main point to take home is that the pair is at a crossroads, technically speaking. Besides, the premium paid to buy AUD Puts remains very quite high, so by

Options — 25 Delta RR & Vols

picfddb09e7f2d449da31e860b15a5826f0.


* The 25-delta risk reversal is the result of calculating the vol of the 25 delta call and discount the vol of the 25 delta put. … A positive risk reversal (calls vol greater than puts) implies a ‘positively’ skewed distribution, in other words, an underperformance of longs via spot. The analysis of the 25-delta risk reversals, when combined with different time measures of implied volatility, allows us to factor in more clues about a potential direction. If the day to day pricing of calls — puts increases while there is an anticipation of greater vol, it tends to be a bullish signal to expect higher spot prices.

Source: http://cmegroup.quikstrike.net (The RR settles are ready ~1am UK).

Options — Ratio Imp/Hist Vol & Insurance Protection

pic5882e79d7d97c0bccc8ad9e77fecb24b.


Source: https://www.investing.com/currencies/forex-options

* If implied vol is below historical vol, represented by a ratio < 1% in the table above, the market tends to seek equilibrium by being long vega (volatility) via the buying of options. This is when gamma scalping is most present to keep positions delta neutral, which tends to result in markets more trappy/rotational. On the contrary, if implied vol is above historical vol, represented by a ratio > 1%, we are faced with a market that carries more unlimited risks given the increased activity to sell expensive volatility (puts), hence why it tends to result in a more directional market profile when breaks occur. The sellers of puts must hedge their risk by selling on bearish breakouts and vice versa.

Like What You See?

Soon you will be able to subscribe to receive ‘the daily edge’. In the meantime, feel free to follow Ivan on Twitter.
 
Find my latest market thoughts

The Daily Edge: Residual Risk Appetite Persist After Friday’s Fed Put


1*Jm3hPrHz5K7C_LWhL3RuTQ.png


The Daily Edge is authored by Ivan Delgado, Head of Market Research at Global Prime. The purpose of this content is to provide an assessment of the market conditions. The report takes an in-depth look of market dynamics, factoring in fundamentals, technicals, inter-market, futures and options, in order to determine daily biases and assist one’s decisions on a regular basis. Feel free to follow Ivan on Twitter& Youtube.

The State of Affairs in Financial Markets — Jan 9, 2019

The US Dollar saved the day by regaining some of its strength, especially against the European block, allowing the DXY to move gently away from a key area of support circa 95.70 as the chart below shows. The residual bouts of risk appetite on the back of Fed’s Powell dovish tilt last Friday are still feeding through, with the S&P 500, as the bellwether of the overall US equity complex, extending its technical correction, while the US fixed income market found another leg down, with the 10yr bond yield creeping up to 2.73.

0*OnnOWNJu0NumyyIB


Under lingering risk-on conditions, which were further supported by Trump’s tweet that trade talks with China “are going very well”, flows into the US Dollar should have, in theory, receded on Tuesday. However, the weakening trend in the Eurozone economic data is no longer an aberration but a clear pattern that sooner or later the ECB must take note by adjusting its overblown growth estimates. And because of that, alongside Brexit risks, the US still becomes a safe house to hide when overstretched vs the EUR or GBP.

The reason we ended up with limited demand to lift the Euro can clearly be explained by the atrocious German industrial production, which plummeted way below consensus, and as Daniel La Calle, an acclaimed economist at Tressis notes, “while consensus keeps impossible EZ growth expectations.”

0*Fu3hFD439wz-gMJK


Source: @dlacalle_ia

To put things into perspective, the fall in Germany’s industrial production on a yearly basis was 4.7% n December, which means it’s by far the largest since December 2009. To make matters worse, the European Commission’s economic sentiment indicator (ESI) for the Eurozone fell from 109.5 in November to 107.3 in December, which makes 12 out of 12 months in declines. These latest data points have led to starting to see calls of a technical recession in Germany in H2 2019.

Carsten Brzeski, Chief Economist ING in Germany notes: “ At face value, today’s industrial production data has clearly increased the risk of a technical recession in Germany in the second half of 2018. Watch out for tomorrow’s trade data. Another disappointment, combined with the high inventory build-up in 2Q and 3Q, would clearly increase the likelihood of a technical recession. On the other hand, private and public consumption still have the potential to offset recession forces. Looking ahead, however, even a technical recession should be nothing to be too worried about. It should be technical, without any significant marks on the labor market.”

Meanwhile, Eurozone corporate spreads and sovereign spreads keep rising even as the environment continues to be relatively stable since the Powell Put. On corporate bonds, what’s even more worrying is the fact that, as Asif Abdullah, Strategist at Scotiabank, explains, “unlike the Fed, the ECB holds corporate bonds. If ECB actually winds down its QE and starts reducing assets, these spreads would rise even further.”

What the above observations translate to, in layman terms, is that the ECB won’t allow this tightening of economic conditions to keep on going. That’s why we are progressively moving towards a phase in which the ECB is entering a state of virtual reality if they so believe they can wishfully think the normalization of its policies can occur anytime soon (read 2019).

0*Fh0mwzjysMlJyqW0


Source: @Asif_H_Abdullah

However, there are still some actors, such as ECB’s member Hansson who can always take the other side, of course. The policy-maker had the following to say on Tuesday: “Labor-market data remains unexpectedly positive. ECB rate guidance rather precise if economy on track. The balance of risk hasn’t shifted after recent data. For every bit of bad news, you get a bit of better news, and on balance I don’t see this creates risks that shift the balance of risks,” he said.

“Once the labor market tightens, wage pressure increases… Eventually, that will spill over into prices and create a firmer basis for inflation,” he added.

To me, that sounds more in tune with an overly optimistic approach. It seems as though Hansen may have been living under a rock not realizing that all the trillions of QE spent to reinvigorate the Eurozone economy and support prices have had marginal and far from exponentially incremental changes in asset multiples. Or perhaps he should be reminded of the deflationary pressures that Oil prices are set to cause to headline inflation in the Euro area.

0*kCOyTi8QQvc8VXJI


Source: @jsblokland

Countries like the Saudis are starting to get quite desperate on the shortage of revenue the Oil decline has created on its aggressive budget aimed at diversifying away beyond petroleum products, and as the WSJ reports this week, they are planning new export cuts as a bet to lift up the price of oil. The WSJ reads: “Saudi Arabia is planning to cut crude exports to around 7.1 million barrels a day by the end of January in hopes of lifting oil prices above $80 a barrel, according to OPEC officials.”

This is one of the reasons why I’ve been unable to conceive a trading environment in which the Euro exchanges hands significantly above the $1.15. Don’t get me wrong, I am still overall positive on the pair as I am ultimately a slave of my process, one that follows the German vs US yield spread as the ultimate barometer of the most heavily FX pair valuation. Even if the spread has been moving lower in a micro scale as Germany’s bonds continue to attract demand, on a macro scale, capital flows towards the US should recede as the yield advantage evaporates on a more dovish Fed.

0*uX2oW8OXR9vLhTB4


According to the latest research note by Bank of America Merrill Lynch, there is currently opposing forces keeping the USD index confined in familiar levels with hedge funds selling USD, particularly against JPY, while real money is buying USD, particularly against EUR. BoAML adds that “for the USD weakness to gain momentum, real money has to also start selling.”

0*GjasnFiv5DdlsgBu


A currency that is finding it harder to keep up its pace is the Sterling as the market seems to now anticipate a plethora of negative headlines about to pour in amid a very gloomy outlook for the UK Prime Minister May to gather enough support on the upcoming meaningful vote of the Brexit deal on January 15th. There has been growing commentary across media outlets that the UK and Europe may be negotiating an extension of the article 50 to allow for a delayed divorce so that both parties can go back to the drawing table so that the UK can get the concessions needed. However, the cynic within me still thinks that the EU won’t budge, and the article below, reflects my view. Ultimately, the European Union has to stick with its toughness to send a message to the rest of Euro-area nations.

0*xGx1IwQOqGKDZEWj


The Sterling has now reached a critical level of resistance, one that I perceive as the top of its current range between 1.28 and 1.25. Tuesday’s bearish outside day marries well with the prognosis that a turnaround in fortunes for the detriment of sellers might be on the cards.

Moving on, I must admit that in the US economy, even as the positives echoes of last Friday’s US non-farm payrolls still reverberate on the back of our minds, Tuesday’s jobs openings didn’t live up to the expectations after a fall to 6888 vs 7050. With the Fed now having confirmed a pause in rates for the time being, each data point is of extreme interest to markets. I still find that on aggregate, the recent negative inputs emerging from the US ISM manuf PMI, non-manuf ISM act as an offset to rising job figures and allow the Fed room to maintain its pause and support the overall risk.

0*Ls9nT-KdYYExmYov


Source: @jsblokland

An important point I made yesterday so that we can understand how the Fed has gotten to this point in its normalization cycle, is what Soros coined reflexibility and why this theory is manifested in present market conditions to an extent unlike we’ve not seen before. Thomas Harr, PhD, Global Head of FI&C Research, at Danske Bank, writes about this inflexion point:

0*Txs3NEqED3AjjZXC


One of these inflection points for the market, other than the re-calibrated Fed narrative, is the ongoing Sino-US trade war, and whether or not concessions from both sides can be enough to find a more protracted accord that really lift the mood in markets. However, on the back of my mind, at least during H1 2019, I question if any deal would be too little too late to meaningfully reverse the risk-off course, given that the rhetoric has evolved from a China slowdown to a global growth issue.

Headlines of this caliber, just crossing the wires:

*TRUMP WANT TRADE DEAL WITH CHINA SOON TO BOOST MARKETS

Makes you think that for the US, it’s all about a recovery in risk assets and a relaxation in the tightening of financial conditions. Not to mention China, that is in desperate need to address its massive imbalances and reinvigorate its economy by any means possible. The following research note by Nordea’s Amy Yuan Zhuang sums it up.

0*5iuoHPtbiRLfCh_H


Source: Nordea

Heading into Wednesday, the focus shift towards the North American Central Banks. First up is the Bank of Canada followed by the Fed minutes, where the market will keep an eye on any subtle changes in rhetoric as part of the internal discussions in relation to monetary policy.

Heading into the BoC, Adam Cole, Chief Currency Strategist at RBC Capital Markets, shares his take: “We are in line with the consensus in seeing no change in the overnight rate on January 9th. Financial market developments have been huge in the month since the December confab, with 2-, 5- and 10-year yields all ~30bp lower in the broad global risk-off move. Governor Poloz & Co. were noticeably more dovish at the December meeting and associated economic progress report, highlighting risks from lower oil prices and the possibility of an output gap re-emerging due in part to GDP revisions and softer Q3 GDP details. Near-term growth looks to be soft at just over 1%, with oil production curtailments and a postal strike weighing. We do expect GDP growth beyond to be at or above potential and see 2019 at 1.7% overall. Combined with underlying inflation remaining around 2%, this should be enough to see two hikes later this year.”

Lastly, we await the US President Trump speech at 2 GMT with talks in the street that he is set to declare a state of emergency amid the inability to reach a deal with Democrats on a reopening of the US government due to the controversial building of a wall.

Risk Events For Today

0*cjIV9Mska_UOahXC


Source: Forexfactory

Options — 25 Delta RR & Vols


0*CM34AF0KFb4Uamj_


* The 25-delta risk reversal is the result of calculating the vol of the 25 delta call and discount the vol of the 25 delta put. … A positive risk reversal (calls vol greater than puts) implies a ‘positively’ skewed distribution, in other words, an underperformance of longs via spot. The analysis of the 25-delta risk reversals, when combined with different time measures of implied volatility, allows us to factor in more clues about a potential direction. If the day to day pricing of calls — puts increases while there is an anticipation of greater vol, it tends to be a bullish signal to expect higher spot prices.


Source: http://cmegroup.quikstrike.net (The RR settles are ready ~1am UK).

Options — Ratio Imp/Hist Vol & Insurance Protection

0*88NkhdxaL62G2JbM


Source: https://www.investing.com/currencies/forex-options

* If implied vol is below historical vol, represented by a ratio < 1% in the table above, the market tends to seek equilibrium by being long vega (volatility) via the buying of options. This is when gamma scalping is most present to keep positions delta neutral, which tends to result in markets more trappy/rotational. On the contrary, if implied vol is above historical vol, represented by a ratio > 1%, we are faced with a market that carries more unlimited risks given the increased activity to sell expensive volatility (puts), hence why it tends to result in a more directional market profile when breaks occur. The sellers of puts must hedge their risk by selling on bearish breakouts and vice versa.

Like What You See?

Soon you will be able to subscribe to receive ‘the daily edge’. In the meantime, feel free to follow Ivan on Twitter.

Important Footnotes

  • Risk model: The fact that financial markets have become so intertwined and dynamic makes it essential to stay constantly in tune with market conditions and adapt to new environments. This prop model will assist you to gauge the context that you are trading so that you can significantly reduce the downside risks. To understand the principles applied in the assessment of this model, refer to the tutorial How to Unpack Risk Sentiment Profiles
  • Cycles: Markets evolve in cycles followed by a period of distribution and/or accumulation. The weekly cycles are highlighted in red, blue refers to the daily, while the black lines represent the hourly cycles. To understand the principles applied in the assessment of cycles, refer to the tutorial How To Read Market Structures In Forex
  • POC: It refers to the point of control. It represents the areas of most interest by trading volume and should act as walls of bids/offers that may result in price reversals. The volume profile analysis tracks trading activity over a specified time period at specified price levels. The study reveals the constant evolution of the market auction process. If you wish to find out more about the importance of the POC, refer to the tutorial How to Read Volume Profile Structures
  • Tick Volume: Price updates activity provides great insights into the actual buy or sell-side commitment to be engaged into a specific directional movement. Studies validate that price updates (tick volume) are highly correlated to actual traded volume, with the correlation being very high, when looking at hourly data. If you wish to find out more about the importance tick volume, refer to the tutorial on Why Is Tick Volume Important To Monitor?
  • Horizontal Support/Resistance: Unlike levels of dynamic support or resistance or more subjective measurements such as fibonacci retracements, pivot points, trendlines, or other forms of reactive areas, the horizontal lines of support and resistance are universal concepts used by the majority of market participants. It, therefore, makes the areas the most widely followed and relevant to monitor.
  • Trendlines: Besides the horizontal lines, trendlines are helpful as a visual representation of the trend. The trendlines are drawn respecting a series of rules that determine the validation of a new cycle being created. Therefore, these trendline drawn in the chart hinge to a certain interpretation of market structures.
  • Correlations: Each forex pair has a series of highly correlated assets to assess valuations. This type of study is called inter-market analysis and it involves scoping out anomalies in the ever-evolving global interconnectivity between equities, bonds, currencies, and commodities. If you would like to understand more about this concept, refer to the tutorial How Divergence In Correlated Assets Can Help You Add An Edge.
  • Fundamentals: It’s important to highlight that the daily market outlook provided in this report is subject to the impact of the fundamental news. Any unexpected news may cause the price to behave erratically in the short term.
  • Projection Targets: The usefulness of the 100% projection resides in the symmetry and harmonic relationships of market cycles. By drawing a 100% projection, you can anticipate the area in the chart where some type of pause and potential reversals in price is likely to occur, due to 1. The side in control of the cycle takes profits 2. Counter-trend positions are added by contrarian players 3. These are price points where limit orders are set by market-makers. You can find out more by reading the tutorial on The Magical 100% Fibonacci Projection
 
Find my latest market thoughts

Also, find the recap in video format


The Daily Edge: The US Dollar Enters A New Bearish Phase Near-Term

1*oKeNrgBXAm-BzJi1Xjbgew.png


The Daily Edge is authored by Ivan Delgado, Head of Market Research at Global Prime. The purpose of this content is to provide an assessment of the market conditions. The report takes an in-depth look of market dynamics, factoring in fundamentals, technicals, inter-market, futures and options, in order to determine daily biases and assist one’s decisions on a regular basis. Feel free to follow Ivan on Twitter& Youtube.

Quick Take — Why The USD Bearish Outlook?

The US Dollar is set to extend its weakness against the Euro in the following weeks towards its next projected targets at 1.1550 (hit on the breakout) and ultimately complete its bearish cycle as the currency is dealt at levels circa 1.1750 up to 1.18. In this article, I will lay out all the reasons that have cemented and continue to make me bearish the world’s reserve currency.


Drivers — What’s The Current Story?

The debacle of the US Dollar from its peak in Nov-Dec ’18 can be explained, rather than by the merits of the Euro per se (far from it), which accounts for 57% of the DXY basket, as an adjustment of expectations over the Federal Reserve’s inability to raise rates any further. The most fascinating part about the walk back in the Fed hawkish rhetoric in a matter of weeks, however, is the fact that the market has been the ultimate culprit forcing the Fed to re-think its normalization path, even if the unwillingness by the Fed to hear the screaming market signals amid a roaring economy was clear.

The re-calibration in the language by Fed’s Chairman Powell, now publicly admitting that the Central Bank is finally open to hearing the signals the market is sending by considering potential tweaks in its QT (quantitative tightening) down the road, was the ultimate evidence of a market that was setting up to near a resolution of its protracted range.

In the last 24h, multiple Fed speaks have left no stone unturned, providing further backing to the view that the era of tightening has come to an abrupt halt in the foreseeable future. Fed’s Bostic, Evans, Rosengren, Mester, all seem to now be defending the same camp, one where ‘patience’ and ‘flexibility’ has become the norm. This dovish tilt was further confirmed by the Fed minutes, where the statement read that “the committee could afford to be patient about further policy firming” with risks to the outlook highlighted.

By and large, that’s been the story driving the current weakness seen in the US Dollar. A narrative in which the shift in focus from a clearly hawkish stance in early Q4 ’18 to where we’ve come to be today is quite radical, regardless of whether or not the market has been the culprit forcing them to ‘blink’.

It was precisely the market, via the German vs US bond yield spread, which had been telegraphing for quite some time that the capital flows into the US were set to recede as the yield advantage was rapidly on the retreat. Again, it wasn’t as if the German or the wider Eurozone could carry enough credence to justify higher yields, but it was more to do with a rubber band in the US yields front that had seemingly stretched a bit too far.

From mid-December, it’s when we started to see the real cracks in the German vs the US bond yield spread, which firmed up my bullish conviction to start buying Euros on weakness as the preponderance of evidence mounted.


I must confess that even if my view has been to support the long-side bias all along, I wasn’t that convinced by a breakout of the 1.15 vicinity due to the horrendous set of weakening economic indicators in the Euro area. Even if my endorsement has always orbited around buying at discount vs strength.

Remember, a move in a currency exchange rate, in most cases is predicated by the rates differentials between two countries, with some anomalies possible to affect the pricing of the pair short-term, hence why spotting divergences between the pricing and the spread create genuinely solid opportunities.

The fluctuation in government bond yields is mainly a function of two scenarios. It can be based on interest rate expectations or driven by what’s often referred to as a ‘flight to safety’. In the case of the EUR/USD rise, the rise comes as a combination of a Central Bank that hints its bond won’t be yielding at similarly elevated levels in the foreseeable future, and a recent resurgence in risk appetite orchestrated by the Fed Put and the constructive Sino-US talks on trade, which leads to risk appetite flows to also cap the appeal for USDs.

Read Why Bond Yield Spreads Matter When Trading Forex

Economic Data Plays Secondary Role vs Yields

It’s important that we continue to observe the rise in the Euro vs US Dollar exchange rate as a function of US Dollar weakness. One of the reasons that the outlook for the Euro is far from promising, hence, it can’t justify much higher levels on its own right is the appalling economic data coming out of the Eurozone, which calls for a recession in Germany during H2. Judge by yourself in the following heatmap of the Eurozone economic indicators.

1*8fBNd56U9AZDzbFti17KYw.png


source: GlobalPrime, Forexfactory

The constant flattening of the German yield curve, where the short-end duration pays a higher yield than the long-end, something that has become a global phenomenon as global growth estimates fall rapidly, was a clear reminder that in the Euro area, the expectations for the ECB to keep up its promises of an eventual normalization in 2019 look in shaky grounds. But again, this appreciation in the rate is not a Euro strength story.

In the US, the economic data, up until the miss of the US ISM manufacturing PMI, had been overwhelmingly solid, even if some concern were emerging out of the housing data. In the grand scheme of things, labor and consumption figures keep suggesting that the economy is running at full capacity and that the path of least resistance for the Fed was to keep normalizing.

However, ever since the dramatic turn of events in risk conditions in Q4, the Fed had become increasingly subject to determine its policy-setting away from a purely fundamental-driven model to instead account for the tightening of financial conditions, essentially on dependence mode to the deterioration in market sentiment. This resulted in a snowball effect, culminating in the Fed forced to cave in to the demands or signals if you’d like, emanating from the US yield curve and its deep flattening run, the spike in credit spreads, the incessant sell-off of US equities (worst December since 1931), etc.

Broad-Based Evidence US Dollar A Sell On Strength

By analyzing the price action in the DXY, we can clearly start to understand why the movement seen in the last 24h carries a degree of significance unlike recent technical developments. If you, like me, pay attention to high-interest areas by the number of times the level has come to interact with price, then you’ll probably agree that a breakout of 95.70 in the DXY or 1.15 in the Euro vs US Dollar was always going to be a make or break point to monitor.

Read How To Identify Areas Of High Interest In Any Market

1*jhsRC1ZpkpbND5q_UHheKg.png


Paying attention to emerging markets FX also cements an analogous outlook, characteristic by the fragility of the USD, best represented by the bullish outside week candle printed in our EM FX chart on the back of the Fed’s Put. Capital keeps flowing away from USD-denominated assets and into the enhanced allure of emerging currencies on the assertiveness that QT is no longer on ‘auto-pilot’ and while the US-Sino trade rhetoric improves.

1*pK5ev3W3hCokDzJuchWo1g.png


Below, the Euro vs US Dollar reveals more clues that you probably may be aware of, so let’s break down all the clues we can obtain. Firstly, if we were to draw a volume profile that captures the entire length of the range seen, you will notice how the 70% value area was concentrated in a 1 cent box between 1.1330 and 1.1430/40 (slight adjustment to align it with closes). This allows us to draw an internal range. Similarly, we can draw the borders of the recently broken range at the extremes of the volume tapering, with the sell-off through Nov 12 shrugged off given the subsequential double bottom found at the 1.1270 vicinity, suggestive of fair value creeping up. Therefore, the external range could be taken from the mentioned low end up to 1.15.

1*TOndcyN4OT-yCztWHyC97w.png


Why is that important, you may be asking? Firstly, because it allows us to tap into the power of market symmetry to anticipate the next macro target, which should be found at the 100% projection target based on an external range size of about 230 pips. In other words, I am looking circa 1.1730–50 as the area where the current buy-side campaign should mature. However, like any hypothesis, we need to ask ourselves, is this thesis a valid one? If you notice, the first breakout has landed to the pip to the first target of 1.1560, which strengthens the notion of the idea playing out as anticipated.

We can also see observe how the movement in the Euro aligns with both the macro and micro divergence between the German vs US bond yield spread and the pricing of the pair. We can crosscheck the fair value of the EUR/USD from a yield spread perspective by re-anchoring where the pair was trading the last time the bond yield spread was dealt at these levels. This results in a target of around 1.18, although one must bear in mind its dynamic essence, as it depends on the ever-evolving spread. However, as a rough estimate, this target does convey an objective message to justify higher levels from here.

Given that the pair has achieved two consecutive impulsive runs away from its saturated range, we can also ask ourselves a sensible question. At what point would the bullish scenario be negated? The answer here, again, can be found by extracting the information from our risk profile diagram. Notice, the area around 1.14 acted as the most heavily traded level during the span of the range? It’s therefore logical to think that any acceptance sub the mentioned round number would imply a failure back towards the old range dynamics.


Find my latest market thoughts

The Daily Edge: Risk Underpinned By Fed Put, China Trade Talks

0*OTjn4gTqQFO5wDOI


The Daily Edge is authored by Ivan Delgado, Head of Market Research at Global Prime. The purpose of this content is to provide an assessment of the market conditions. The report takes an in-depth look of market dynamics, factoring in fundamentals, technicals, inter-market, futures and options, in order to determine daily biases and assist one’s decisions on a regular basis. Feel free to follow Ivan on Twitter& Youtube.

The State of Affairs in Financial Markets — Jan 14

0*LxivlcKsCBxGCjk6


Following the overstretched pessimism in which we started the year, the short-term relief rally in financial markets keeps on going. A combination of factors keeps supporting the overall risk. The constructive headlines coming out of the Sino-US trade negotiations remains an important development stimulating the risk on tone, with further signs that both parties aim to find a more protracted compromise after the confirmation that the Chinese Vice Premier plans to visit the US by month-end. More to latch on for risk seekers?

The lingering positive effects on the back of the dovish turn at the helm of the Fed continues to play out in favor of risk as well. The wait-and-see narrative is feeding through, sustaining risk. The immediate consequences ever since Fed’s Chairman Powell caved in to the market’s demand for a pause in the normalization process has been to drive the US Dollar lower as the expectations for a long pause in the Fed rate hike cycle and a potential adjustment of its shrinking balance sheet is being factored in the markets.

Besides, there is no doubt that all Fed members are now undeniably on the same camp, pinning words such as patience, flexibility, prudence, on top of their minds when addressing the press. A market-imposed unifying view.

The latest shoe to drop for the dovish rhetoric to go full circle came courtesy of Fed’s Vice Chairman Richard Clarida, who recognized the need for a sustained pause, the moderate improvements in global growth, the tightening of financial conditions or the possibility of shifting course in the Fed’s balance sheet strategy should it be warranted by market events.

Risk appetite conditions have therefore solidified even if we are far from being out of the woods. It’s become obvious for quite some time now that our risk-weighted index has been commanded higher mainly by the recovery in the S&P 500 as the correlation indicates. That’s why one must be mindful that the ES is fast approaching the key make or break point that led to the liquidity event last year. It implies that should sellers find enough value to create a supply imbalance off this area, risk off conditions looks poised to deteriorate again. The behavior in Gold prices also promotes the notion that the market has scaled down its fears, even if the poor performance in the US Dollar means that the bullish trend is far from experiencing a technical compromise. The yellow metal has taken a pause on its bullish momentum after reaching its 100% projected target ahead of $1.3k.

0*FCPexx-prPvX4ux4


Some critical technical cracks in the US Dollar index (DXY), the EUR/USD as a proxy or the Chinese Yuan have manifested as a consequence of the dovish turn by the Fed even if the Euro has shown a lack of impetus beyond 1.15. The run in economic data out of the Eurozone has been atrocious, and it has become blatantly clear that it’s the countries at the core of the Union (Germany, France) that no longer can hide their miseries either as recently shown by the appalling industrial production figures, which adds to the existing weakening trends in the manufacturing sector. Throw into the mix the revolts in France by the yellow vest protesters, now in the hundreds of thousands, and the outlook gets even gloomier for Europe.

ECB’s Draghi is due to testify on the ECB’s 2017 Annual Report before the European Parliament, and one wonders, with the obvious economic data, if he could walk back his over-optimism. As in the case of the Fed, it seems only a matter of time until the ECB adopts a more realistic view of present market conditions, which may further undermine the outlook for a late-year rate hike. Once the ECB starts to highlight the risk in the EZ from ‘broadly balanced’ to ‘titled to the downside’ in coming meetings, that’s when the market will get the evidence it needs to price out a 2019 normalization.

If we were to witness further weakness in the US Dollar, especially if it comes combined with an increase in volatility in financial markets via renewed selling in global equities, a theme that we must pay very close attention is the reduction in USD-denominated carry-motivated flows. US money markets have seen a massive increase in foreign holdings via EUR, JPY funding to take advantage of the rate differentials. If the volatility resumes again, the reduction in the carry trade exposure could keep pushing the USD into new lows, acting as an accelerant of the structural weakness present.

A risk to be aware of that may eventuate in further USD fragility due to the prolonged US government shutdown since this Saturday officially the longest in history. According to Fox Business, Trump is looking to end the impasse with a government emergency declaration soon. There are many legal question marks on whether or not this move would be even lawful.

Andreas Steno Larsen, Senior Global FX/FI Strategist at Nordea Markets, commented on this underlying risk for the USD in Q1 last week:

“The likely upcoming debt ceiling excess liquidity surge is interesting, as liquidity developments will then be at odds with Feds balance sheet trend.” The increase on liquidity due to the adjustments required by the Treasury may translate in USD weakness.

0*_AgXxO8Z6djTUUUS


The run-up in the Chinese Yuan is critically important to monitor too, as it only makes the need for China to reach a trade deal with the US a more compelling outcome to achieve in order to address its economic slowdown. The entire world is keeping a close eye on how the talks evolve as calls for a global recession, make no mistake, do come driven by the significant loss of momentum in China. All countries are dependable of the initial psychological/sentiment impact and the subsequent potentially positive economic ramifications that a Chinese trade deal with the US would exhibit.

The Chinese government, via its different state-control arms, has enacted a new set of stimulatory policies, including a 1% cut in its banks’ reserve requirement ratios to try to stimulate the economy, which remains in a state of disarray as the trend in the Chinese QoQ economic indicators indicate (vehicles sales, industrial productions, fixed asset investments, trade activity).

There are a number of reasons to expect higher volatility this week. Firstly, UK PM May is set to finally face the meaningful vote of the Brexit deal, with the prospects of a defeat running very high. It’s been reported that over 200 MPs may oppose to the drafted deal negotiated with the EU.

The question, therefore, becomes what next? Judging by the performance in the Sterling, there seems to be a growing line of thinking that is buying into the notion that the UK will eventually manage to negotiate an extension of article 50, even if at this stage, with the EU not willing to cave in to further concessions, it means simply delaying the inevitable. One could argue that some glimmers of hopes over a 2nd referendum on Brexit, even if misplaced by the lack of any evidence, have been priced into the latest GBP run up. If the idea of an article 50 extension starts to dissipate to instead resolve the current conundrum via a hard Brexit by late March, the Sterling should suffer.

Another volatility accelerant this week includes the US earnings season getting underway, with traditional banks the highlights, including JP Morgan, Bank of America, Goldman Sachs to name a few. If we were to focus on other events to drive sentiment, today’s China’s trade balance offers an excellent opportunity to keep assessing the state of affairs in China.


Charts Insights: What Are You Missing?

EUR/USD — Bullish Structure Despite Latest Setback

0*XMAVRmvGw2Ne9xUq


The breakout of the saturated range structure last week has so far failed to find follow through. My bullish bias and long exposure remain undeterred nonetheless, as the trade ticks enough boxes to remain committed to the long-bias. On the daily chart, we can clearly observe that the bullish resolution comes in line with the divergence in the German vs US bond yield spread, which argues for any retest of the previous area of resistance (on a closing basis) at 1.1440–50 an exceptional area to consider engaging in long-side business. By drawing the volume profile, clear symmetries emerge, allowing us to identify the POC of the multi-month range at 1.1375 area with the extremes at 1.1307–1.1448, hence why it’s so vitally important to hold the latter for the uptrend to resume. This constructive outlook comes in stark contrast with the European fundamentals, but as I’ve argued, this is a movement led by broad-based USD weakness. Also notice, last week’s close beyond 1.15 achieved the creation of a fresh bullish cycle high, with the extension from Jan 3rd low to the recent high greater in magnitude (260 pips) than the previous leg up of 207 pips. This bullish structure has emerged on the back of a debilitating bearish structure seen from Oct to Nov of 2018.

GBP/USD — Decoupling From DXY Ahead Of Brexit Vote

0*VJyCY8DCFEmQOGMf


Friday’s bullish outside day has shifted the focus towards further upside. The breakout occurs despite the weakness present in the EUR/USD in the last 2 days, clearly implying that this GBP-centric move is predicated on the hopes that a positive Brexit outcome may emerge this week in the form of an extension of the article 50. On the lower windows, you can observe the decoupling of the GBP/USD with the EUR/USD in a magenta line. The bullish breakout of the sticky resistance at 1.28 (POC November) alongside the rising UK vs US bond yield spread does reinforce the view that short-term bullish risk exists, even if one must be mindful that vol is set to pick up substantially from Jan 15 when the UK parliament is set to move forward with the Brexit meaningful vote. Any setbacks now face 3 critical macro areas at 1.28–2785, followed by 1.2712 ahead of the Dec POC at 1.2650–55.

USD/JPY — Bullish Reversals Off Market Makers Territory

0*TswgWP4f1DH1bpkC


Again, this is a market where market symmetries can assist us to determine our short-term bias. Ever since the recovery above 108.40 (100% proj target), the daily price action has provided enough evidence of this area being actively traded by market makers and short-term momentum accounts looking to adjust valuations. The upward slope in the 5-day moving average is another positive input I am personally factoring in. The last 2 daily prints, trapping volume to the downside while achieving bullish closes is a clear reminder that upward risks are building up as long as the risk environment remains sustained. I am personally holding a near-term long bias in this market, as the achievement of the projected target of 100% has been backed by price action and sustainable risk. I remain very versatile to change my views to bearish if we can achieve a close sub 108.40 with a deterioration in the risk tone. If this scenario eventuates, a potential resumption of the downtrend is on the cards.

Options — 25 Delta RR & Vols

0*EeqzA9kEXd6LKTFV


* The 25-delta risk reversal is the result of calculating the vol of the 25 delta call and discount the vol of the 25 delta put. … A positive risk reversal (calls vol greater than puts) implies a ‘positively’ skewed distribution, in other words, an underperformance of longs via spot. The analysis of the 25-delta risk reversals, when combined with different time measures of implied volatility, allows us to factor in more clues about a potential direction. If the day to day pricing of calls — puts increases while there is an anticipation of greater vol, it tends to be a bullish signal to expect higher spot prices.

Source:
http://cmegroup.quikstrike.net (The RR settles are ready 1am UK).

Options — Ratio Imp/Hist Vol
0*PM2OQQPrzoRRh5zB


Find below today’s implied / historical vol levels.


* If implied vol is below historical vol, represented by a ratio < 1% in the table above, the market tends to seek equilibrium by being long vega (volatility) via the buying of options. This is when gamma scalping is most present to keep positions delta neutral, which tends to result in markets more trappy/rotational. On the contrary, if implied vol is above historical vol, represented by a ratio > 1%, we are faced with a market that carries more unlimited risks given the increased activity to sell expensive volatility (puts), hence why it tends to result in a more directional market profile when breaks occur. The sellers of puts must hedge their risk by selling on bearish breakouts and vice versa.

Like What You See?
Soon you will be able to subscribe to receive ‘the daily edge’. In the meantime, feel free to follow Ivan on Twitter.

Important Footnotes
  • Risk model: The fact that financial markets have become so intertwined and dynamic makes it essential to stay constantly in tune with market conditions and adapt to new environments. This prop model will assist you to gauge the context that you are trading so that you can significantly reduce the downside risks. To understand the principles applied in the assessment of this model, refer to the tutorial How to Unpack Risk Sentiment Profiles
  • Cycles: Markets evolve in cycles followed by a period of distribution and/or accumulation. The weekly cycles are highlighted in red, blue refers to the daily, while the black lines represent the hourly cycles. To understand the principles applied in the assessment of cycles, refer to the tutorial How To Read Market Structures In Forex
  • POC: It refers to the point of control. It represents the areas of most interest by trading volume and should act as walls of bids/offers that may result in price reversals. The volume profile analysis tracks trading activity over a specified time period at specified price levels. The study reveals the constant evolution of the market auction process. If you wish to find out more about the importance of the POC, refer to the tutorial How to Read Volume Profile Structures
  • Tick Volume: Price updates activity provides great insights into the actual buy or sell-side commitment to be engaged into a specific directional movement. Studies validate that price updates (tick volume) are highly correlated to actual traded volume, with the correlation being very high, when looking at hourly data. If you wish to find out more about the importance tick volume, refer to the tutorial on Why Is Tick Volume Important To Monitor?
  • Horizontal Support/Resistance: Unlike levels of dynamic support or resistance or more subjective measurements such as fibonacci retracements, pivot points, trendlines, or other forms of reactive areas, the horizontal lines of support and resistance are universal concepts used by the majority of market participants. It, therefore, makes the areas the most widely followed and relevant to monitor. The Ultimate Guide To Identify Areas Of High Interest In Any Market
  • Trendlines: Besides the horizontal lines, trendlines are helpful as a visual representation of the trend. The trendlines are drawn respecting a series of rules that determine the validation of a new cycle being created. Therefore, these trendline drawn in the chart hinge to a certain interpretation of market structures.
  • Correlations: Each forex pair has a series of highly correlated assets to assess valuations. This type of study is called inter-market analysis and it involves scoping out anomalies in the ever-evolving global interconnectivity between equities, bonds, currencies, and commodities. If you would like to understand more about this concept, refer to the tutorial How Divergence In Correlated Assets Can Help You Add An Edge.
  • Fundamentals: It’s important to highlight that the daily market outlook provided in this report is subject to the impact of the fundamental news. Any unexpected news may cause the price to behave erratically in the short term.
  • Projection Targets: The usefulness of the 100% projection resides in the symmetry and harmonic relationships of market cycles. By drawing a 100% projection, you can anticipate the area in the chart where some type of pause and potential reversals in price is likely to occur, due to 1. The side in control of the cycle takes profits 2. Counter-trend positions are added by contrarian players 3. These are price points where limit orders are set by market-makers. You can find out more by reading the tutorial on The Magical 100% Fibonacci Projection


Back
Top