Sive Morten
Special Consultant to the FPA
- Messages
- 18,669
Fundamentals
There were not much new events on previous week and situation has not changed drastically. As we’ve discussed since mid of May there are some wind of change in Gold market appears. We do not know currently will it lead to long term trend continuation or to just a deep bounce up, but these changes have as fundamental as tehcnical foundation and upward action on gold market is not a surprise for us.
As Reuters reports - gold rose on Friday on an oil rally and falling U.S. equities, with bullion notched a second consecutive weekly gain due to uncertainty over when the U.S. Federal Reserve will reduce its economic stimulus policy. Speculation the central bank could start tapering its $85 billion monthly bond purchases as soon as next month knocked gold to a three-week low earlier this week. But there was no consensus among Fed policymakers about the exact timing on when to end the program. On Friday, government data showed U.S. wholesale inventories unexpectedly fell for a second straight month in June, prompting economists to trim their growth estimates. Gold reversed earlier losses as U.S. equities fell and were set for their worst week since June. Investors found few reasons to buy with equity prices near record levels. "We are seeing some flight-of-safety bids in gold as the S&P turns. That has a lot to do with the recognition that (the Fed's quantitative easing) will continue as the economic numbers are not supporting the reduction of QE," said Jeffrey Sica, chief investment officer of Sica Wealth Management, which oversees more than $1 billion in client assets. Oil prices gained amid supply disruptions in the Middle East and signs of rising Chinese demand, increasing bullion's inflation-hedge appeal. On chart, gold ended just below a key resistance at its 55-day average around $1,319 an ounce. "Prices appear to be working on some type of bullish reversal formation ... We think gold is set up to break above resistance in the mid-$1,300 region, taking prices over $1,450," said Mark Arbeter, chief technical strategist at S&P Capital IQ.
As a gauge of investment demand, gold-backed exchange-traded funds had more outflows, however. Holdings of the world's largest gold ETF SPDR Gold Trust fell 1.2 tonnes on Thursday. But this outflow is nothing compares what we see in April and May. SPDR has lost around 450 tonnes since the beginning of the year. Currently the tendency to outflow is significantly slowed.
Recent CFTC data shows small reducing of speculative net longs and shy growth of Open Interest, but as you can see on the chart overall changes are shy and we could say that on passed week these data mostly stand flat.
 Thus, now we can just confirm that past week in general stands with our long-term expectations. Although overall long-term bearish sentiment still holds, but in nearest months we could get significant upward bounce on gold market and we have to be ready to use it. Also this is a sentiment tricks and we’ve pointed on them in details – market could turn, when everybody bearish. Recent speeches of investors and analysts here and there point that market participants gradually have started to change their assessment of gold market and more and more traders now start to talk and think that market may be indeed oversold.
We see the results of this in Gold price action. Until market will not take out previous lows around 1180 area – bear trend will not be continued.
Monthly
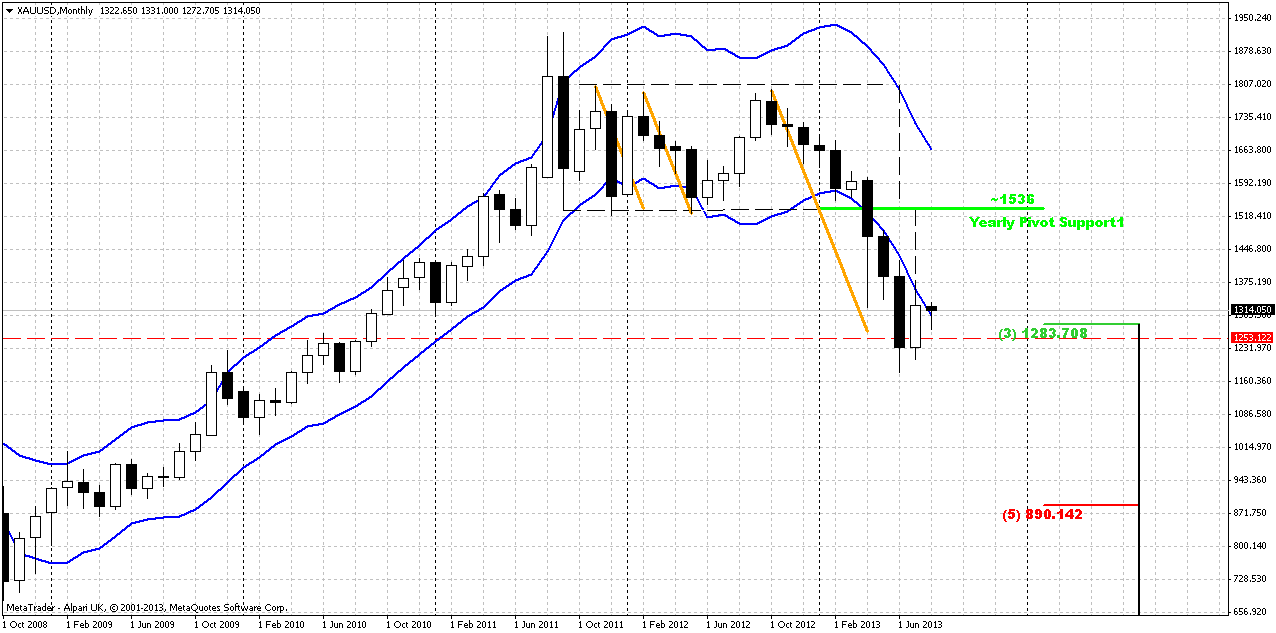
Well, situation changes slowly here. We keep in mind Volatility breakout pattern and know that there will be 3-leg downward action. This means that current bounce will be just retracement probably. Second, currently we know that market at support – Fib support, target of rectangle breakout, completion of harmonic swing down and monthly deep oversold. Market has formed shy upward candle here that currently does not look like as challenge on solid retracement up yet. Thus, unfortunately monthly chart does not give us much assistance. One bullish pattern that probably could be seen here is bullish DiNapoli “Stretch” pattern, since market stands at deep oversold right at Fib support. Thus, this is not the time to take long-term short position, but time to think about their close and searching for bullish patterns on lower time frames – weekly and daily. Target of this pattern is a middle between Oscillator Predictor Bands – right around 1550$ area. S&P analyst specifies approximately the same target – “above 1450”. This area agrees with “Stretch” pattern as well. August candle is very small by far, but take a look – market gradually move out from oversold condition…
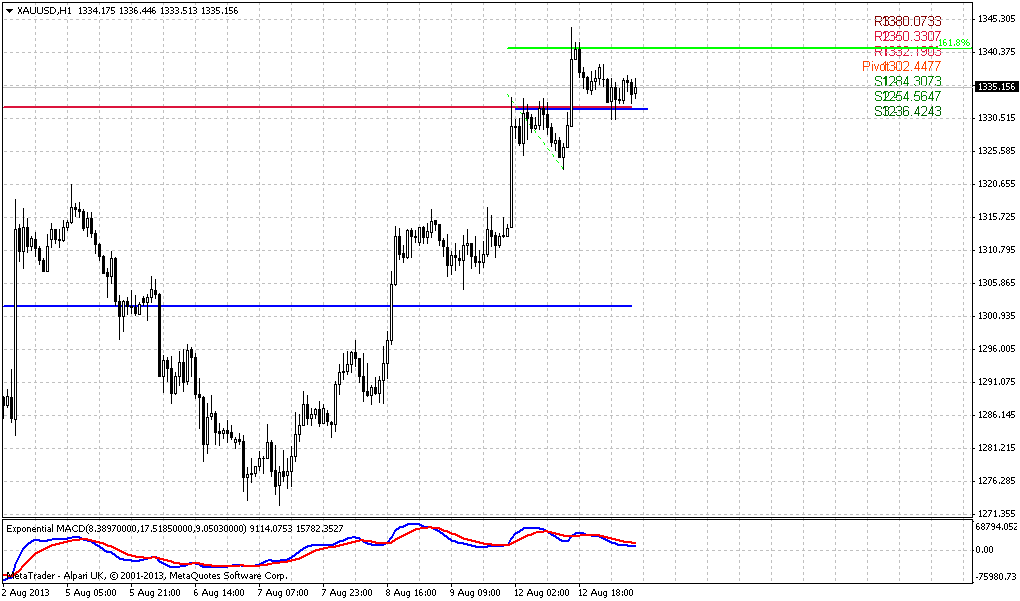
Weekly
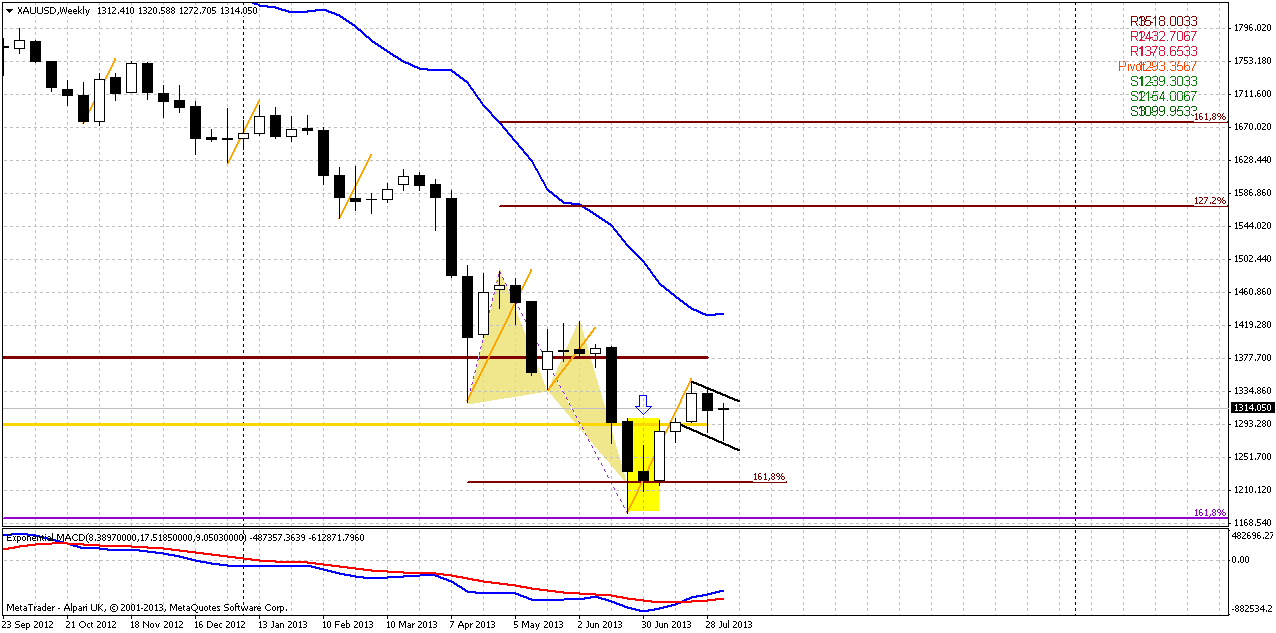
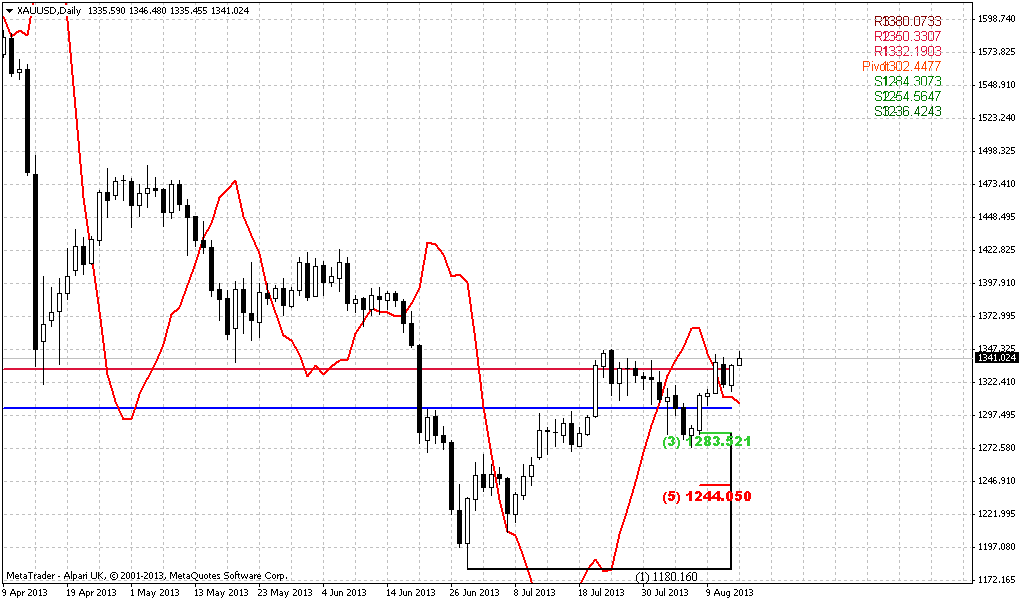
Situation on weekly time frame is almost similar to previous week. First is it reinforces current support by Agreement. Market has hit 1.618 extension target as well from AB=CD pattern that is based on all-times high. Thus, support level currently is really solid. Second, take a look – within current move down since September 2012 market never breaks the harmonic swing of retracement. Only once it has shown double swing – that was in April by the way, right after miserable plunge, and….now. Market pips to pips stands at the top of double harmonic swing, and it should be exceeded to confirm markets’ bullish ambitions. Next moment is August pivot – gold already has tested it and price stands above it. This is good bullish issue. At the same time placement of MPS1 is very favorable for us, since it almost coincides with lows of morning star pattern. If market will pass through it – this could mean that bearish trend is continue. Trend has turned bullish here, by the way, and market is not at overbought. And yes, also we have a butterfly “buy” that in fact launch current bounce up.
Third week in a row market is forming small candles that start to gather into consolidation. By shape this consolidation begins to remind flag pattern. This is normal action after market has formed some pattern. In our case this is morning star. Although overall picture is not a superb, but at least it does not go against bullish assessment of current situation and gives no signs of it’s cancelling yet. And I think that we can gently apply word “bullish” to weekly time frame. If you will take a look at price action since October 2012, you’ll see that market never has formed some flag or pennant pattern after upward bounce – only after down move. Current action within most recent 5-7 weeks is different compares to previous one. And trend never has turned bullish by MACD within this time. Now we have bullish trend on weekly.
Conclusion on weekly time frame – context is moderately bullish, but too unstable and weak. Still this is very often happens, when market has just started the reversing procedure. Let’s see what will happen next…
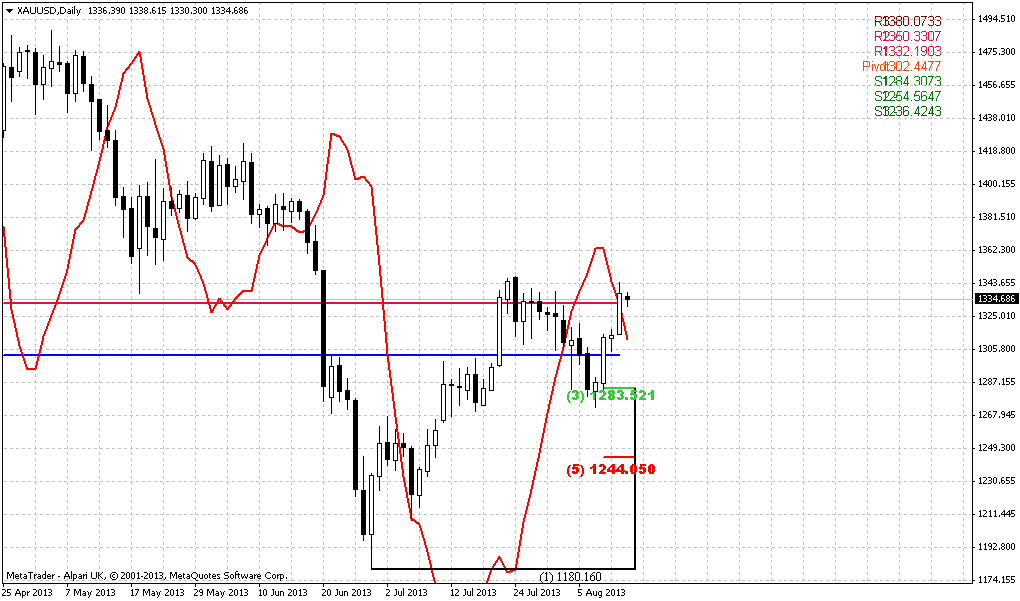
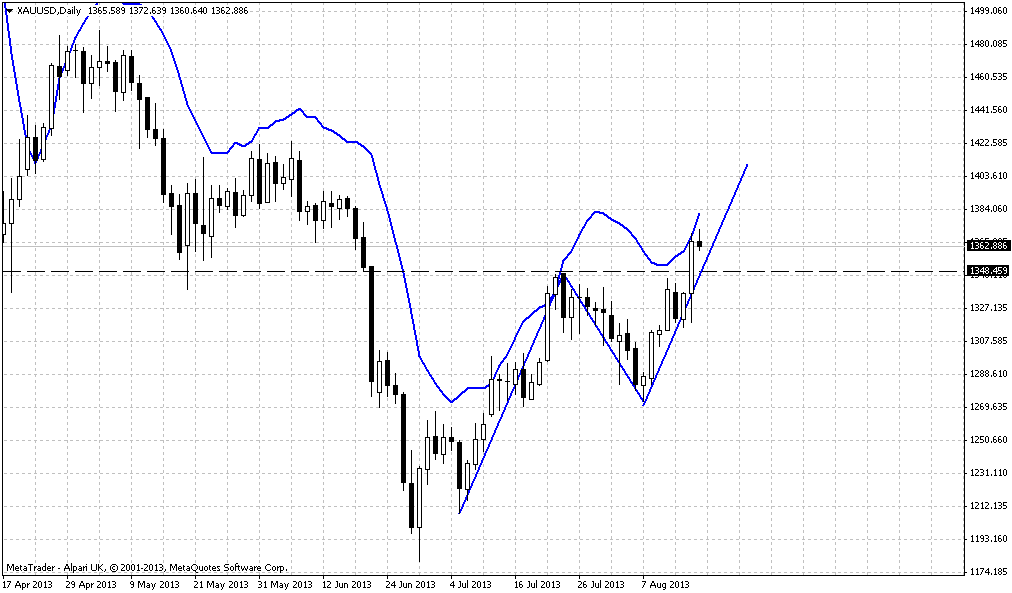
Daily
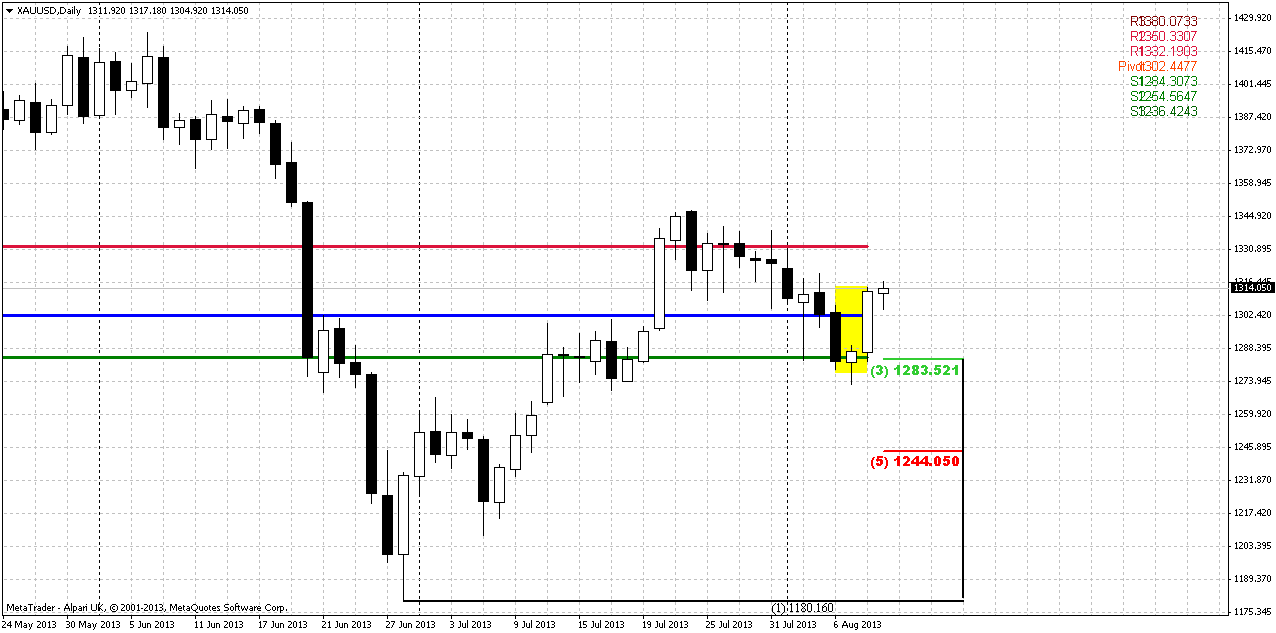
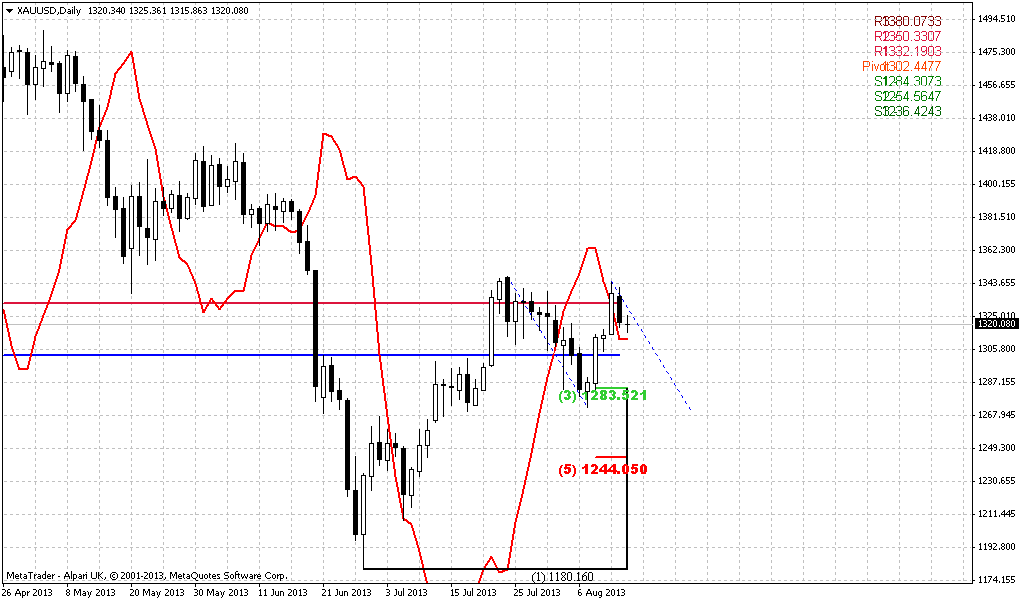
Situation on daily is rather simple, mostly due lack of issues for trading and patterns that we could stick with. Trend is bearish here, but price has closed above WPP on previous week and WPS1 has held retracement down. That could become a sign that bullish trend is still intact here and market could continue move up.
Actually we have only one pattern, but it gives us all that we need to understand situation. First – when we can say that downtrend is reestablished? Answer is – when market will take out the lows of our morning star pattern. These lows by the way coincide with WPS1 again and Fib support. Next question is – where the minimum target of this pattern. Answer – minimum target equals the length of the bars of the pattern. Thus, it stands somewhere around previous highs 1340-1345 area. And final question – how we can open position with this pattern. Answer is on some retracement inside the body of this pattern. Preferably, if market will hold above WPP – just will test it and continue move up.
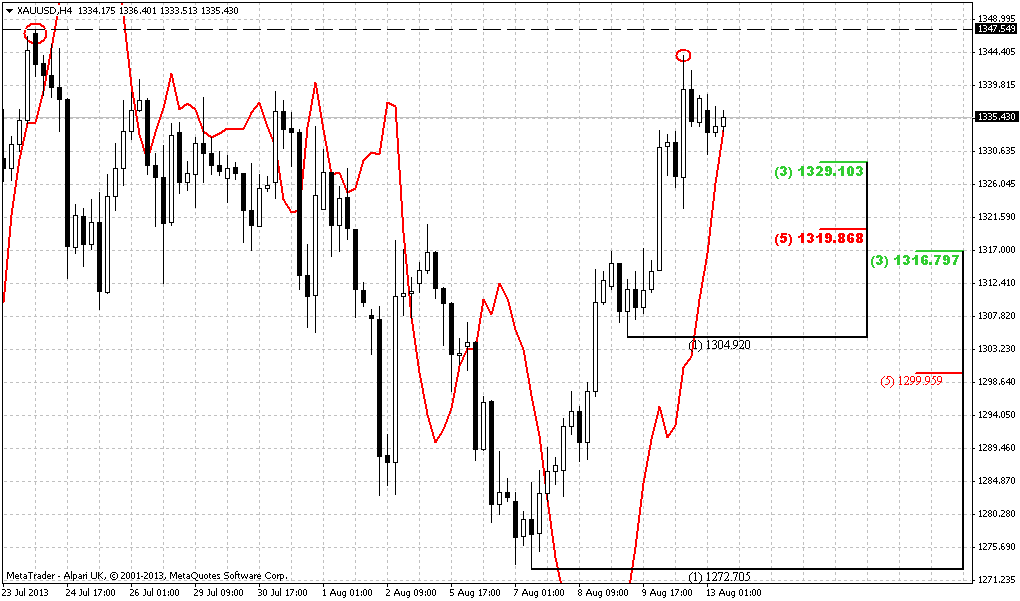
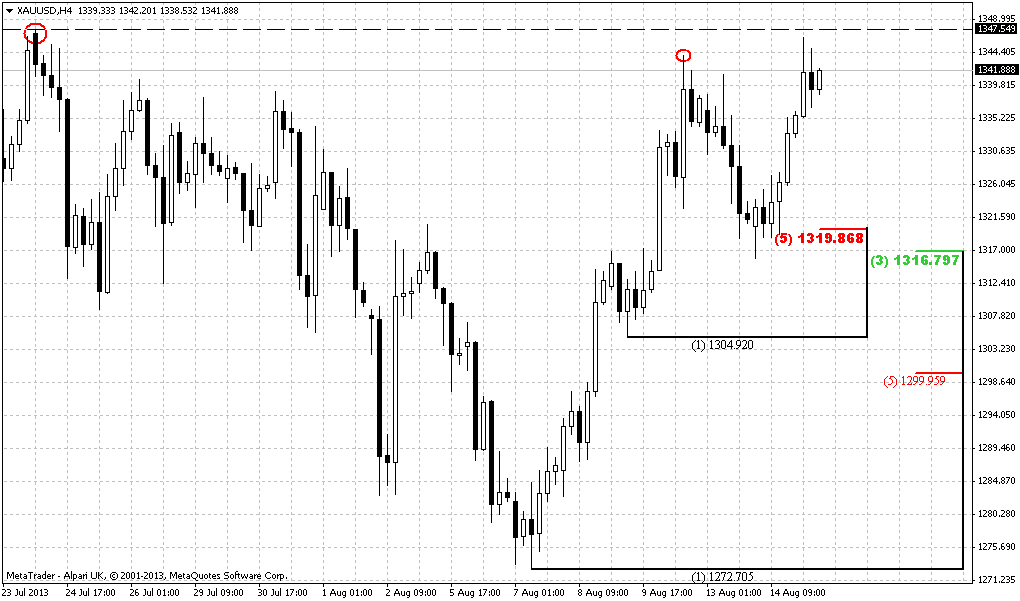
4-hour
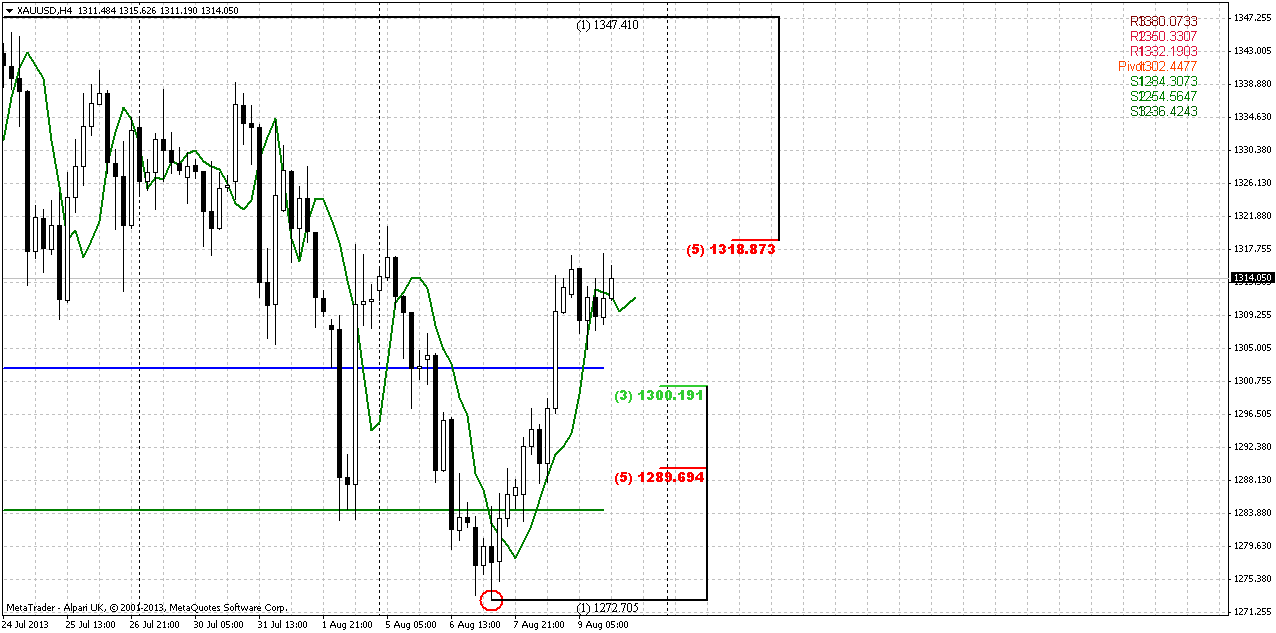
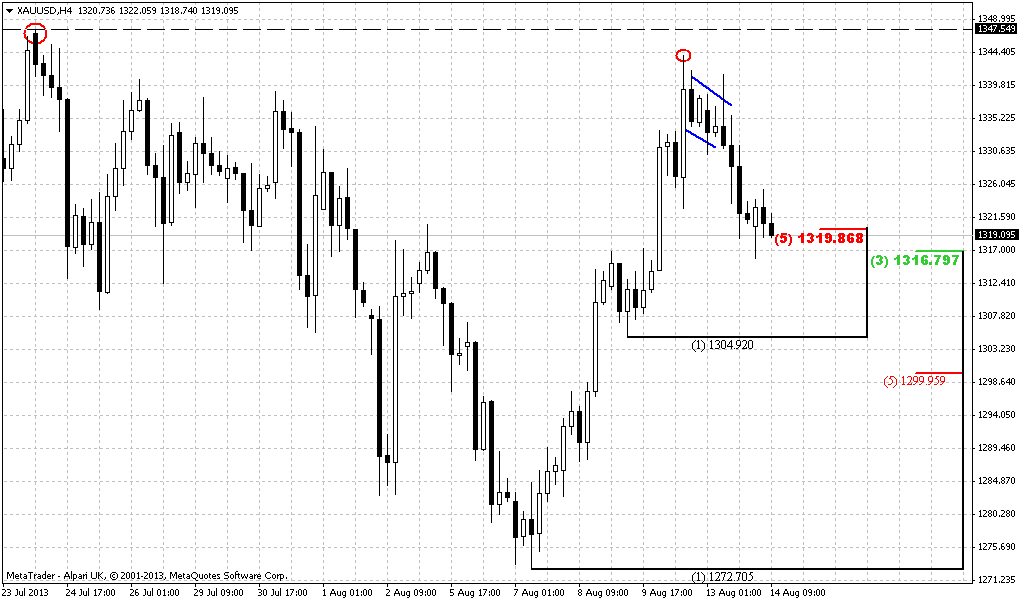
On this picture we can see some trap is forming for those who would like enter long as soon as possible. Recall that on Friday we’ve talked about possible retracement down, since market stands at resistance and completed some intraday extension targets. As we have more or less suitable thrust up – the pattern that could trigger downward bounce will be either DRPO “Sell” or B&B “Buy”. But now, as Friday has closed we can say that it could be only DRPO if price will close below 3x3 DMA (green line) again. Now you can ask – how this relates to speech about possible trap? Directly. DRPO suggests deeper retracement, at minimum to 50% support level. Gold itself likes to show deep retracement. Don’t forget that current move up is the first one after solid action to the downside, that why market still has bearish momentum and in such sircumstances market usually shows deeper retracements. Hence, despite how we like 1300 level – agreement of Fib support and WPP, but I suspect that we will get deeper move. Still, we need to get DRPO confirmation first...
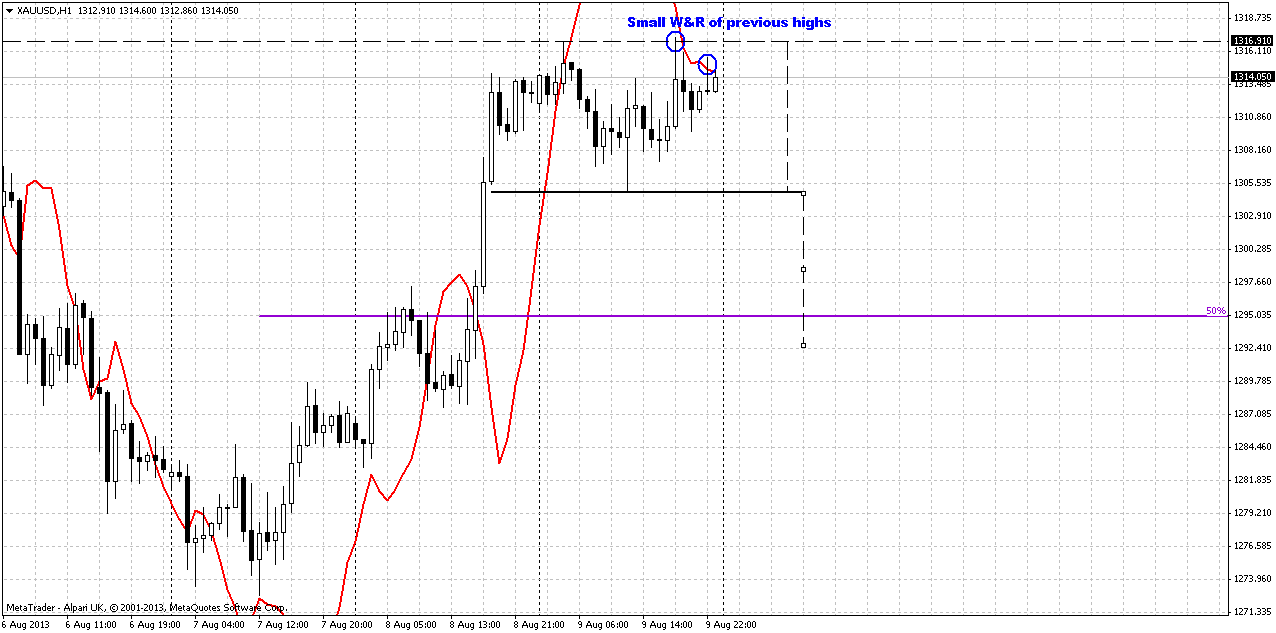
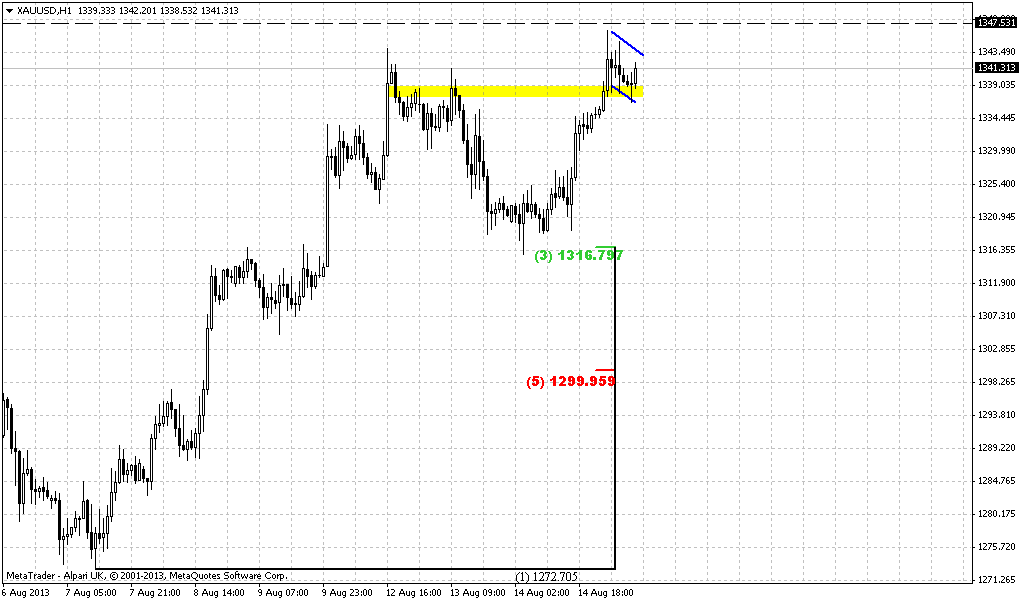
1-hour
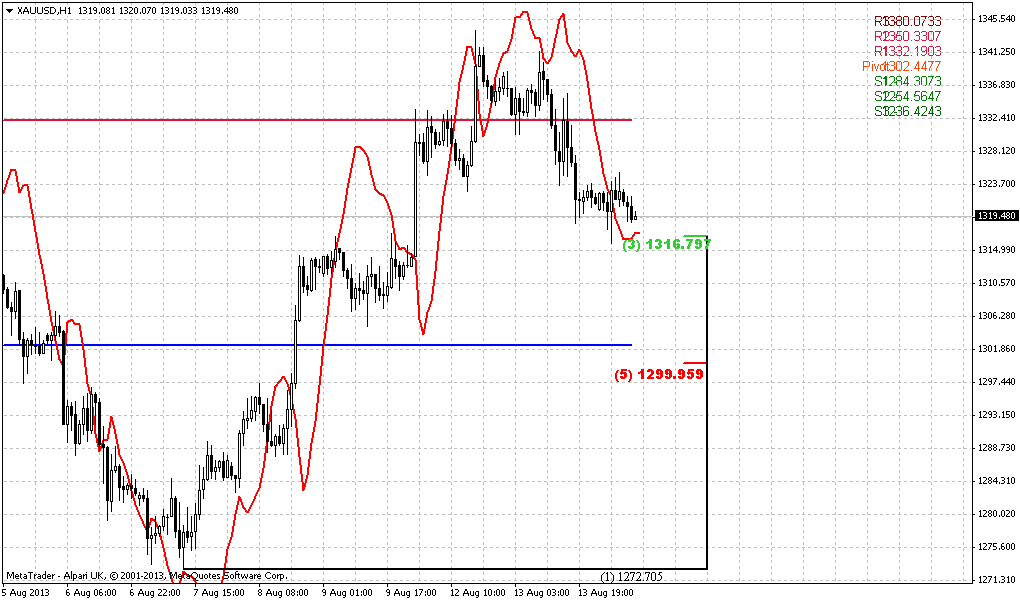
We can’t predict definitely what will happen here, but very probable that DRPO could take the shape of Double Top pattern here. Hardly it will be butterfly, since market has shown shy W&R of previous highs, that is more typical for Double Top pattern. Second moment – market has formed bearish stop grabber that assumes some downward action. If it will really turn as we suggest, the target of this patterns stands around 1290 area and coincides with theoretical target of DRPO pattern. That’s being said, on Monday we need to monitor development with DRPO “Sell” and what shape it will take on hourly chart.
Conclusion:
Technically and fundamentally gold market stands in long-term bearish motion, but there are more and more factors start to appear that make downward action as not as cloudless as it was recently. Also we’ve got VOB pattern that gives us forecast for long-term price behavior and promise compounded downward move in shape of some AB-CD. Now major question in big picture – is when and how BC up leg will start. WE have some suspicions that it has started already, but we feel some lack of confirmation still, since signs are too shy. As a result, we do not know just yet – is current move up is just a minor bounce or something bigger. Fundamentally some supportive factors have appeared, and this could shift to greater retracement.
Most recent action shows that upward move could continue after some retracement in the beginning of the next week. Retracement could take a shape of DRPO “Sell” pattern on 4-hour chart that could lead market to 1290 area. Thus, scalpers could think about short entry by DRPO, while others should monitor 1290 area for long entry.
The technical portion of Sive's analysis owes a great deal to Joe DiNapoli's methods, and uses a number of Joe's proprietary indicators. Please note that Sive's analysis is his own view of the market and is not endorsed by Joe DiNapoli or any related companies.
There were not much new events on previous week and situation has not changed drastically. As we’ve discussed since mid of May there are some wind of change in Gold market appears. We do not know currently will it lead to long term trend continuation or to just a deep bounce up, but these changes have as fundamental as tehcnical foundation and upward action on gold market is not a surprise for us.
As Reuters reports - gold rose on Friday on an oil rally and falling U.S. equities, with bullion notched a second consecutive weekly gain due to uncertainty over when the U.S. Federal Reserve will reduce its economic stimulus policy. Speculation the central bank could start tapering its $85 billion monthly bond purchases as soon as next month knocked gold to a three-week low earlier this week. But there was no consensus among Fed policymakers about the exact timing on when to end the program. On Friday, government data showed U.S. wholesale inventories unexpectedly fell for a second straight month in June, prompting economists to trim their growth estimates. Gold reversed earlier losses as U.S. equities fell and were set for their worst week since June. Investors found few reasons to buy with equity prices near record levels. "We are seeing some flight-of-safety bids in gold as the S&P turns. That has a lot to do with the recognition that (the Fed's quantitative easing) will continue as the economic numbers are not supporting the reduction of QE," said Jeffrey Sica, chief investment officer of Sica Wealth Management, which oversees more than $1 billion in client assets. Oil prices gained amid supply disruptions in the Middle East and signs of rising Chinese demand, increasing bullion's inflation-hedge appeal. On chart, gold ended just below a key resistance at its 55-day average around $1,319 an ounce. "Prices appear to be working on some type of bullish reversal formation ... We think gold is set up to break above resistance in the mid-$1,300 region, taking prices over $1,450," said Mark Arbeter, chief technical strategist at S&P Capital IQ.
As a gauge of investment demand, gold-backed exchange-traded funds had more outflows, however. Holdings of the world's largest gold ETF SPDR Gold Trust fell 1.2 tonnes on Thursday. But this outflow is nothing compares what we see in April and May. SPDR has lost around 450 tonnes since the beginning of the year. Currently the tendency to outflow is significantly slowed.
Recent CFTC data shows small reducing of speculative net longs and shy growth of Open Interest, but as you can see on the chart overall changes are shy and we could say that on passed week these data mostly stand flat.
We see the results of this in Gold price action. Until market will not take out previous lows around 1180 area – bear trend will not be continued.
Monthly
Well, situation changes slowly here. We keep in mind Volatility breakout pattern and know that there will be 3-leg downward action. This means that current bounce will be just retracement probably. Second, currently we know that market at support – Fib support, target of rectangle breakout, completion of harmonic swing down and monthly deep oversold. Market has formed shy upward candle here that currently does not look like as challenge on solid retracement up yet. Thus, unfortunately monthly chart does not give us much assistance. One bullish pattern that probably could be seen here is bullish DiNapoli “Stretch” pattern, since market stands at deep oversold right at Fib support. Thus, this is not the time to take long-term short position, but time to think about their close and searching for bullish patterns on lower time frames – weekly and daily. Target of this pattern is a middle between Oscillator Predictor Bands – right around 1550$ area. S&P analyst specifies approximately the same target – “above 1450”. This area agrees with “Stretch” pattern as well. August candle is very small by far, but take a look – market gradually move out from oversold condition…
Weekly
Situation on weekly time frame is almost similar to previous week. First is it reinforces current support by Agreement. Market has hit 1.618 extension target as well from AB=CD pattern that is based on all-times high. Thus, support level currently is really solid. Second, take a look – within current move down since September 2012 market never breaks the harmonic swing of retracement. Only once it has shown double swing – that was in April by the way, right after miserable plunge, and….now. Market pips to pips stands at the top of double harmonic swing, and it should be exceeded to confirm markets’ bullish ambitions. Next moment is August pivot – gold already has tested it and price stands above it. This is good bullish issue. At the same time placement of MPS1 is very favorable for us, since it almost coincides with lows of morning star pattern. If market will pass through it – this could mean that bearish trend is continue. Trend has turned bullish here, by the way, and market is not at overbought. And yes, also we have a butterfly “buy” that in fact launch current bounce up.
Third week in a row market is forming small candles that start to gather into consolidation. By shape this consolidation begins to remind flag pattern. This is normal action after market has formed some pattern. In our case this is morning star. Although overall picture is not a superb, but at least it does not go against bullish assessment of current situation and gives no signs of it’s cancelling yet. And I think that we can gently apply word “bullish” to weekly time frame. If you will take a look at price action since October 2012, you’ll see that market never has formed some flag or pennant pattern after upward bounce – only after down move. Current action within most recent 5-7 weeks is different compares to previous one. And trend never has turned bullish by MACD within this time. Now we have bullish trend on weekly.
Conclusion on weekly time frame – context is moderately bullish, but too unstable and weak. Still this is very often happens, when market has just started the reversing procedure. Let’s see what will happen next…
Daily
Situation on daily is rather simple, mostly due lack of issues for trading and patterns that we could stick with. Trend is bearish here, but price has closed above WPP on previous week and WPS1 has held retracement down. That could become a sign that bullish trend is still intact here and market could continue move up.
Actually we have only one pattern, but it gives us all that we need to understand situation. First – when we can say that downtrend is reestablished? Answer is – when market will take out the lows of our morning star pattern. These lows by the way coincide with WPS1 again and Fib support. Next question is – where the minimum target of this pattern. Answer – minimum target equals the length of the bars of the pattern. Thus, it stands somewhere around previous highs 1340-1345 area. And final question – how we can open position with this pattern. Answer is on some retracement inside the body of this pattern. Preferably, if market will hold above WPP – just will test it and continue move up.
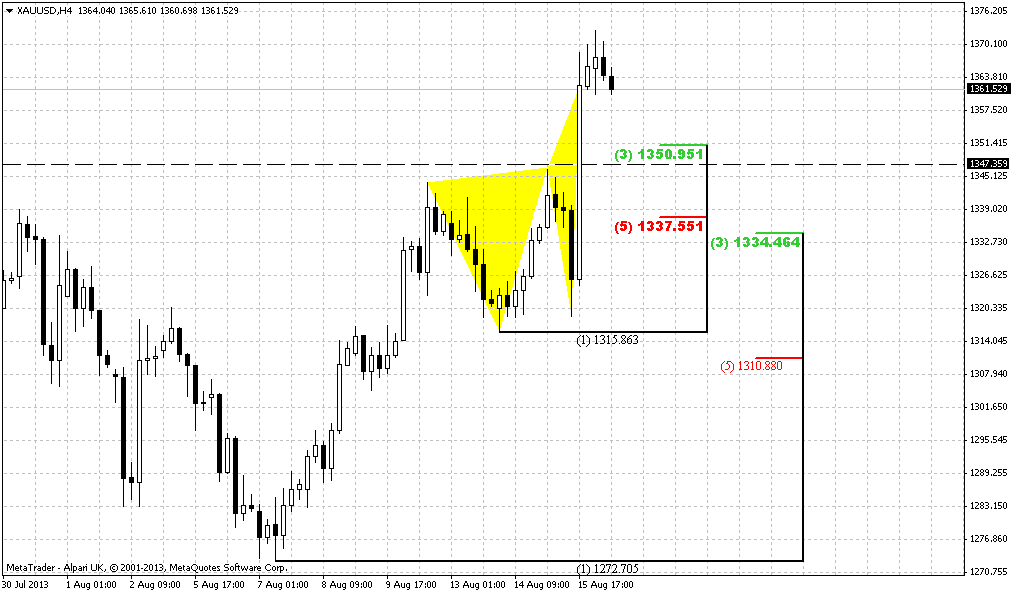
4-hour
On this picture we can see some trap is forming for those who would like enter long as soon as possible. Recall that on Friday we’ve talked about possible retracement down, since market stands at resistance and completed some intraday extension targets. As we have more or less suitable thrust up – the pattern that could trigger downward bounce will be either DRPO “Sell” or B&B “Buy”. But now, as Friday has closed we can say that it could be only DRPO if price will close below 3x3 DMA (green line) again. Now you can ask – how this relates to speech about possible trap? Directly. DRPO suggests deeper retracement, at minimum to 50% support level. Gold itself likes to show deep retracement. Don’t forget that current move up is the first one after solid action to the downside, that why market still has bearish momentum and in such sircumstances market usually shows deeper retracements. Hence, despite how we like 1300 level – agreement of Fib support and WPP, but I suspect that we will get deeper move. Still, we need to get DRPO confirmation first...
1-hour
We can’t predict definitely what will happen here, but very probable that DRPO could take the shape of Double Top pattern here. Hardly it will be butterfly, since market has shown shy W&R of previous highs, that is more typical for Double Top pattern. Second moment – market has formed bearish stop grabber that assumes some downward action. If it will really turn as we suggest, the target of this patterns stands around 1290 area and coincides with theoretical target of DRPO pattern. That’s being said, on Monday we need to monitor development with DRPO “Sell” and what shape it will take on hourly chart.
Conclusion:
Technically and fundamentally gold market stands in long-term bearish motion, but there are more and more factors start to appear that make downward action as not as cloudless as it was recently. Also we’ve got VOB pattern that gives us forecast for long-term price behavior and promise compounded downward move in shape of some AB-CD. Now major question in big picture – is when and how BC up leg will start. WE have some suspicions that it has started already, but we feel some lack of confirmation still, since signs are too shy. As a result, we do not know just yet – is current move up is just a minor bounce or something bigger. Fundamentally some supportive factors have appeared, and this could shift to greater retracement.
Most recent action shows that upward move could continue after some retracement in the beginning of the next week. Retracement could take a shape of DRPO “Sell” pattern on 4-hour chart that could lead market to 1290 area. Thus, scalpers could think about short entry by DRPO, while others should monitor 1290 area for long entry.
The technical portion of Sive's analysis owes a great deal to Joe DiNapoli's methods, and uses a number of Joe's proprietary indicators. Please note that Sive's analysis is his own view of the market and is not endorsed by Joe DiNapoli or any related companies.
")