GOLD PRO Weekly August 12-16, 2013

forgot to add... i'd also watch for a DRPO SELL on H1, unless it's straight down from here and we get a B&B BUY but this is already the 3rd candle under the 3x3 SMA, so.... (i'm hoping an upper TP around 1,370.0 :D (if we breach all the RSST levels in-between, of course).
 
forgot to add... i'd also watch for a DRPO SELL on H1, unless it's straight down from here and we get a B&B BUY but this is already the 3rd candle under the 3x3 SMA, so.... (i'm hoping an upper TP around 1,370.0 :D (if we breach all the RSST levels in-between, of course).
any idea wht needs to be done its stuck @1340 level any thing good to sell from here, we have federal budget today as well
 
don't care about the fed budget.

right now is not the time to sell yet. it might still go to 475 or 500 where we have pivot R2 and extension 1.618 on H1/H4. i'm watching H1 MACD for potential bearish divergence and other OB (market has been overbought for 4 days now on H1) as it is starting to look like market is over-extended.

note that on shorter TFs, that is, on TFs less than H1, the pullbacks are very shallow, the bias is up, not down, and indicates bullish pressure. so for scalp purposes, you can start looking for sell triggers on TFs less than H1 BUT with the caveat that those short triggers might be false signals or too early signals and without any unrealistic hopes of deep retracements (meaning take your profits earlier rather than later, just in case).

question is: which TF has the most momentum? think like inertia of heavy object in motion in physics. the boat takes longer to turn on H1/H4. so you can wait for a trigger on H1/H4, ignoring the shorter TFs. or use short TFs for triggers BUT then have a wide stop (at least 100 pips).

situation on H1 is interesting. oscillator is definitely in OB zone and ready to go down. MACD already shows bearish divergence signs. we just need to see whether or not MACD lines will respect downward trendline and signal a 3rd lower high thus completing the divergence and if the divergence is completed when price hits the aforementioned pivot R2 around the high 475, all accompanied by signs of exhaustion on M15/M30/H1, then i'd sell with first TP at the 1st 38.2% fib retrace from the last move up from 230.

good luck and godspeed.

P.S.: forgot to add: look at M1, it's totally flat, ranging and very OS.


any idea wht needs to be done its stuck @1340 level any thing good to sell from here, we have federal budget today as well
 
Last edited:
ok well it'd appear this is it then. maybe something more will happen at 14.00 EST but i don't care. tired, going to bed.

but before i go, just wanted to mention: if you look at H4 with the 3x3 SMA overlayed, it looks like it's gonna take another 8 to 16 hours before we get anything close to a potential DRPO SELL or B&B BUY.

also something concerning me re shorts, is how flat the market remains--you can see this clearly on M15 and lower TFs. no significant pullback yet, just stepwise moves up.

on daily, price crossed over (but did not close yet) the 50% fib of the drop from 1,488. who knows, perhaps it will still explode to 1,370.0 (700) where the next fib is, 61.8%, also where the daily pivot R1 is, and a little higher we have the COP from the AB=CD structure (A = 1,180.40) before the day is over (EST). or it'll drop like a stone. of course, just when i'll be sleeping. story of my life. ;)

PS: the current pullback towards 360 is where the 38.2% fib is of the drop from 1,588 and at 306 we have a 61.8% fib of the drop from 1,423, so K-area, and another 61.8% at 620... so plenty of RSST levels to watch. on H4, current candle struggling with 38.2%. interesting.... how pulbacks remain ridiculously shallow.
 
Last edited:
sive, i just finished reading your analysis. what do you think of the Asian session surge up this Monday morning? on H1, DRPO has been canceled.

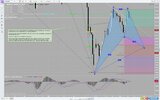
i see RRT on H4, mini double top now on H1, with possible new DRPO on H1 as well. and beginning but not confirmed yet bearish divergence on H1 MACD. Asian session price action also stopped right at R1 pivot on H1.

what i'd like to know is how, if at all, this Asian session price action changes your perspective for your analysis on H1 and H4?

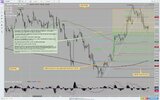
my take is that Asian session upsurge still does not cancel possibility of deeper retrace, especially since price has not yet reached 1,340/1,345 zone. i would say to wait until we see re-test of recent high and see what happens around 1,340/1,345 zone and if signs of reversal appear there, or if pivot R1 holds and we get DRPO around that, either way then short for TP around 1,315.8 which coincided with top of rectangle and first 61.8% fib on H1.

here's the screenshot: https://www.tradingview.com/x/G0nDldJI/

forgot to add: 1,315.8-1,310.3 is also K-area.

Hi sive any update that u could provide according to the current market scenario, can we go short from here

Guys, I haven't taken a look yet on market today, but market just hit the target that we've specfied - WPR1 and area around tops. That's normal and minimum target of morning star pattern that we've discussed. We just thought that it will happen a bit differently, with some retracement on intraday charts. But this has not happened. That's all.

Aman, we do not consider short entry on gold currently, since medium term perspective moderately bullish. Read weekly research.
 
thanks, sive.

also, i need to say to whomever pays attention to my ramblings, i just started trading XAUUSD... so take everything i write with a grain of salt. i don't know the beast yet. ;)
 
sive, did you sse the pullback during the NY session? do you think that the analytical approach you use for currencies maybe should be slightly modified when dealing with gold?

also, here is something interesting. i was watching EURJPY yesterday too... and there were all sorts of setups to go short (retrace pullback) BUT as long as USDJPY would continue its march up, EURJPY would just ignore all OB and harmonic signals to short it.

now, what's interesting is that on H1 we had some similar signs of long trend exhaustion on both EURJPY and gold, but EURJPY just completely ignored them and kept slicing through the fib levels like they didn't exist. only at a major 61.8% did it drop back for about 70 pips after a straight 200+ pip run! but gold seems to be much more respectful of classical technical analysis signals.

or is it only my imagination? or is there something unusual going on with JPY crosses?
 
ok here are 2 screenshots of what i see on daily and H1. comments welcome.

H1: https://www.tradingview.com/x/P3PlhWgQ/

Daily: https://www.tradingview.com/x/vFN7rwhY/


also, unless scalping for 10 to 40 pips at a time on M1, i'm starting to find that M30 seems to be the best TF to use for managing trades (M15 too but the more i review past action, the more entries seem clearer on M30 with the TIs i use). the reason i write this is because when you have face ripping action on H1 as on 2 August where price just goes vertical, if you were looking at M30/M15 you would see a lot more signals warning you of the coming market direction change, whereas on H1 it's barely visible (of course, you'd have to assume that the 1,285 level was a key level and solid SPPT and plan a bounce from there... but if assuming is bad trading ;), then you'd have to wait a few more candles and when the next one is a rocket ship, your opportunity is gone for that session. it all depends on your personal time horizon, i guess. for me, i want to make pips during each and every session, so i have to look for short term setups and stay in the trade no more than 2 hours max).

any thoughts?
 

Attachments

  • XAUUSD_H1_ 2013-08-14 at 12.05.02 .jpg
    XAUUSD_H1_ 2013-08-14 at 12.05.02 .jpg
    179 KB · Views: 4
  • XAUUSD_daily_ 2013-08-14 at 12.16.08 .jpg
    XAUUSD_daily_ 2013-08-14 at 12.16.08 .jpg
    141.7 KB · Views: 2
Last edited:
sive, did you sse the pullback during the NY session? do you think that the analytical approach you use for currencies maybe should be slightly modified when dealing with gold?

also, here is something interesting. i was watching EURJPY yesterday too... and there were all sorts of setups to go short (retrace pullback) BUT as long as USDJPY would continue its march up, EURJPY would just ignore all OB and harmonic signals to short it.

now, what's interesting is that on H1 we had some similar signs of long trend exhaustion on both EURJPY and gold, but EURJPY just completely ignored them and kept slicing through the fib levels like they didn't exist. only at a major 61.8% did it drop back for about 70 pips after a straight 200+ pip run! but gold seems to be much more respectful of classical technical analysis signals.

or is it only my imagination? or is there something unusual going on with JPY crosses?

Hi Triantus,
that's why I do not like trade crosses very much. They are more calculated pairs, I suppose. Such pairs as EUR/GBP could kill you. I prefer to deal with majors where real traders are doing something,

Concerning gold... we have to look different at it, since it behaves different everywhere -at OB/OS, at retracement. But you can't just switch something in your mind and say "I'm totally different to gold because it's specific compares to FX". Actually on gold the same methods work, you need just take into consideration some gold habits and slightly adjust market mechanics.
Besides, gold is most cunning market, and whatever adjustments you will make, you never know how they will help you. Probably nobody can't be absolutely sure with them. I've seen that gold behaves 100% in agreement even with old theory books as say Murphy classical technical analysis. For example, when we've traded most recent upward action - we've made 3 very successful trades and catch all retracements on the way up.
But there were moments when gold behaves curious that you even can't create some completed picture what is going on...
Thus, I prefer to search for some clear setups and patterns on gold. If don't get them, it's better not to trade.
 
Back
Top