dkami
Sergeant
- Messages
- 757
Thanks for you on going analysis on gold Sive
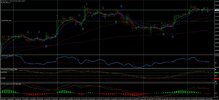
Today you say on H1 has "current swing down is greater than previous swing up" and "This usually happens during reversals"
But I see same thing has happen on H4 but in opposite direction giving a higher high on H4,so could it be possible that this is just a retracement on H1?
D1 has really been testing my patience as the bearish hidden divergence(I was concerned about some time back) didn't work out giving a lower low and now didn't get the higher high on D1 either
I'm now just going to look into buying on H1 going with the higher high on H4 I see if the RR is there for me