GOLD PRO Weekly August 19-23, 2013

guys, if after this kind of action the bulls fail to clear the MPR1 and other levels topside, then watch for one magnificent drop IMHO.

links:
 

Attachments

  • XAUUSD_M1_ 2013-08-22 at 03.49.13 .jpg
    XAUUSD_M1_ 2013-08-22 at 03.49.13 .jpg
    135.2 KB · Views: 6
Thursday 22 AUG

since my goddam cats won't let me sleep, might as well look at the market. ok, so let the charts speak!


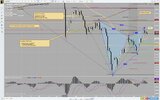
daily: potential Gartley 222 SELL with K-area as target


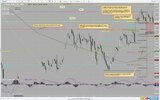
H4: note K-areas, agreement zones, approximate target from range/rectangle breakout to the downside, and how they all coincide with first major SPPT level from a previous high that was strong RSST at the time (around 1,345.50/55)


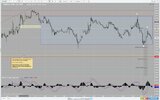
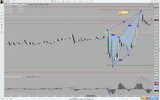
M15: rectangle defines range to breakout from; note that the currently forming AB=CD structure has OP (1,344.15) just below 38.2% fib and major S/R (red horizontal line), which is where we have the target area on H4.


if you see more, by all means, comment.
 

Attachments

  • XAUUSD_daily_ 2013-08-22 at 13.24.54 .jpg
    XAUUSD_daily_ 2013-08-22 at 13.24.54 .jpg
    167.3 KB · Views: 5
  • XAUUSD_H4_ 2013-08-22 at 13.24.23 .jpg
    XAUUSD_H4_ 2013-08-22 at 13.24.23 .jpg
    166.6 KB · Views: 3
  • XAUUSD_M15_rect_2013-08-22 at 13.23.51 .jpg
    XAUUSD_M15_rect_2013-08-22 at 13.23.51 .jpg
    148.7 KB · Views: 2
sive, with all due respect, i disagree with how you draw the butterfly on H4. look at my chart here: https://www.tradingview.com/x/LWIhUdT7/

according to this, we had a completed Gartley 222 SELL. i do not understand why you choose to ignore the pullback up from 523 as the AB leg and draw the AB leg instead to the higher high, which is my D point.

the candles are different too because this chart is generated with data from FXCM and the timezone is EST. yours i think is on UK time. so we get slightly different candle patterns. what to do?
 
Back
Top