Sive Morten
Special Consultant to the FPA
- Messages
- 18,669
Fundamentals
So, gold market has shown really impressive action on previous week. As Reuters reports, Gold rose nearly 1 percent to a two-month high on Friday, and bullion posted its biggest weekly gain in five weeks as disappointing U.S. data dimmed hopes for a swift economic recovery. Gold's appeal as an investment hedge increased after U.S. economic reports on Friday showed weaker consumer confidence in August and lower-than-expected residential construction last month. Friday's data suggested that a recent spike in interest rates, in anticipation of the U.S. Federal Reserve scaling back its massive bond purchases as early as next month, was starting to have an impact on households, analysts said. For the week, gold was up almost 5 percent. Benchmark U.S. 10-year Treasury bond yields surged to a two-year high as investors bet that recent signs of economic growth will spur the Fed to begin paring back its bond purchase program next month. On Thursday, gold rallied more than 2 percent as a drop in the U.S. dollar triggered short-covering and a technical breakout once prices breached key resistance at $1,350 an ounce. Gold completed a bullish reversal pattern after Thursday's breakout, and prices could now rise sharply higher toward the next major resistance in the $1,500 area, said Mark Arbeter, chief technical strategist at S&P Capital IQ. As a gauge of investment sentiment, holdings of SPDR Gold Trust, the world's largest gold-backed ETF, fell just 0.3 tonnes to 912.92 tonnes on Thursday. Rare inflows were seen in the fund twice over the past six sessions but holdings remain at four-year lows.
Recent CFTC data shows flat dynamic. Taking in consideration 4-5 recent week we can say that open interest reduces with reducing of net long position. But, dynamic is not very clear.
 That’s the short picture of passed week. In general, we should not overestimate some single fundamental data value, as consumer confidence or construction and think that particularly this weak data has forced gold market to move. Absolutely not… May be such data as Non farm payrolls could move market even by single release, but not a confidence survey. Now we just see the impact of stronger factors that we’ve discussed within previous couple of months – extreme oversold and changing the seasonal trend. Currently market starts to move and confirm our long-term analysis, since we’ve expected to see upward action at the end of August, and now we see it. Now the question is where this move will finish and what the level will be. Recall that we treat this current move up only as retracement, although big and valuable retracement. Our target is 1550-1600 area that should be achieved by February 2014 or may be a bit earlier. We will see. From the fundamental point of view we should search trade opportunities on lower time frames in south direction. New turmoil in Egypt and difficult situation in Middle East in general also adds some geopolitical pressure on financial markets. On spot market we again see slow down of ETF outflow on example of SPDR fund. Different parts of gold market confirm changing sentiment, or at least, reducing of its bearishness.
Monthly
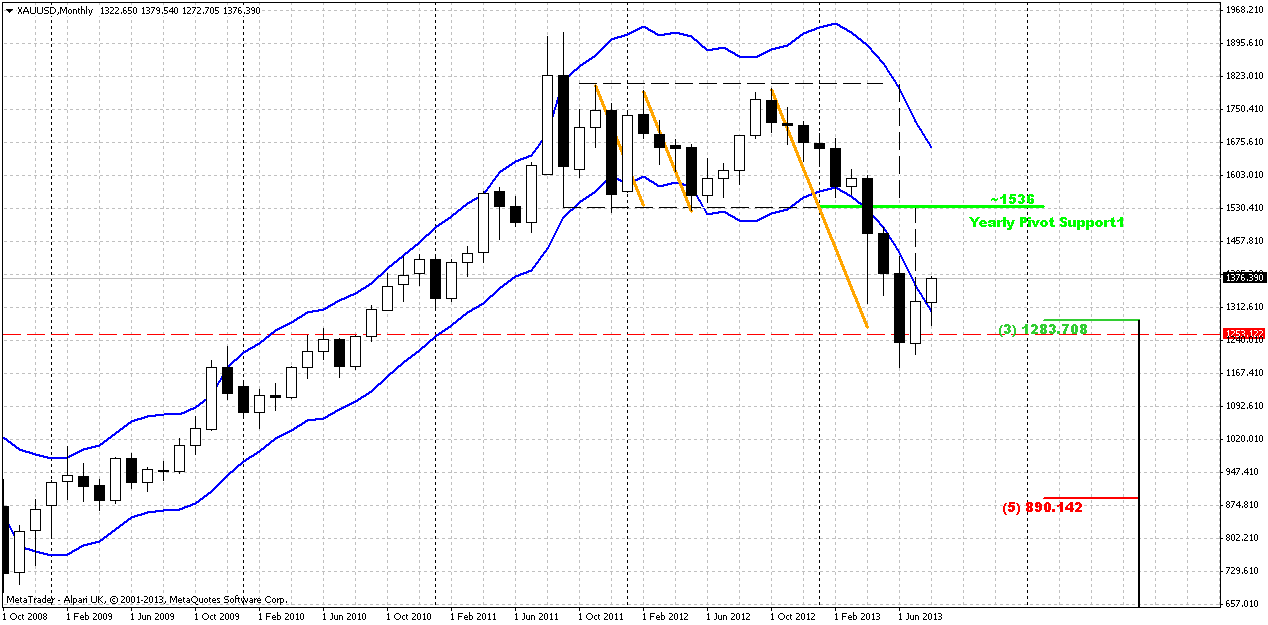
Market has shown 60$ uppreciation on previous week and market has passed a bit more out of oversold, but monthly chart is rather big picture and situation changes slowly here. We keep in mind Volatility breakout pattern and know that there will be 3-leg downward action. This means that current bounce will be just retracement probably. Second, currently we know that market at support – Fib support, target of rectangle breakout, completion of harmonic swing down and monthly deep oversold. Unfortunately monthly chart does not give us much assistance in short-term trading. One bullish pattern that probably could be seen here is bullish DiNapoli “Stretch” pattern, since market stands at deep oversold right at Fib support. Thus, this is not the time to take long-term short position, but time to think about their close and searching for bullish patterns on lower time frames – weekly and daily. Target of this pattern is a middle between Oscillator Predictor Bands – right around 1550$ area. S&P analyst specifies approximately the same target. This area agrees with “Stretch” pattern as well. August candle is very small by far, but take a look – market gradually move out from oversold condition…
Weekly
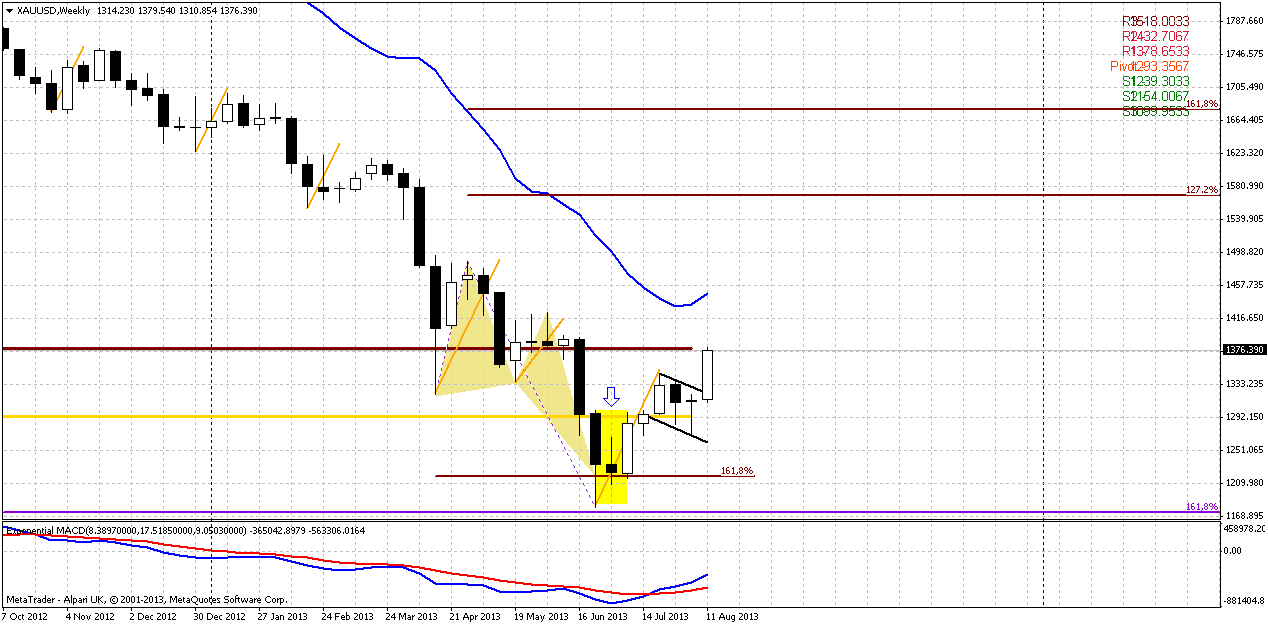
On weekly chart market confirms moderately bullish sentiment, at least behaves in agreement with patterns that it forms – morning star, butterfly and bullish flag. First is it reinforces current support by Agreement. Market has hit 1.618 extension target as well from AB=CD pattern that is based on all-times high. Thus, support level currently is really solid. Second, take a look – within current move down since September 2012 market never breaks the harmonic swing of retracement. Only once it has shown double swing – that was in April by the way, right after miserable plunge. Now we see the breaking of harmonic swing that lets us to think that this is not just retracement up, but something bigger. Current action within most recent 5-7 weeks is different compares to previous one. And trend never has turned bullish by MACD within this time. Now we have bullish trend on weekly.
Thus, development here looks pretty good, but let’s talk about the future action as well. On coming week major focus will be on MPR1=1378,65 and top of previous swing down. We’ve said much about bullish patterns, but major confirmation is still ahead – market should show greater upward swing than previous swing down. Only in this case we will be sure with reversal. This automatically assumes that market will pass through MPR1 that also will be bullish sign.
Do not worry, if you weren’t able to take long position. In fact, market has not shown any meaningful retracement here yet. Usually after reversal swing will be completed, market has a tendency do show deep retracement, may be even AB=CD. Thus, we will get our chance, no doubts.
Daily
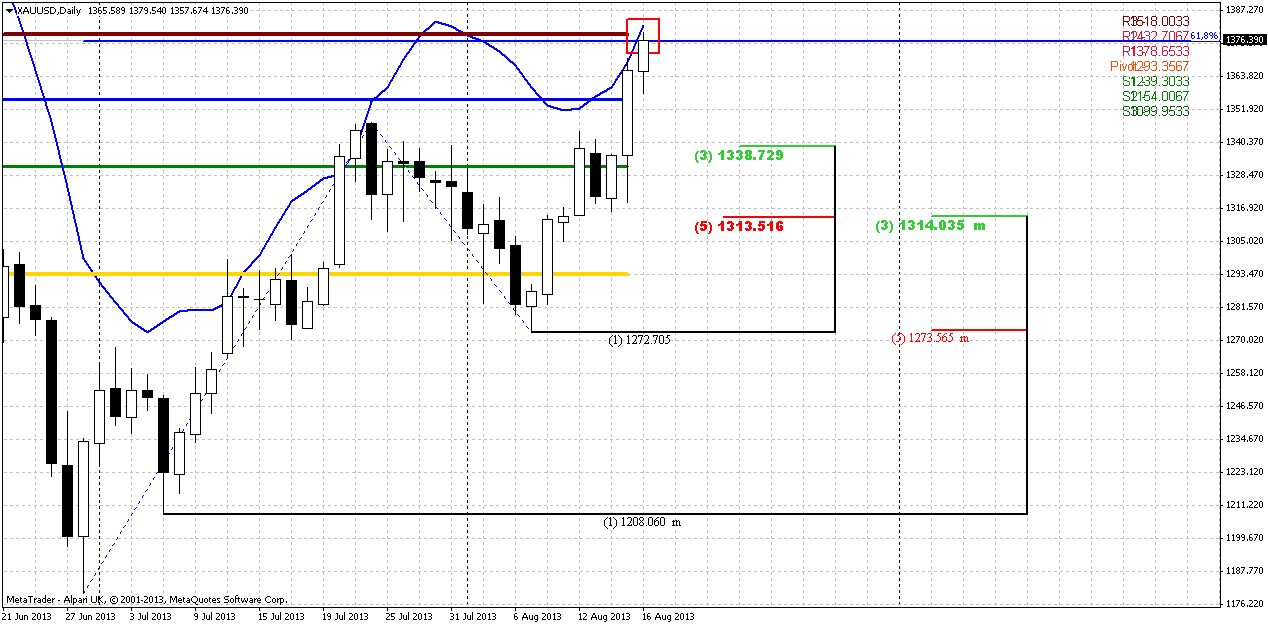
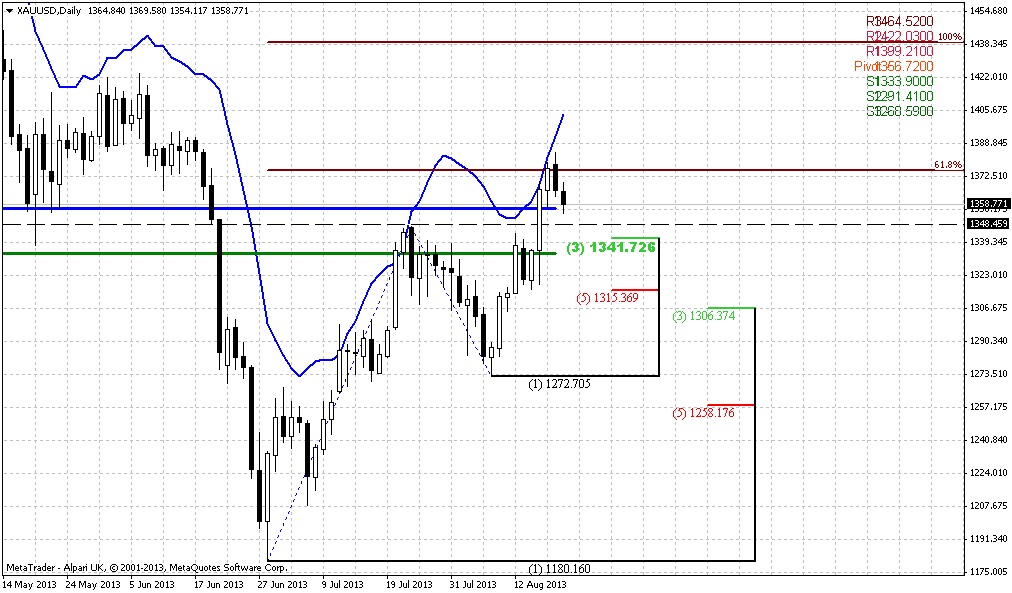
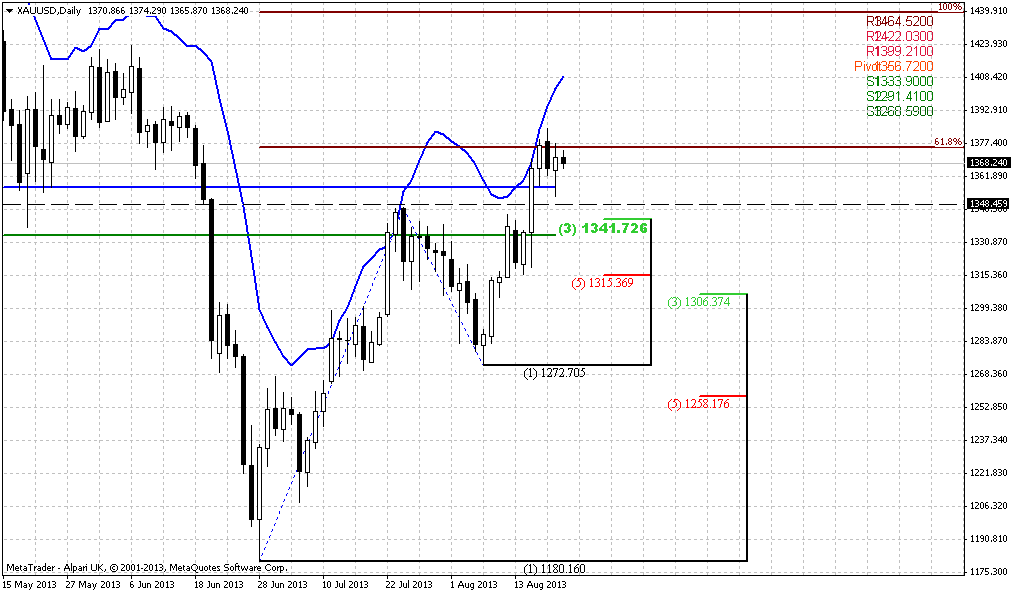
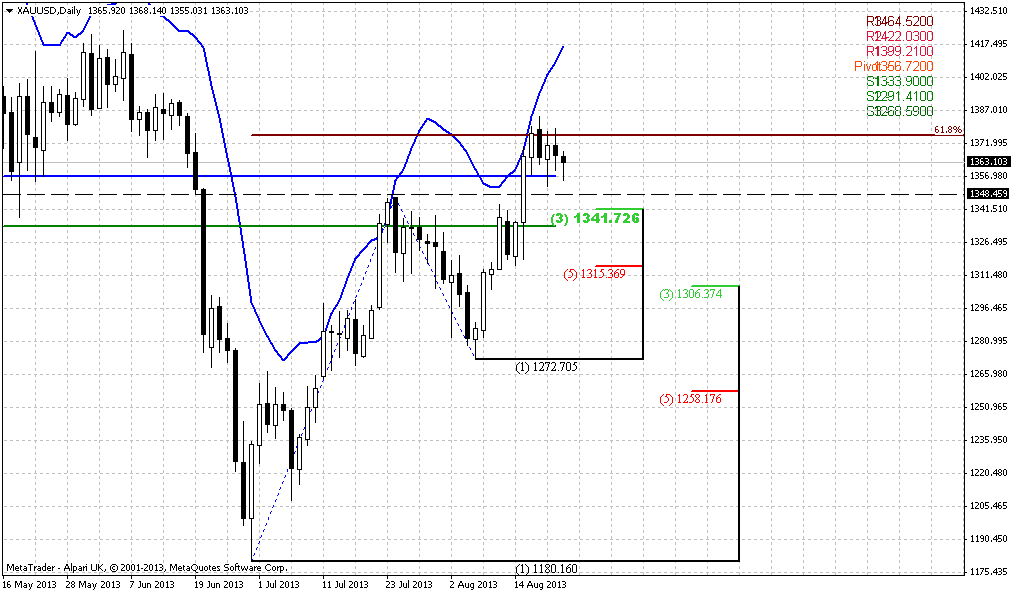
On previous week we’ve said that we probably have to stick with morning star pattern that has appeared at former K-support area. Actually we had no choice, since that was just the single pattern that we had, but anyway it has led us to upward action and breakout. So, what’s next?
Market has bullish trend and bullish action, thus context is bullish. But we can’t enter long right on Monday since market at solid resistance – 0.618 Fib extension, MPR1 and daily overbought. We need to wait a bounce down. In fact, we have “Stretch” bearish directional pattern. I do not call you against major sentiment, that is your choice, and will tell only on trading on daily time frame. Here we need to wait when retracement will be completed and search possibility for long entry. But scalpers could try to find opportunity to ride on Stretch pattern as well.
How deep retracement should be? Not too deep. Because this is just minor AB-CD extension target and price just has passed through highs. Perfectly if market will stop somewhere around 1330-1338 WPS1 and Fib support, I will be totally satisfied. May be it will not be a tragedy if market even will reach 1314 K-support area, but I do not want to get it. This will be below previous highs and even below former flag pattern. It will be more bothersome way. So, on daily time frame we see that market has nice bullish momentum, but stands at resistance and our task for beginning of the week is to wait a retracement.
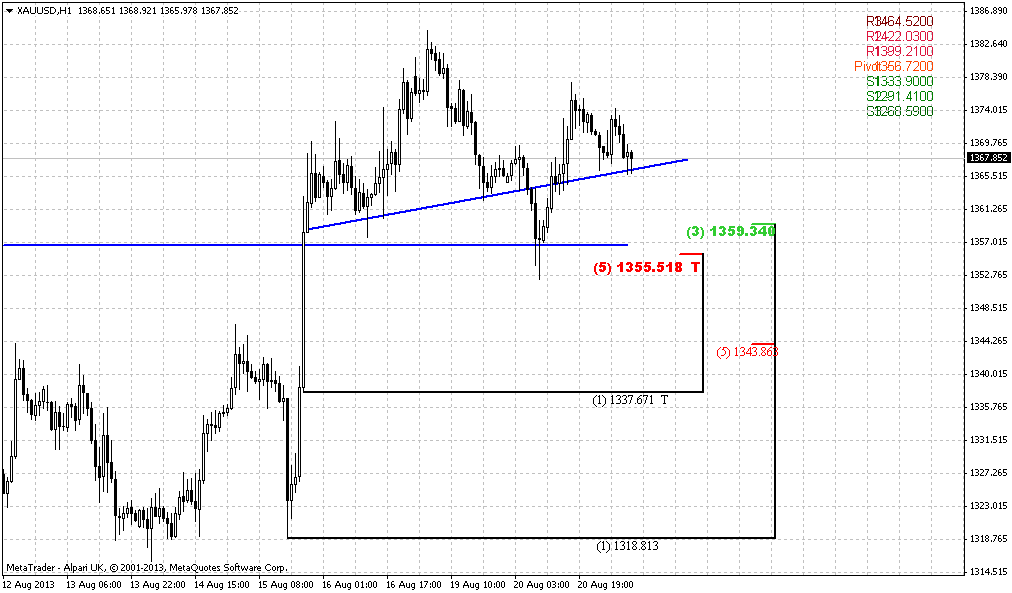
1-hour
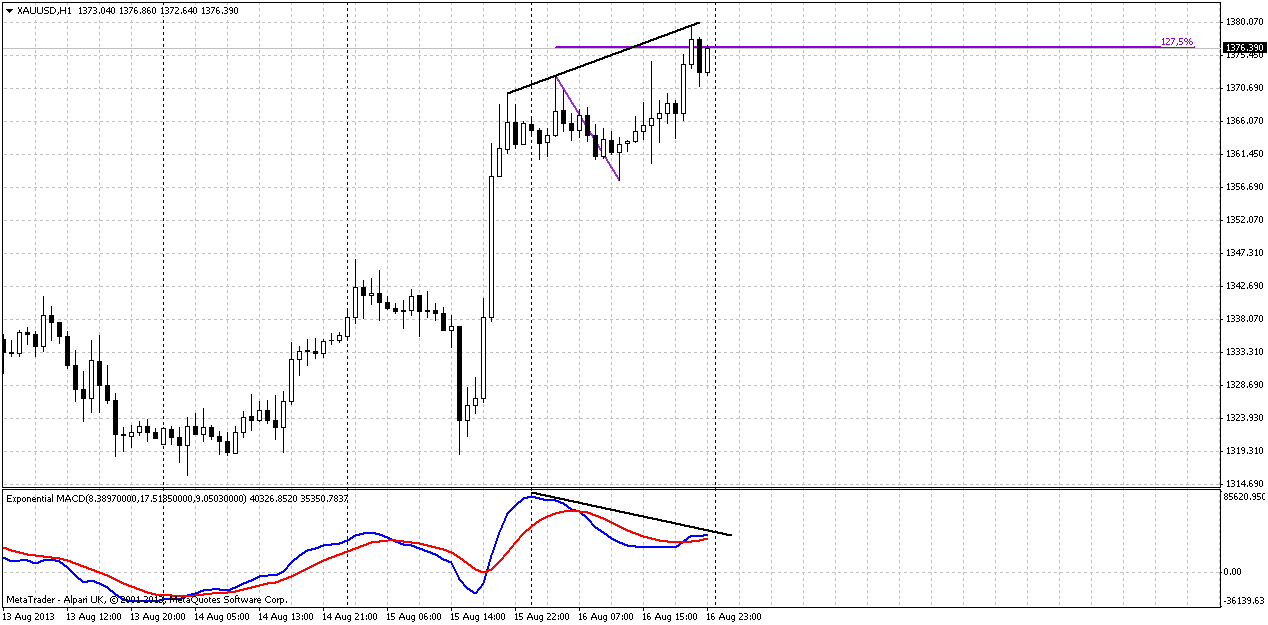
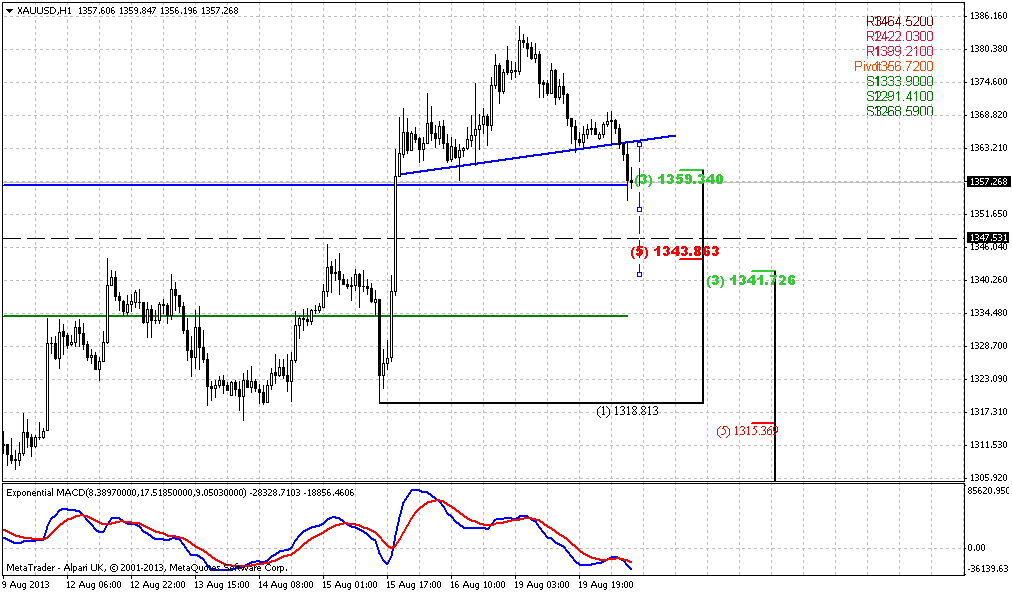
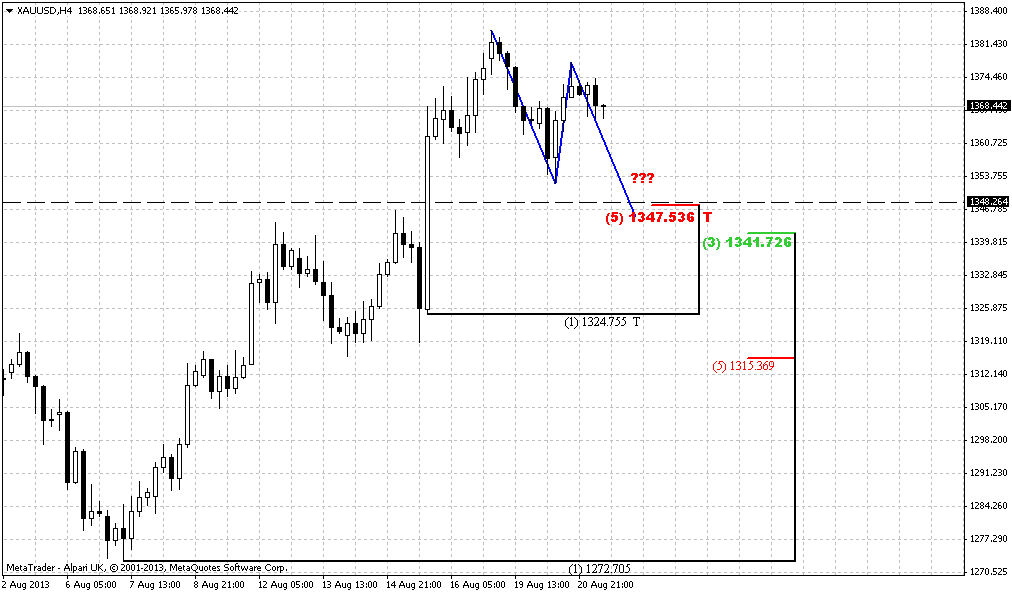
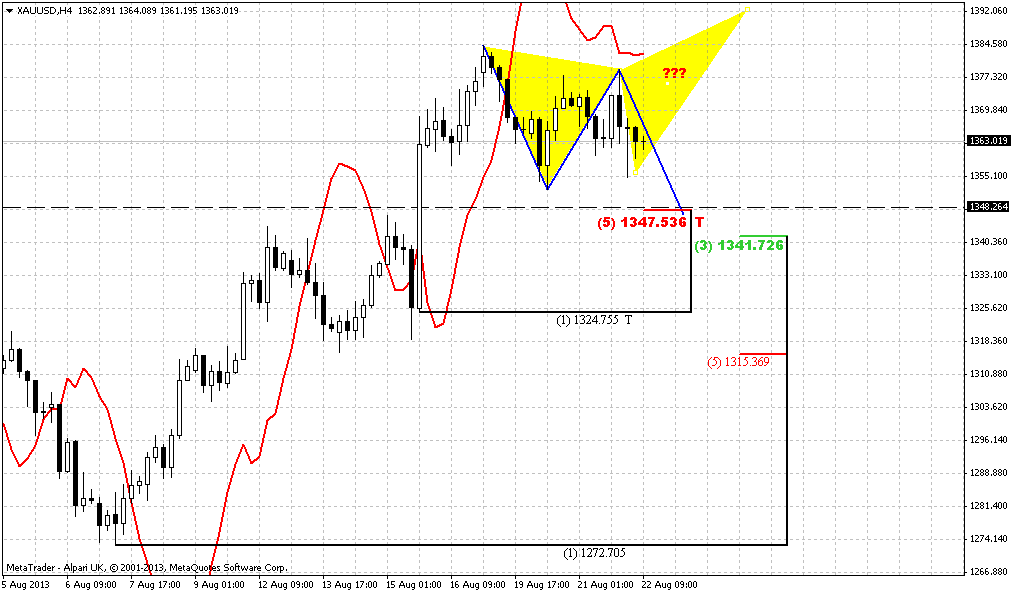
I do not see anything interesting on 4-hour chart, but here, on hourly, potentially we could get exhausting pattern even on Moday. Thus, current top stands right at 1.27 extension of previous swing and we have a bearish divergence with MACD right at solid daily resistance. So, it is possible to get wedge, H&S or something else of this sort.
Conclusion:
Technically and fundamentally gold market stands in long-term bearish motion, but there are more and more factors start to appear that make downward action as not as cloudless as it was recently. Also we’ve got VOB pattern that gives us forecast for long-term price behavior and promise compounded downward move in shape of some AB-CD. Now major question in big picture – is when and how BC up leg will start. WE have some suspicions that it has started already, but we feel some lack of confirmation still, since signs are too shy. As a result, we do not know just yet – is current move up is just a minor bounce or something bigger. Fundamentally some supportive factors have appeared, and this could shift to greater retracement. On passed week market again has given us a confirmation of this thought.
Most recent action shows that upward move could continue after some retracement in the beginning of the next week, because momentum on daily time frame is nice, but market stands at solid resistance. It will be perfect if retracement will end somewhere around WPS1 1330 area.
The technical portion of Sive's analysis owes a great deal to Joe DiNapoli's methods, and uses a number of Joe's proprietary indicators. Please note that Sive's analysis is his own view of the market and is not endorsed by Joe DiNapoli or any related companies.
So, gold market has shown really impressive action on previous week. As Reuters reports, Gold rose nearly 1 percent to a two-month high on Friday, and bullion posted its biggest weekly gain in five weeks as disappointing U.S. data dimmed hopes for a swift economic recovery. Gold's appeal as an investment hedge increased after U.S. economic reports on Friday showed weaker consumer confidence in August and lower-than-expected residential construction last month. Friday's data suggested that a recent spike in interest rates, in anticipation of the U.S. Federal Reserve scaling back its massive bond purchases as early as next month, was starting to have an impact on households, analysts said. For the week, gold was up almost 5 percent. Benchmark U.S. 10-year Treasury bond yields surged to a two-year high as investors bet that recent signs of economic growth will spur the Fed to begin paring back its bond purchase program next month. On Thursday, gold rallied more than 2 percent as a drop in the U.S. dollar triggered short-covering and a technical breakout once prices breached key resistance at $1,350 an ounce. Gold completed a bullish reversal pattern after Thursday's breakout, and prices could now rise sharply higher toward the next major resistance in the $1,500 area, said Mark Arbeter, chief technical strategist at S&P Capital IQ. As a gauge of investment sentiment, holdings of SPDR Gold Trust, the world's largest gold-backed ETF, fell just 0.3 tonnes to 912.92 tonnes on Thursday. Rare inflows were seen in the fund twice over the past six sessions but holdings remain at four-year lows.
Recent CFTC data shows flat dynamic. Taking in consideration 4-5 recent week we can say that open interest reduces with reducing of net long position. But, dynamic is not very clear.
Monthly
Market has shown 60$ uppreciation on previous week and market has passed a bit more out of oversold, but monthly chart is rather big picture and situation changes slowly here. We keep in mind Volatility breakout pattern and know that there will be 3-leg downward action. This means that current bounce will be just retracement probably. Second, currently we know that market at support – Fib support, target of rectangle breakout, completion of harmonic swing down and monthly deep oversold. Unfortunately monthly chart does not give us much assistance in short-term trading. One bullish pattern that probably could be seen here is bullish DiNapoli “Stretch” pattern, since market stands at deep oversold right at Fib support. Thus, this is not the time to take long-term short position, but time to think about their close and searching for bullish patterns on lower time frames – weekly and daily. Target of this pattern is a middle between Oscillator Predictor Bands – right around 1550$ area. S&P analyst specifies approximately the same target. This area agrees with “Stretch” pattern as well. August candle is very small by far, but take a look – market gradually move out from oversold condition…
Weekly
On weekly chart market confirms moderately bullish sentiment, at least behaves in agreement with patterns that it forms – morning star, butterfly and bullish flag. First is it reinforces current support by Agreement. Market has hit 1.618 extension target as well from AB=CD pattern that is based on all-times high. Thus, support level currently is really solid. Second, take a look – within current move down since September 2012 market never breaks the harmonic swing of retracement. Only once it has shown double swing – that was in April by the way, right after miserable plunge. Now we see the breaking of harmonic swing that lets us to think that this is not just retracement up, but something bigger. Current action within most recent 5-7 weeks is different compares to previous one. And trend never has turned bullish by MACD within this time. Now we have bullish trend on weekly.
Thus, development here looks pretty good, but let’s talk about the future action as well. On coming week major focus will be on MPR1=1378,65 and top of previous swing down. We’ve said much about bullish patterns, but major confirmation is still ahead – market should show greater upward swing than previous swing down. Only in this case we will be sure with reversal. This automatically assumes that market will pass through MPR1 that also will be bullish sign.
Do not worry, if you weren’t able to take long position. In fact, market has not shown any meaningful retracement here yet. Usually after reversal swing will be completed, market has a tendency do show deep retracement, may be even AB=CD. Thus, we will get our chance, no doubts.
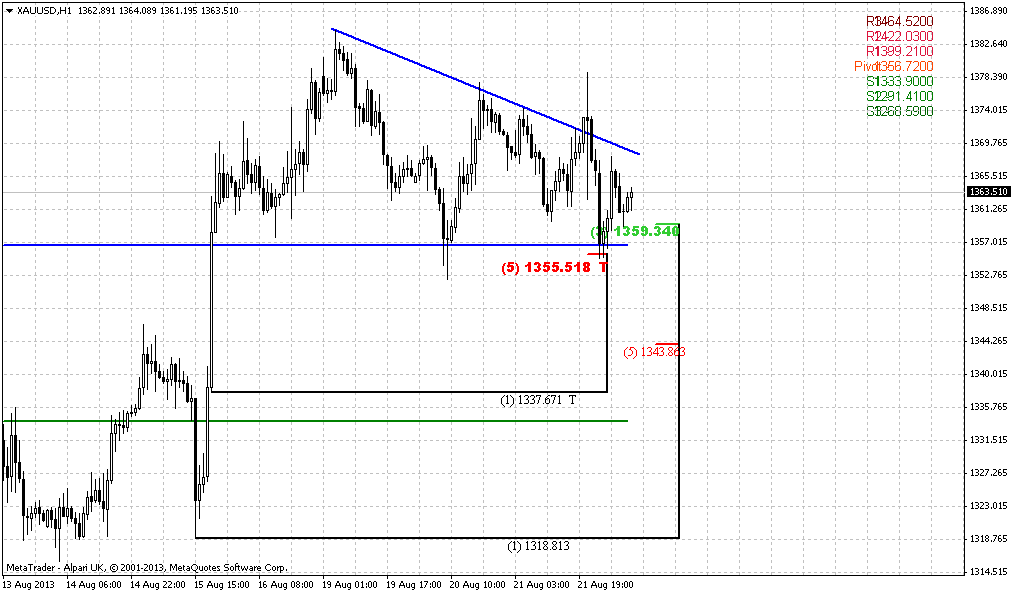
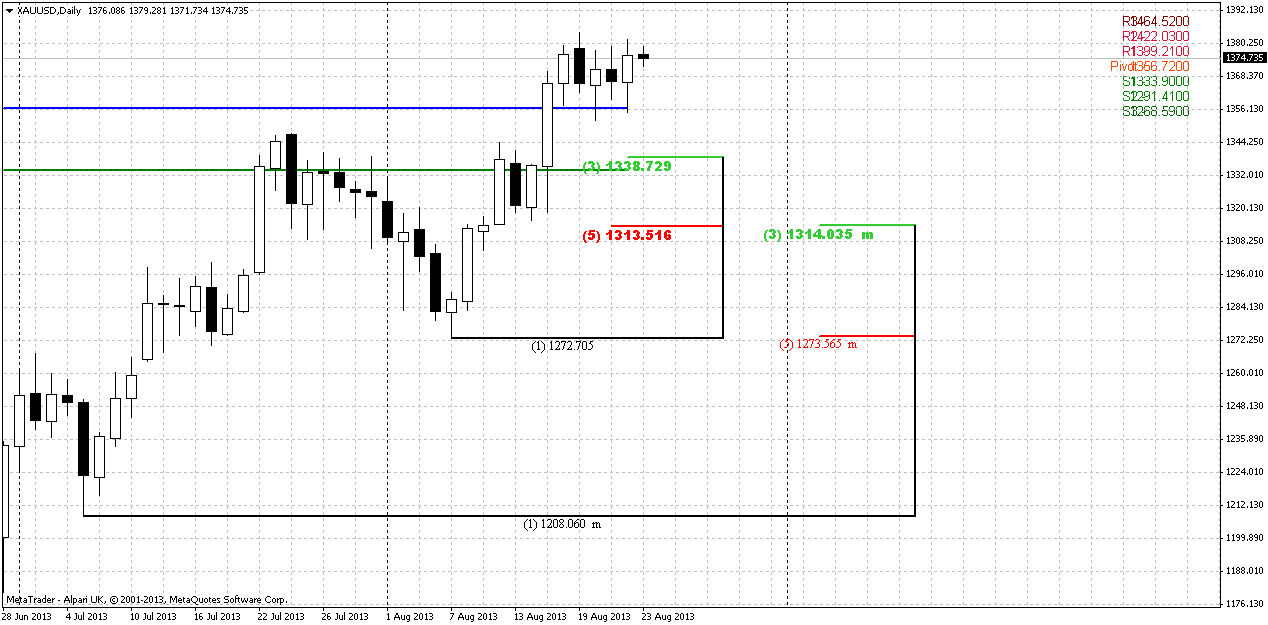
Daily
On previous week we’ve said that we probably have to stick with morning star pattern that has appeared at former K-support area. Actually we had no choice, since that was just the single pattern that we had, but anyway it has led us to upward action and breakout. So, what’s next?
Market has bullish trend and bullish action, thus context is bullish. But we can’t enter long right on Monday since market at solid resistance – 0.618 Fib extension, MPR1 and daily overbought. We need to wait a bounce down. In fact, we have “Stretch” bearish directional pattern. I do not call you against major sentiment, that is your choice, and will tell only on trading on daily time frame. Here we need to wait when retracement will be completed and search possibility for long entry. But scalpers could try to find opportunity to ride on Stretch pattern as well.
How deep retracement should be? Not too deep. Because this is just minor AB-CD extension target and price just has passed through highs. Perfectly if market will stop somewhere around 1330-1338 WPS1 and Fib support, I will be totally satisfied. May be it will not be a tragedy if market even will reach 1314 K-support area, but I do not want to get it. This will be below previous highs and even below former flag pattern. It will be more bothersome way. So, on daily time frame we see that market has nice bullish momentum, but stands at resistance and our task for beginning of the week is to wait a retracement.
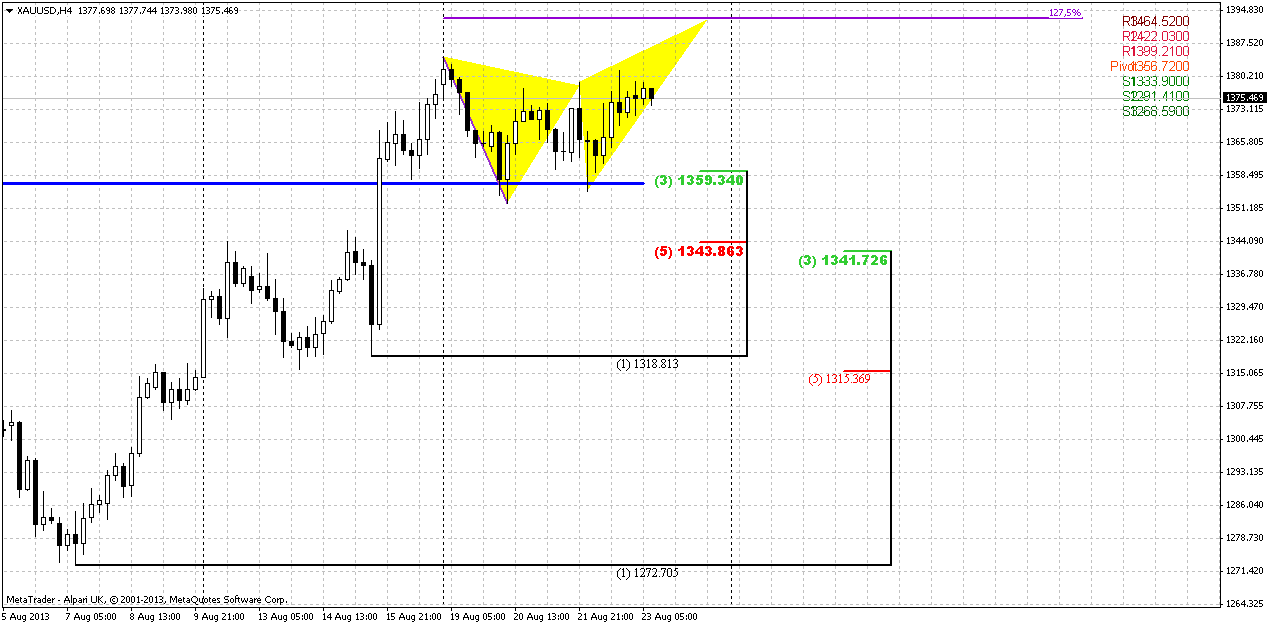
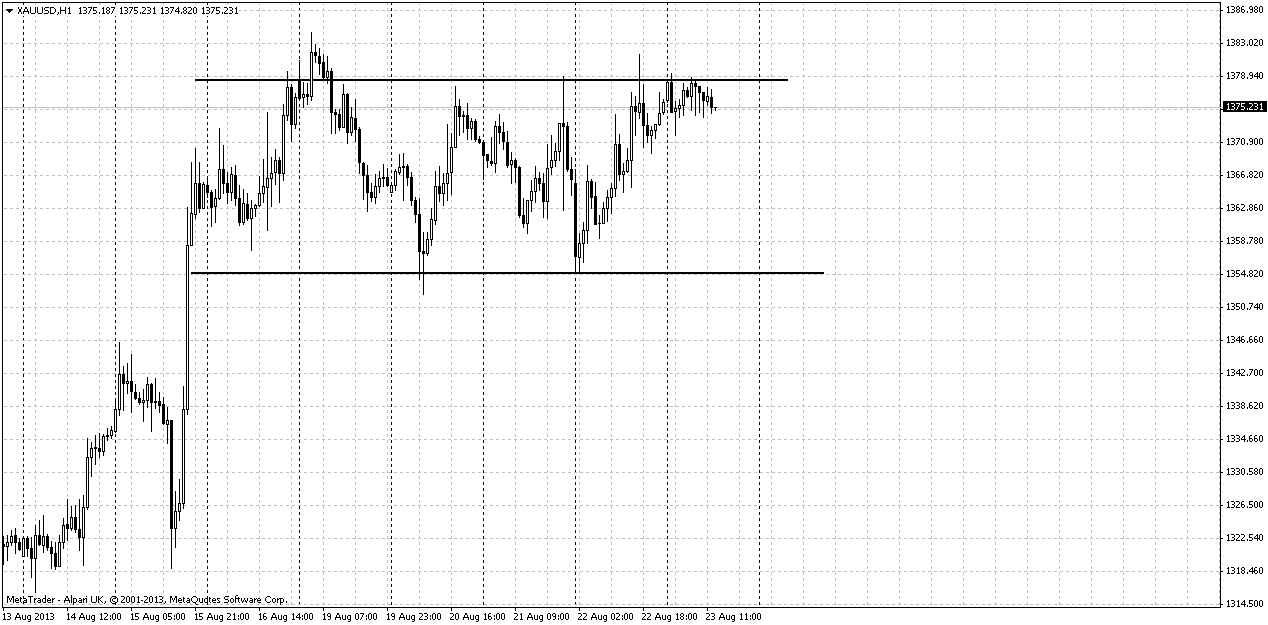
1-hour
I do not see anything interesting on 4-hour chart, but here, on hourly, potentially we could get exhausting pattern even on Moday. Thus, current top stands right at 1.27 extension of previous swing and we have a bearish divergence with MACD right at solid daily resistance. So, it is possible to get wedge, H&S or something else of this sort.
Conclusion:
Technically and fundamentally gold market stands in long-term bearish motion, but there are more and more factors start to appear that make downward action as not as cloudless as it was recently. Also we’ve got VOB pattern that gives us forecast for long-term price behavior and promise compounded downward move in shape of some AB-CD. Now major question in big picture – is when and how BC up leg will start. WE have some suspicions that it has started already, but we feel some lack of confirmation still, since signs are too shy. As a result, we do not know just yet – is current move up is just a minor bounce or something bigger. Fundamentally some supportive factors have appeared, and this could shift to greater retracement. On passed week market again has given us a confirmation of this thought.
Most recent action shows that upward move could continue after some retracement in the beginning of the next week, because momentum on daily time frame is nice, but market stands at solid resistance. It will be perfect if retracement will end somewhere around WPS1 1330 area.
The technical portion of Sive's analysis owes a great deal to Joe DiNapoli's methods, and uses a number of Joe's proprietary indicators. Please note that Sive's analysis is his own view of the market and is not endorsed by Joe DiNapoli or any related companies.
")