Sive Morten
Special Consultant to the FPA
- Messages
- 18,699
sive
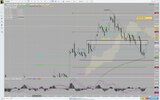
here is H1 as of 2.10 am EST. as you can see, the K-area has been tested 3 times already, and is being tested a 4th time as i write this. so far, it has held and shown great resilience.
now, here is my question: am i correct to assume that because it looks so strong, that it will hold the 4th time as well, or at least that the downside will be very limited (to 380/90 and no further down) and that this is the market telling the bears, 'no way! you ain't going down,' and therefore a sign of constant bullish pressure presaging a surge to the upside (which by the way, after looking at daily and H4, i predict will be moderate, that is to say: 140/60 at least, 200/20 and 370/90 at best, then drop from there to let daily extreme OB signals unwind.)
Hi Triantus,
by my suggestion each testing of K-area makes it weaker. But IMHO you look on particularities and pay too much attention to them (may be this is because you trade on lower time frames) and pay less attention to major things.
Here is what I mean - in fact market in upward channel, holds harmonic swings and has not quite reached 1440 AB=CD target on daily. Currently it stands with harmonic retracement down. This is OK, until harmonic length holds.
But whether there is a K-support right at the end of this harmonic swing or any other support - this is not as important, at least if you do not search possiblity for entry.
What I'm want to say is better take a broader look first and then turn to some details, because details could confuse you. Following your example, K-area is not an indicator or signal by itself. So you have to understand how to put it into whole context.
")