Sive Morten
Special Consultant to the FPA
- Messages
- 18,776
Fundamentals
Now is the end of August and gold is entering seasonal bullish trend. External data and events in general support moderate positive sentiment for gold. Most significant events on past week were Fed meeting and new home sales data release. Sales of new single-family homes in the United States fell more than 13 percent in July to their lowest level in nine months. The Commerce Department data was much weaker than expected, even during a month when Fed stimulus remained in place. "The new home sales number is terrible, so the fear is clearly that higher interest rate (are) going to topple this housing recovery, which means the Fed has to ease and not tighten," said Axel Merk to Reuters, portfolio manager of Merk Funds which has around $500 million in currency mutual-fund assets.
As a result, Gold rose almost 2 percent on Friday, hitting its highest price in more than two months near $1,400 an ounce. For the week, gold gained 1.6 percent for its third consecutive weekly rise. It has climbed in six out of the past seven weeks since gold fell to a three-year low at $1,180 an ounce on June 28. Bullion also drew support when three Fed officials expressed divergent views on when to reduce the central bank's $85 billion monthly bond buying. Investors have been trying to predict what will happen at a Fed policy meeting next month.
Still, some analysts said that gold's recent rallies in thin trading suggest gains could fizzle easily, especially with the Fed's planned stimulus cut and overall improvement in global economic conditions. Another reason is that seasonal trend mostly is based on demand jump in India and China. Recent data shows that demand in top buyers India and China has been subdued ahead of the traditional major gold-buying events in Asia, driven by India's Hindu festivals and peak wedding season, and as jewelers start to stockpile ahead of the Chinese New Year. Premiums in Hong Kong, the key supplier of gold to China, have fallen to about $4 an ounce over London spot prices as of Friday, dealers said, from $5 last week. At the same time South Africa's National Union of Mineworkers is consulting its membership on a strike in the gold industry, which could start next week, halting production for the country's main mineral export. But, probably it is a bit early for panic and thoughts that seasonal trend will fail. Situation on retail gold market chances fast and demand could increase significantly during nearest month.
Recent CFTC data shows shy dynamic as on previous week, but here we still can see, that open interest grows with increasing net long position. It is also valuable sign that SPDR Fund shows second week of inflows. Thus, from minimum around 909 tonnes 2 weeks ago, now it has assets at 920 tonnes.
So, we do not see any drastical changes in fundamental situation on gold market. Currently market starts to move and confirm our long-term analysis, since we’ve expected to see upward action at the end of August, and now we see it. Now the question is where this move will finish and what the level will be. Recall that we treat this current move up only as retracement, although big and valuable retracement. Our target is 1550-1600 area that should be achieved by February 2014 or may be a bit earlier. We will see. From the fundamental point of view we should search trade opportunities on lower time frames in south direction. New turmoil in Egypt and difficult situation in Middle East in general also adds some geopolitical pressure on financial markets. On spot market we again see slow down of ETF outflow on example of SPDR fund. Different parts of gold market confirm changing sentiment, or at least, reducing of its bearishness.
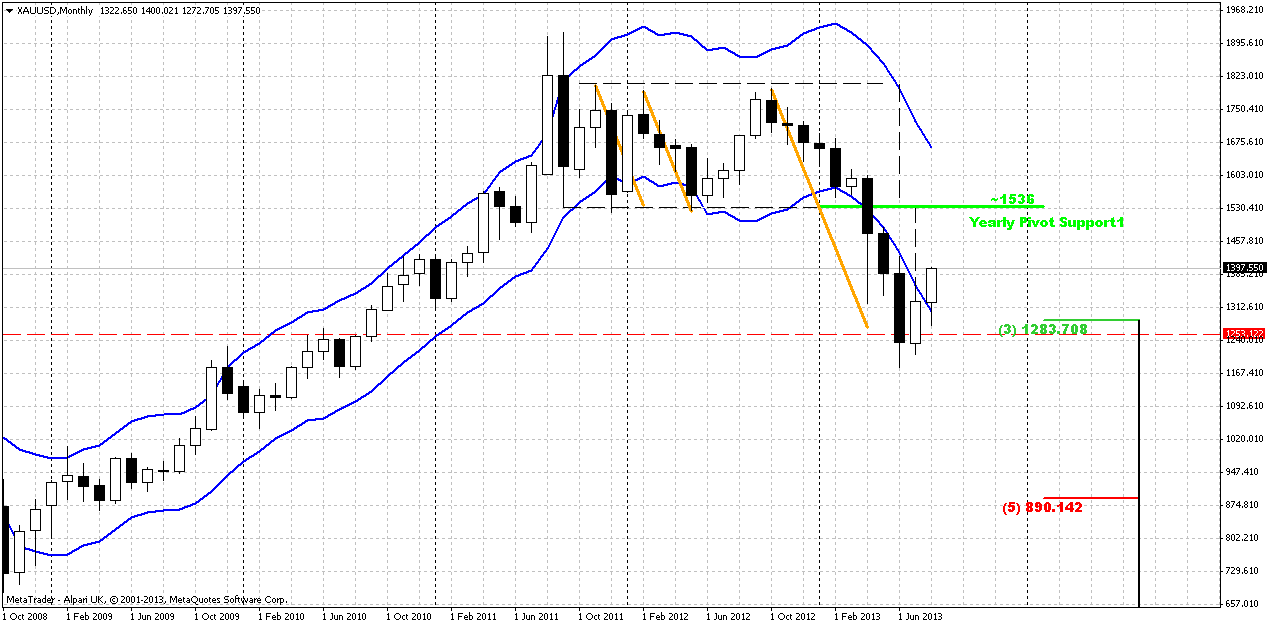
Monthly
Currently by August candle market shows nice appreciation. Still we keep in mind Volatility breakout pattern and know that there will be 3-leg downward action. This means that current bounce will be just retracement probably. Second, currently we know that market at support – Fib support, target of rectangle breakout, completion of double harmonic swing down and monthly deep oversold. Unfortunately monthly chart does not give us much assistance in short-term trading. One bullish pattern that probably could be seen here is bullish DiNapoli “Stretch” pattern, since market stands at deep oversold right at Fib support. Thus, this is not the time to take long-term short position, but time to think about their close and searching for bullish patterns on lower time frames – weekly and daily. Target of this pattern is a middle between Oscillator Predictor Bands – right around 1550$ area. S&P analyst specifies approximately the same target. This area agrees with “Stretch” pattern as well.
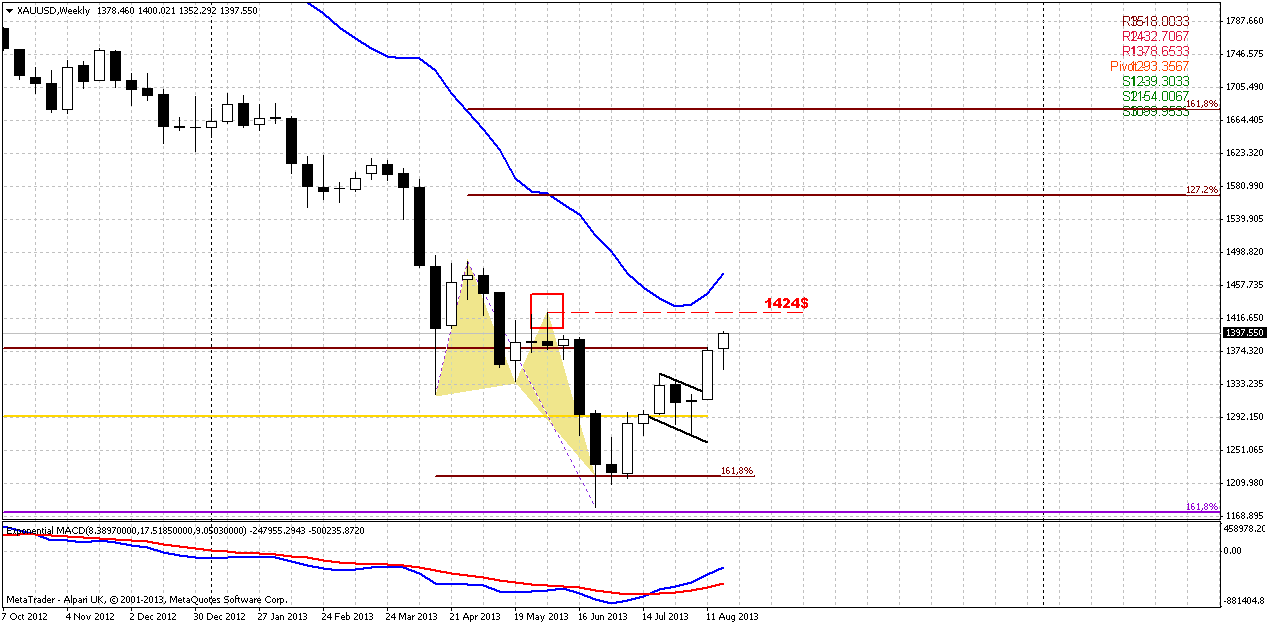
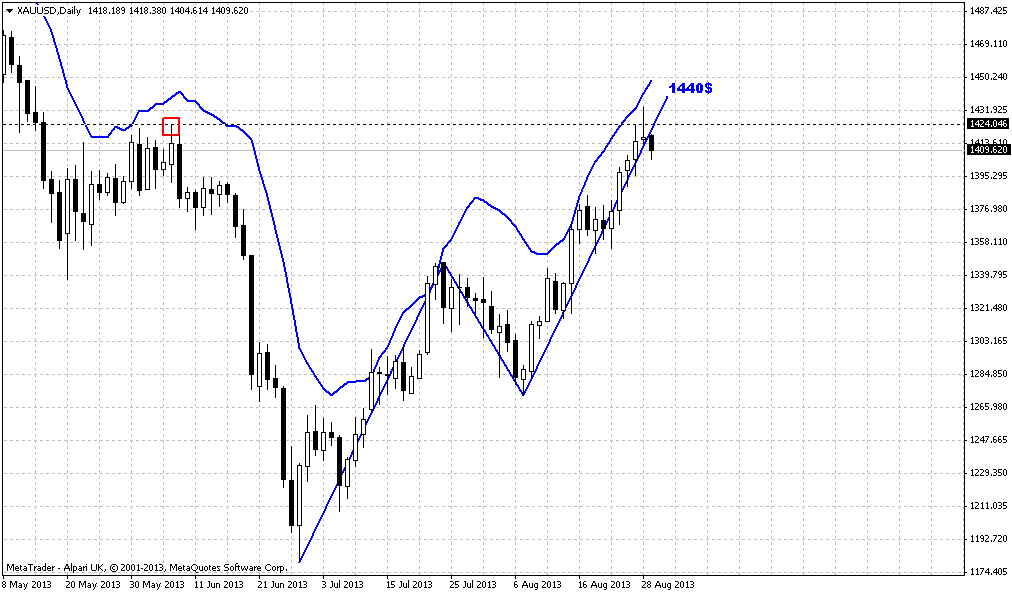
Weekly
On weekly chart market confirms moderately bullish sentiment, we have bullish trend on weekly.
Price development looks pretty good by far. In fact, there is no questions at all – gradual and constant upward action. Another bullish moment has appeared on previous week – market has passed through and closed above MPR1. This usually happens when market stands not just in retracement but with bullish trend. Previously we’ve said much about bullish patterns, but major confirmation is still ahead – market should show greater upward swing than previous swing down. Only in this case we will be sure with reversal. That is, in fact our next short-term target – 1424 the top of previous swing down.
Do not worry, if you weren’t able to take long position yet. If we will be right with our analysis, usually after reversal swing will be completed, market has a tendency do show deep retracement, may be even AB=CD. Thus, we will get our chance, no doubts. Now I speak about those who trade really long term, on weekly and monthly charts.
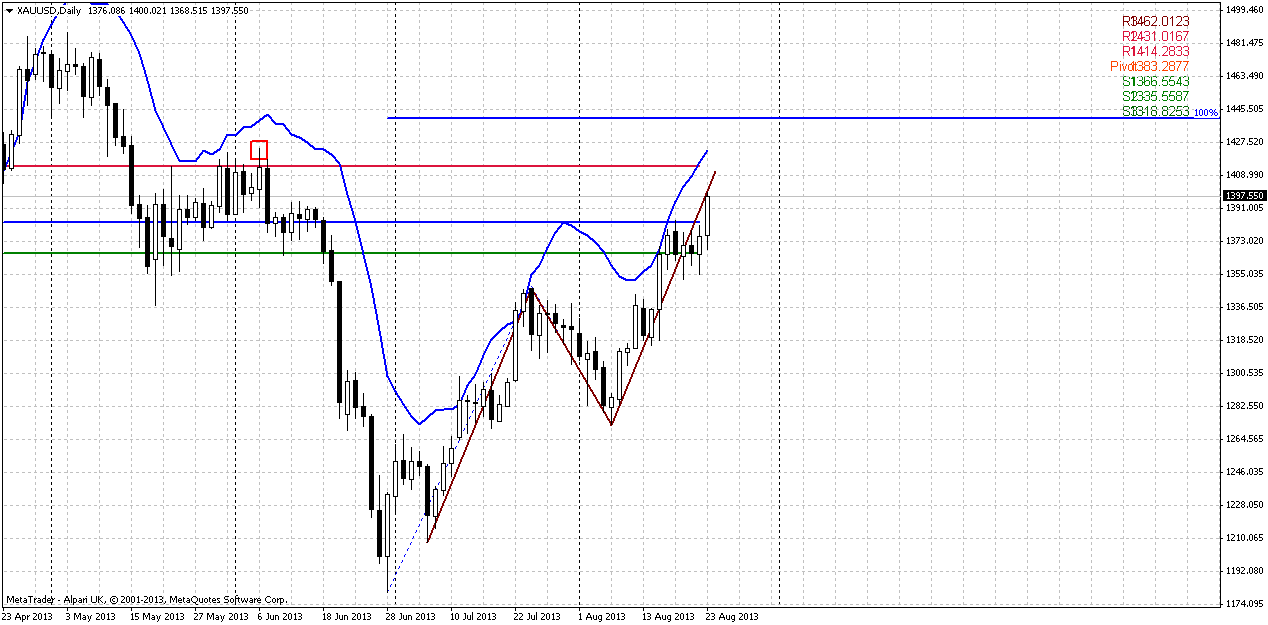
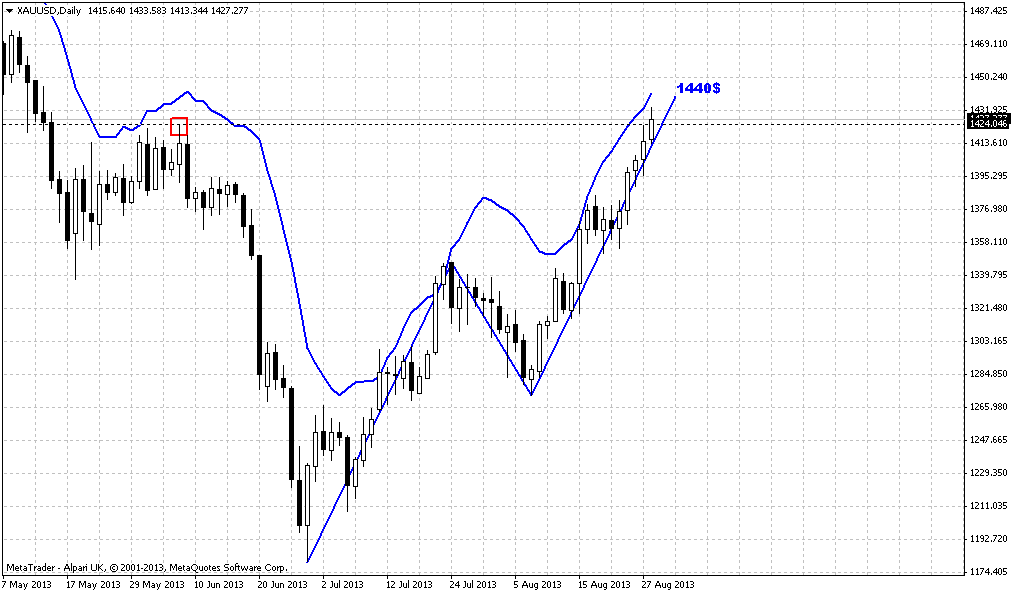
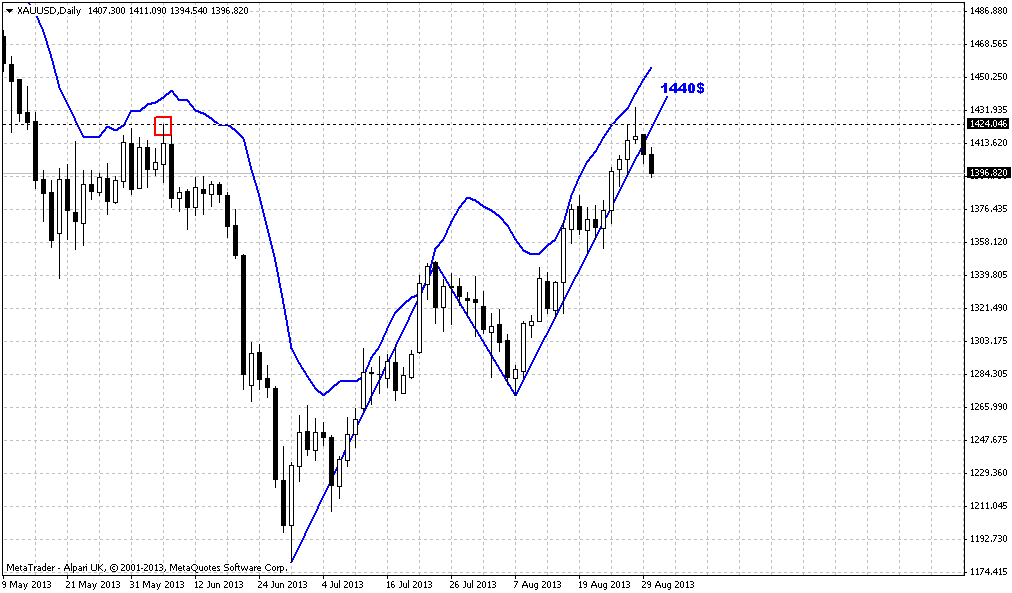
Daily
Situation here is not very easy. Precisely speaking, patterns are simple, but it is not very simple to choose correct action with them. In fact, here market could show two different AB=CD patterns. Pure AB=CD that is smaller, since it based on the point when real upward action has started (maroon lines) and big, total AB=CD, that is greater if we will take whole upward leg. And problem is that market could follow to any target. Currently we do not need to care much about second target, since it stands beyond overbought area by far. First and closer target stands right at WPR1, so this could become significant resistance. Major support for coming week will be at WPS1 since it coincides with lower border of previous consolidation. As market has passed through minor 0.618 AB-CD target and continued move up, it has no reasons to return back prior hitting final AB=CD target from bullish point of view. Especially, if we will take into consideration absence of any solid resistance ahead the market. Here, probably we could do nothing, but be very careful to any possible reversal patterns, that could trigger retracement down around 1420-1424 area first. If there will not be any, it means that market probably will continue to 1440 target of big AB=CD.
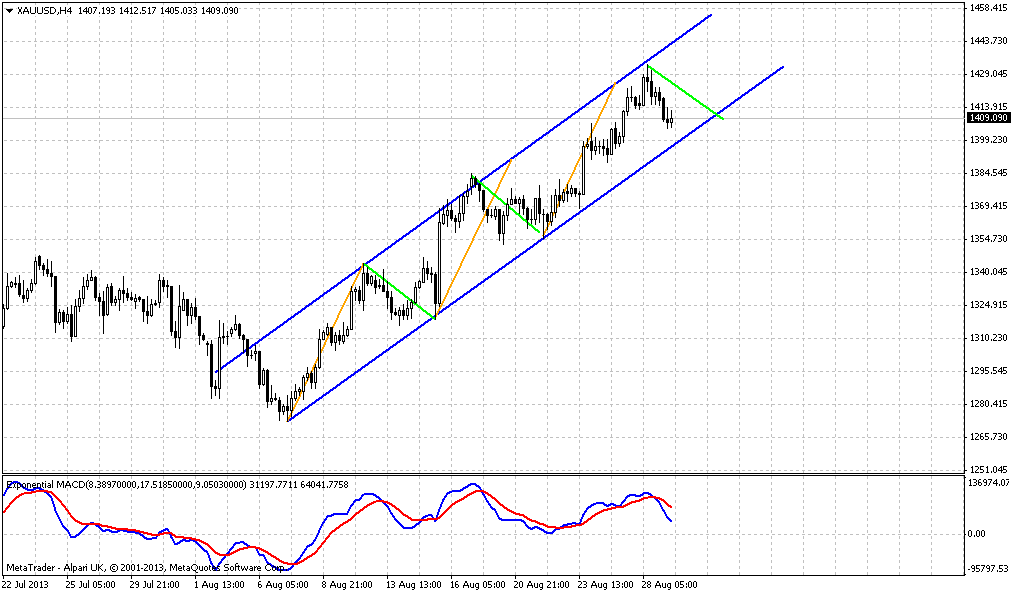
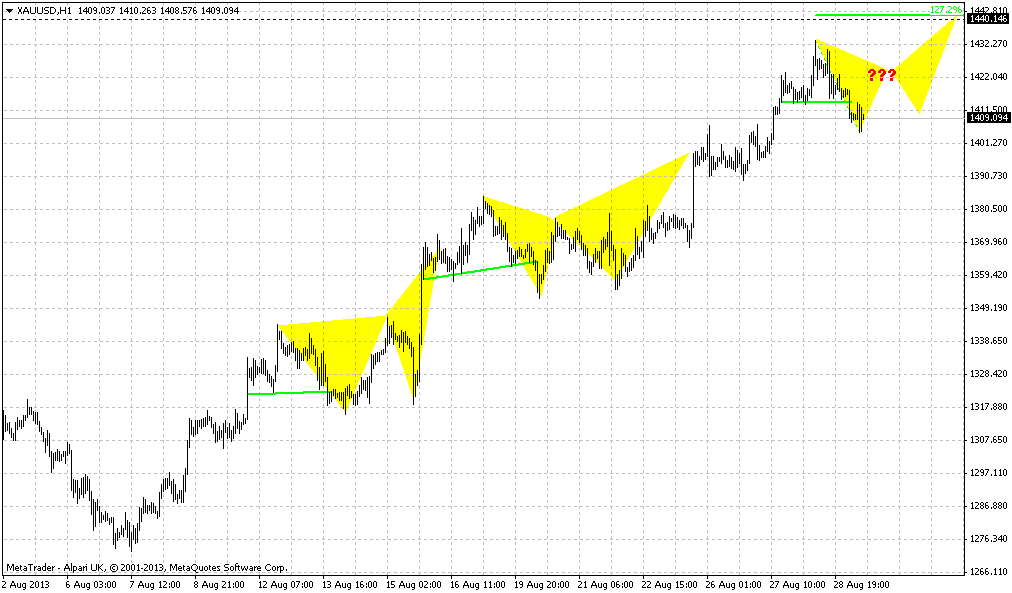
4-hour
Here we have harmonic picture. Market stands in progress with our butterfly pattern and passed through its 1.27 extension target by just single upward candle. Usually such action assumes that market will continue to 1.618 extension and this probably will happen. But major moment here is that target of butterfly stands lower than the target of AB-CD on daily chart. It means that this is not the reversal pattern that we’re watching. Be careful with this butterfly. In fact, it has done it’s task – it has pointed on previous week on breakout. But when price will hit its target, it has big chances to either fail or show just minimum down retracement. Since at 1404 market will not hit yet the major target on daily chart. Or, this will turn to trap, as we saw million of times – fake reversal prior hitting major target and then return right back.
Here we also see support of pivot points by Fib levels.
Conclusion:
Technically and fundamentally gold market stands in long-term bearish motion, but there are more and more factors start to appear that make downward action as not as cloudless as it was recently. Also we’ve got VOB pattern that gives us forecast for long-term price behavior and promise compounded downward move in shape of some AB-CD.
Fundamentally some supportive factors have appeared, and this could shift to greater retracement. On passed week market again has given us a confirmation of this thought. Currently we have reasons as technical as fundamental to suggest that this could be upward retracement on long term charts.
Most recent action shows that market is approaching to significant target on daily time frame and we must be careful since retracement could start at any moment. However the problem is – we do not know whether market will stop at nearest target or will try to reach 1440, the target of greater AB=CD. Let’s hope that we will get some clarification later.
The technical portion of Sive's analysis owes a great deal to Joe DiNapoli's methods, and uses a number of Joe's proprietary indicators. Please note that Sive's analysis is his own view of the market and is not endorsed by Joe DiNapoli or any related companies.
Now is the end of August and gold is entering seasonal bullish trend. External data and events in general support moderate positive sentiment for gold. Most significant events on past week were Fed meeting and new home sales data release. Sales of new single-family homes in the United States fell more than 13 percent in July to their lowest level in nine months. The Commerce Department data was much weaker than expected, even during a month when Fed stimulus remained in place. "The new home sales number is terrible, so the fear is clearly that higher interest rate (are) going to topple this housing recovery, which means the Fed has to ease and not tighten," said Axel Merk to Reuters, portfolio manager of Merk Funds which has around $500 million in currency mutual-fund assets.
As a result, Gold rose almost 2 percent on Friday, hitting its highest price in more than two months near $1,400 an ounce. For the week, gold gained 1.6 percent for its third consecutive weekly rise. It has climbed in six out of the past seven weeks since gold fell to a three-year low at $1,180 an ounce on June 28. Bullion also drew support when three Fed officials expressed divergent views on when to reduce the central bank's $85 billion monthly bond buying. Investors have been trying to predict what will happen at a Fed policy meeting next month.
Still, some analysts said that gold's recent rallies in thin trading suggest gains could fizzle easily, especially with the Fed's planned stimulus cut and overall improvement in global economic conditions. Another reason is that seasonal trend mostly is based on demand jump in India and China. Recent data shows that demand in top buyers India and China has been subdued ahead of the traditional major gold-buying events in Asia, driven by India's Hindu festivals and peak wedding season, and as jewelers start to stockpile ahead of the Chinese New Year. Premiums in Hong Kong, the key supplier of gold to China, have fallen to about $4 an ounce over London spot prices as of Friday, dealers said, from $5 last week. At the same time South Africa's National Union of Mineworkers is consulting its membership on a strike in the gold industry, which could start next week, halting production for the country's main mineral export. But, probably it is a bit early for panic and thoughts that seasonal trend will fail. Situation on retail gold market chances fast and demand could increase significantly during nearest month.
Recent CFTC data shows shy dynamic as on previous week, but here we still can see, that open interest grows with increasing net long position. It is also valuable sign that SPDR Fund shows second week of inflows. Thus, from minimum around 909 tonnes 2 weeks ago, now it has assets at 920 tonnes.
So, we do not see any drastical changes in fundamental situation on gold market. Currently market starts to move and confirm our long-term analysis, since we’ve expected to see upward action at the end of August, and now we see it. Now the question is where this move will finish and what the level will be. Recall that we treat this current move up only as retracement, although big and valuable retracement. Our target is 1550-1600 area that should be achieved by February 2014 or may be a bit earlier. We will see. From the fundamental point of view we should search trade opportunities on lower time frames in south direction. New turmoil in Egypt and difficult situation in Middle East in general also adds some geopolitical pressure on financial markets. On spot market we again see slow down of ETF outflow on example of SPDR fund. Different parts of gold market confirm changing sentiment, or at least, reducing of its bearishness.
Monthly
Currently by August candle market shows nice appreciation. Still we keep in mind Volatility breakout pattern and know that there will be 3-leg downward action. This means that current bounce will be just retracement probably. Second, currently we know that market at support – Fib support, target of rectangle breakout, completion of double harmonic swing down and monthly deep oversold. Unfortunately monthly chart does not give us much assistance in short-term trading. One bullish pattern that probably could be seen here is bullish DiNapoli “Stretch” pattern, since market stands at deep oversold right at Fib support. Thus, this is not the time to take long-term short position, but time to think about their close and searching for bullish patterns on lower time frames – weekly and daily. Target of this pattern is a middle between Oscillator Predictor Bands – right around 1550$ area. S&P analyst specifies approximately the same target. This area agrees with “Stretch” pattern as well.
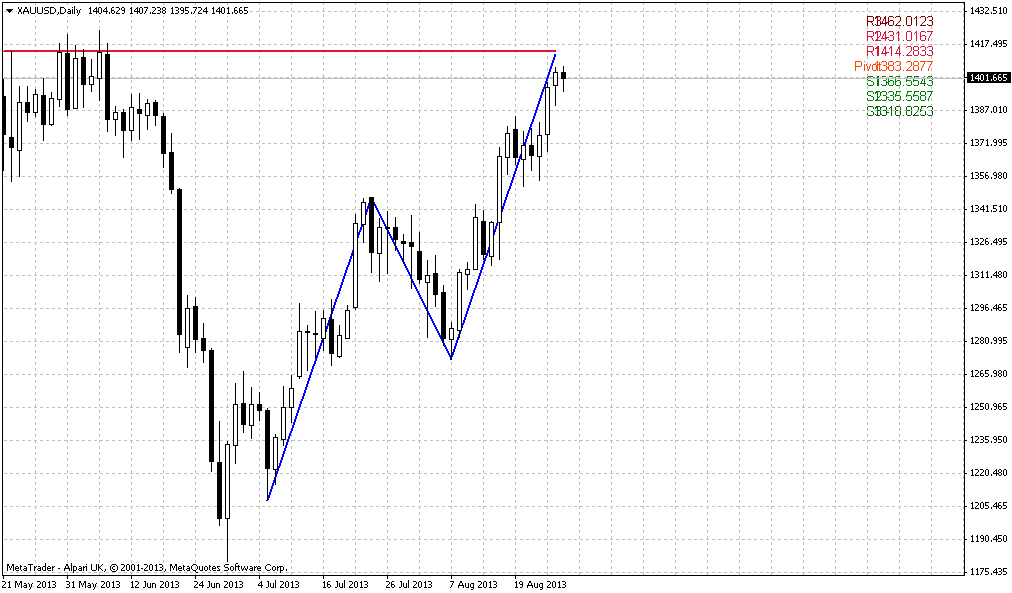
Weekly
On weekly chart market confirms moderately bullish sentiment, we have bullish trend on weekly.
Price development looks pretty good by far. In fact, there is no questions at all – gradual and constant upward action. Another bullish moment has appeared on previous week – market has passed through and closed above MPR1. This usually happens when market stands not just in retracement but with bullish trend. Previously we’ve said much about bullish patterns, but major confirmation is still ahead – market should show greater upward swing than previous swing down. Only in this case we will be sure with reversal. That is, in fact our next short-term target – 1424 the top of previous swing down.
Do not worry, if you weren’t able to take long position yet. If we will be right with our analysis, usually after reversal swing will be completed, market has a tendency do show deep retracement, may be even AB=CD. Thus, we will get our chance, no doubts. Now I speak about those who trade really long term, on weekly and monthly charts.
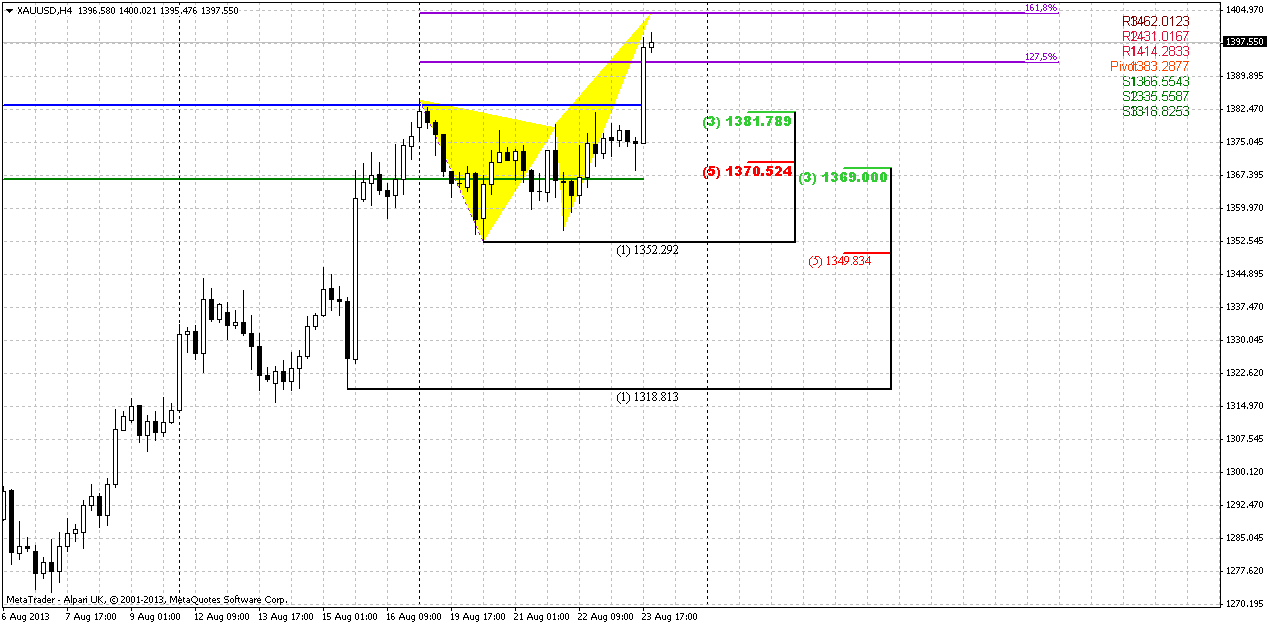
Daily
Situation here is not very easy. Precisely speaking, patterns are simple, but it is not very simple to choose correct action with them. In fact, here market could show two different AB=CD patterns. Pure AB=CD that is smaller, since it based on the point when real upward action has started (maroon lines) and big, total AB=CD, that is greater if we will take whole upward leg. And problem is that market could follow to any target. Currently we do not need to care much about second target, since it stands beyond overbought area by far. First and closer target stands right at WPR1, so this could become significant resistance. Major support for coming week will be at WPS1 since it coincides with lower border of previous consolidation. As market has passed through minor 0.618 AB-CD target and continued move up, it has no reasons to return back prior hitting final AB=CD target from bullish point of view. Especially, if we will take into consideration absence of any solid resistance ahead the market. Here, probably we could do nothing, but be very careful to any possible reversal patterns, that could trigger retracement down around 1420-1424 area first. If there will not be any, it means that market probably will continue to 1440 target of big AB=CD.
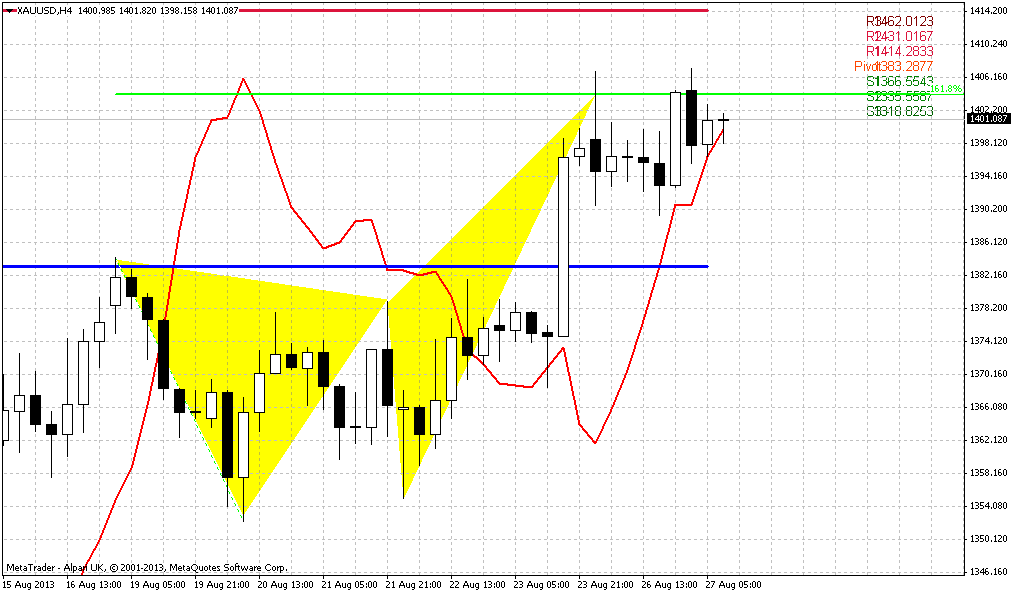
4-hour
Here we have harmonic picture. Market stands in progress with our butterfly pattern and passed through its 1.27 extension target by just single upward candle. Usually such action assumes that market will continue to 1.618 extension and this probably will happen. But major moment here is that target of butterfly stands lower than the target of AB-CD on daily chart. It means that this is not the reversal pattern that we’re watching. Be careful with this butterfly. In fact, it has done it’s task – it has pointed on previous week on breakout. But when price will hit its target, it has big chances to either fail or show just minimum down retracement. Since at 1404 market will not hit yet the major target on daily chart. Or, this will turn to trap, as we saw million of times – fake reversal prior hitting major target and then return right back.
Here we also see support of pivot points by Fib levels.
Conclusion:
Technically and fundamentally gold market stands in long-term bearish motion, but there are more and more factors start to appear that make downward action as not as cloudless as it was recently. Also we’ve got VOB pattern that gives us forecast for long-term price behavior and promise compounded downward move in shape of some AB-CD.
Fundamentally some supportive factors have appeared, and this could shift to greater retracement. On passed week market again has given us a confirmation of this thought. Currently we have reasons as technical as fundamental to suggest that this could be upward retracement on long term charts.
Most recent action shows that market is approaching to significant target on daily time frame and we must be careful since retracement could start at any moment. However the problem is – we do not know whether market will stop at nearest target or will try to reach 1440, the target of greater AB=CD. Let’s hope that we will get some clarification later.
The technical portion of Sive's analysis owes a great deal to Joe DiNapoli's methods, and uses a number of Joe's proprietary indicators. Please note that Sive's analysis is his own view of the market and is not endorsed by Joe DiNapoli or any related companies.

")