Sive Morten
Special Consultant to the FPA
- Messages
- 18,699
Fundamentals
Gold rose 1 percent on Friday, rallying for a second consecutive day with a boost from renewed fund buying and equities' weakness after bullion posted its worst annual decline in 2013 in more than 30 years. Brisk coin buying, strong Chinese physical demand and new positions initiated by funds related to new-year index rebalancing also helped lift gold to a weekly gain of more than 2 percent, its largely rise in 10 weeks. Analysts said gold appeared to find support from equities' losses this week after bullion's tumble and the stock market's strong run last year. "Positive bullion prices in reaction to the decline in equities may set the tone for 2014 and reinforce the negative correlation between the two," said James Steel, chief precious metals analyst at HSBC. Traders also cited short covering for the metal's strength as bullion has rallied more than 4 percent after hitting a six-month low at under $1,200 an ounce on Tuesday. U.S. Comex gold futures for February delivery settled up $13.40 at $1,238.60 an ounce, with trading volume about 20 percent below its 30-day average, preliminary Reuters data showed.
Gold's gains came after it lost nearly 30 percent in 2013, ending a 12-year bull run, largely due to the U.S. Federal Reserve's plan to unwind its monetary stimulus. Bullion's second day of sharp gains came as U.S. stocks eased on Friday, extending a broad decline in the new year with major indexes on track to end the week lower. Premiums on the Shanghai Gold Exchange showed that Chinese buying has picked up in recent days as global prices hovered around $1,200 near the end of 2013, dealers said. Also boosting gold market sentiment were brisk sales of the U.S. Mint's new 2014-dated American Eagle gold coins on the first business day of the year, extending last year's strength boosted by gold prices' broad decline.
Some analysts, however, cautioned that the upward momentum in the early days of the new year may only last a few weeks due to some index rebalancing activity. A stronger U.S. dollar and heavy losses in crude oil prices this week could pressure the precious metal as more participants return next week following the recent holidays, said Edward Meir, metals analyst at brokerage INTL FCStone.
Among other precious metals, silver rose 0.4 percent to $20.08 an ounce. Platinum gained 0.4 percent to $1,406.74, and palladium eased 0.1 percent to $725.72 an ounce. Platinum group metals now digest news that the top four automakers in the U.S. market missed December sales expectations. However, 2013 will still easily be the best year for the industry since before the recession.
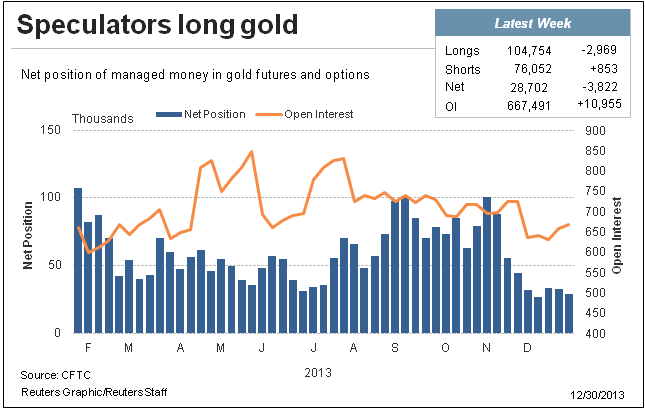
CFTC data has not changed much from previous week. Recent data shows increasing of short positions with shy growth of open interest, but hardly we could call changes as significant.
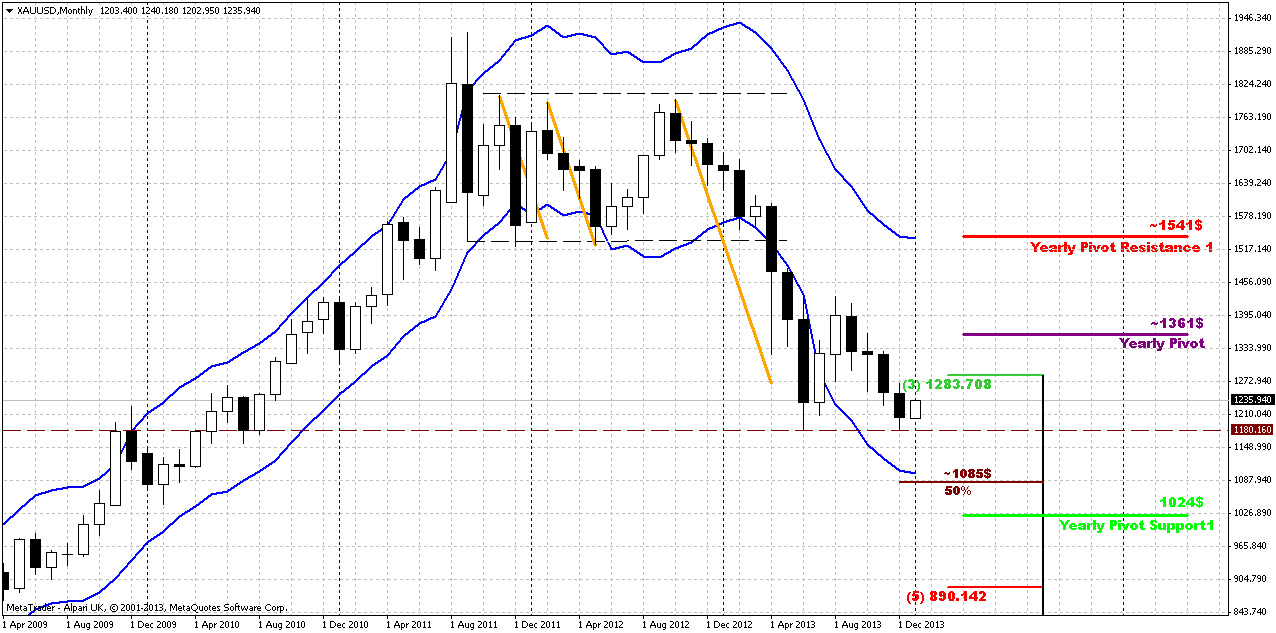
Monthly
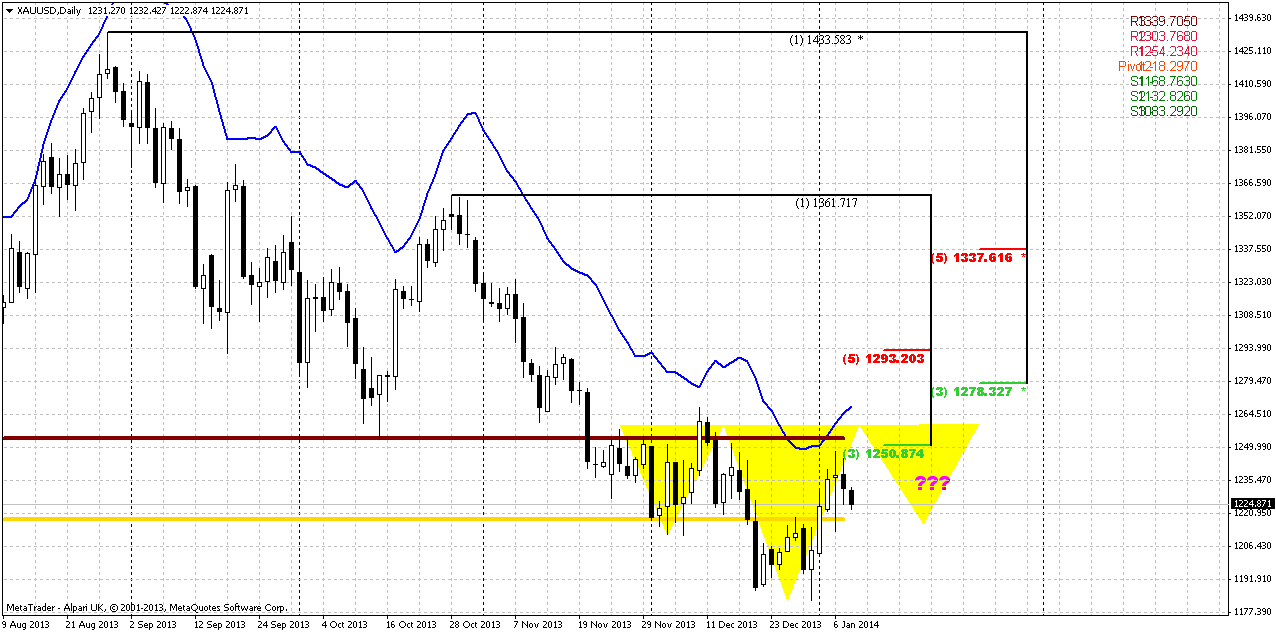
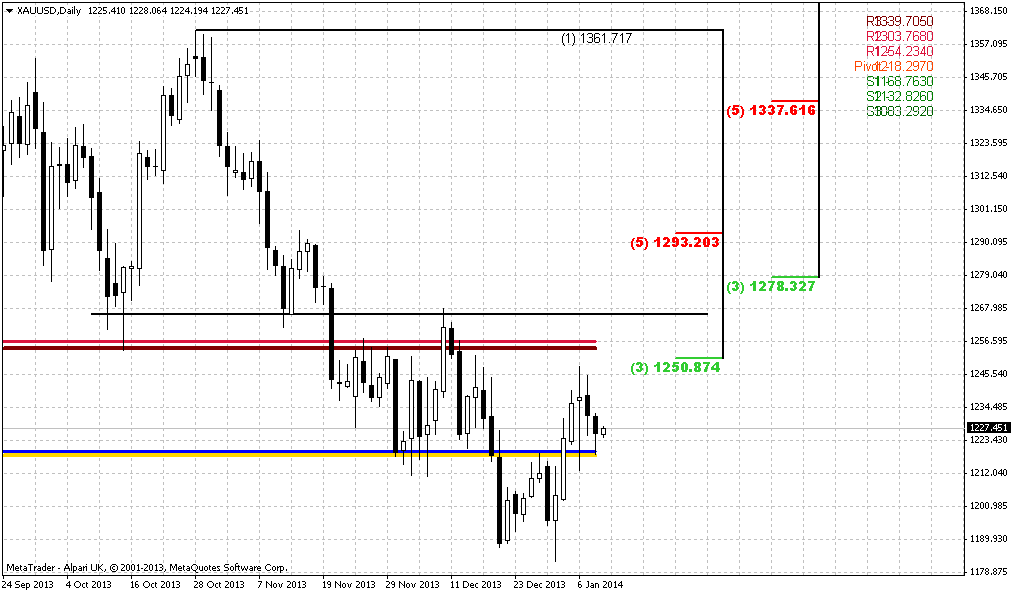
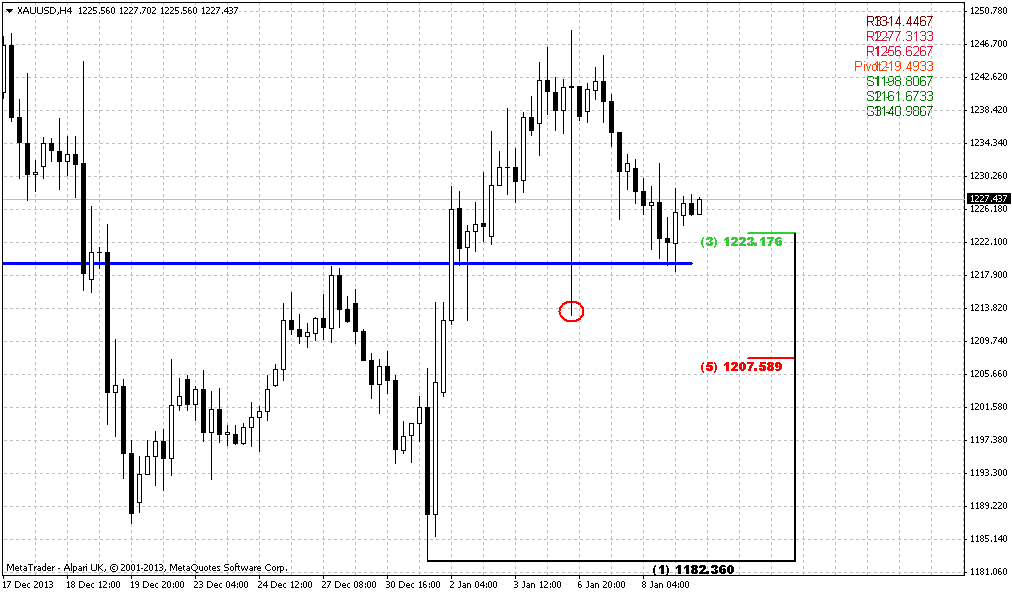
January has started with upward action. Our forum member Triantus yesterday has posted chart where we can see that gold market has cleared 1180 lows. This is really significant moment and it could point our analysis upside down. Thus I’ve checked different exchanged-traded charts. Bullion price on London exchange shows that there was no W&R of 1180 lows. While continious futures on COMEX shows that there was really W&R of previous lows. If this is really the case, then all becomes clear – why market has shown solid appreciation and that AUD action was really very helpful for analysis of gold market.
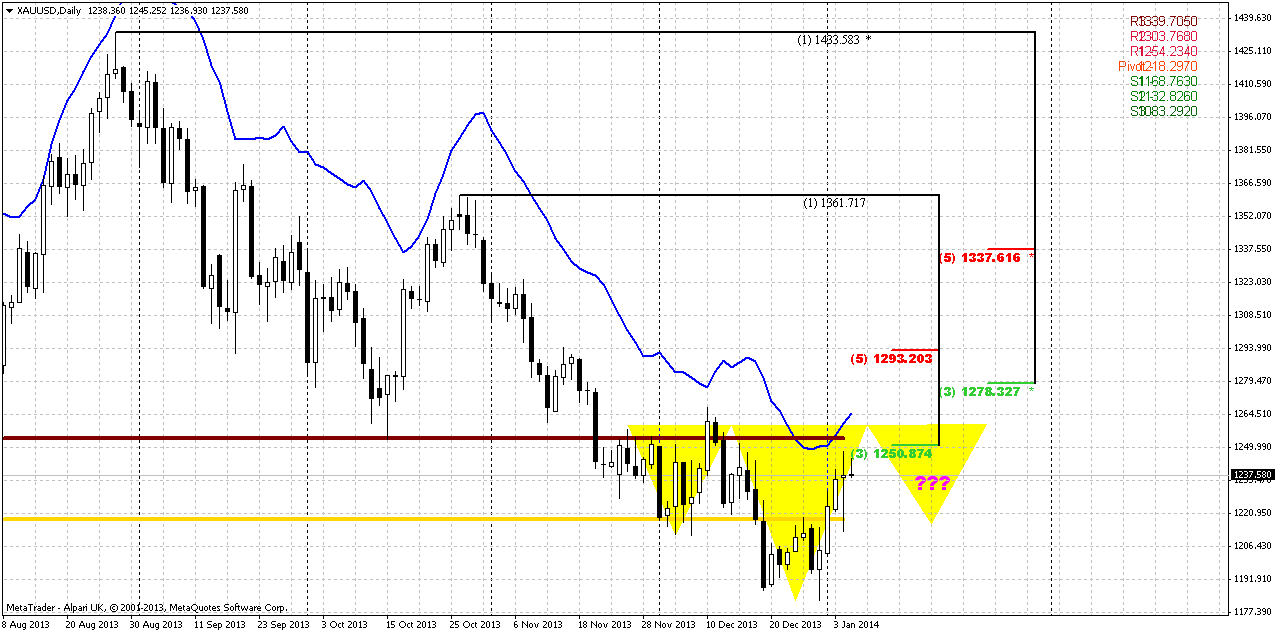
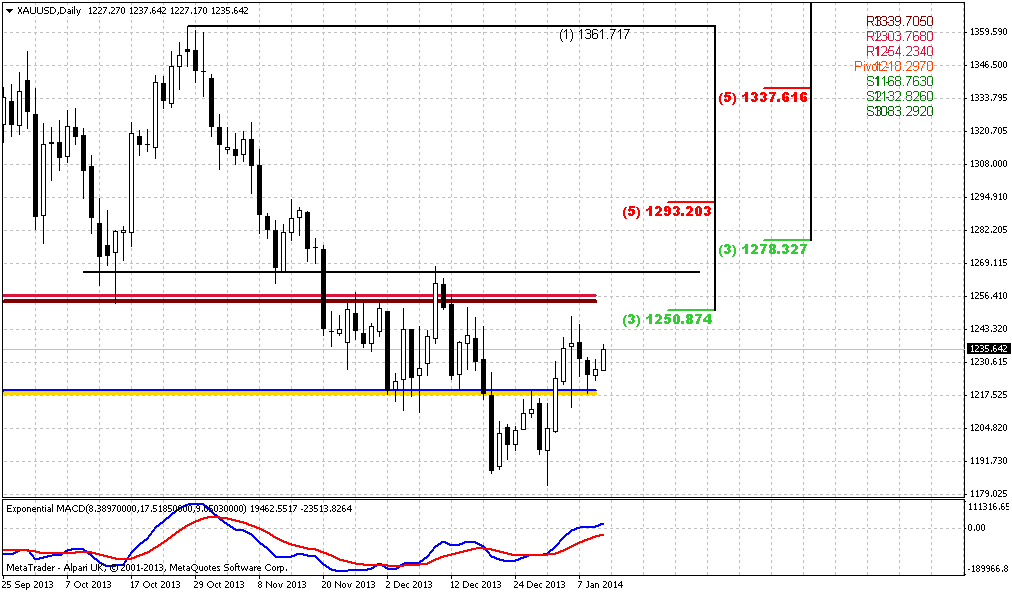
 Other changes are still shy here. Trend still holds bearish. As on EUR, here I also have drawn new yearly Pivot Points. Appearing of 1361 Yearly PP could get special meaning from possible retracement point of view. It could become possible nearest upside target. Yearly PR1 is also very significant. We know that gold likes to re-test previously broken lows and consolidations. 1540 area is monthly overbought, YPR1 and low border of broken long-term rectangle. As market was strongly oversold, why it can’t reach overbought? This is very typical action for any market.
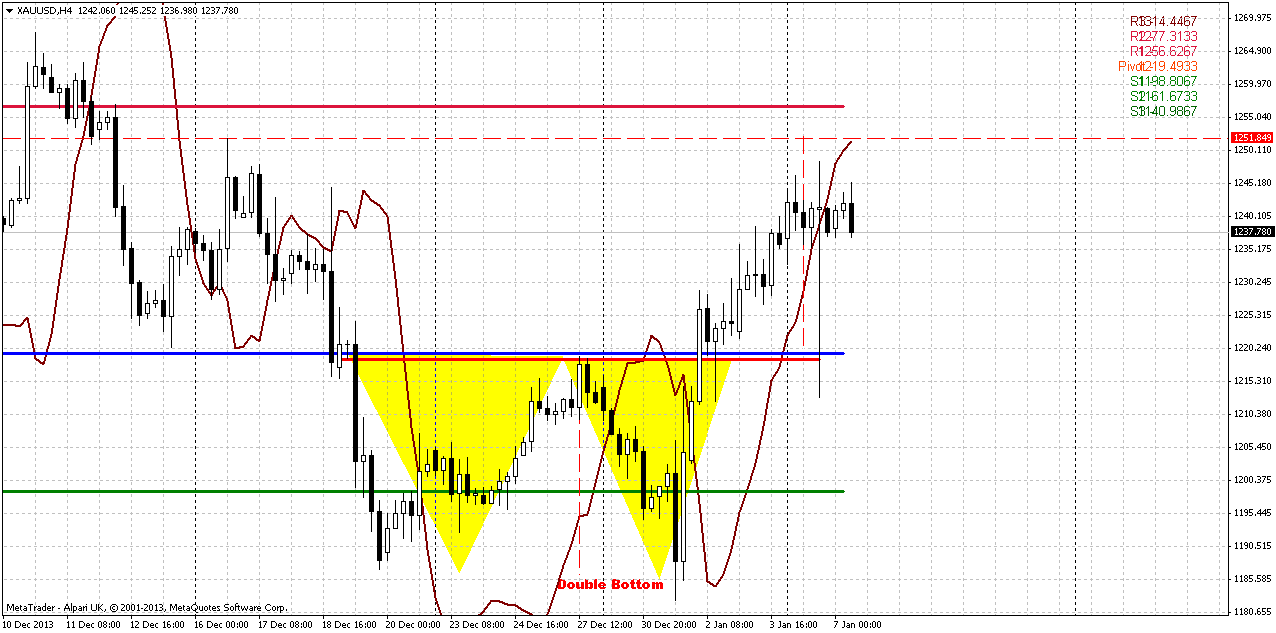
As another application of significantly oversold we’ve suggested retracement up. Thus, we’ve made an assumption of possible deeper upward retracement that could take a shape of AB=CD, and invalidation for this setup is previous lows around 1170s. In fact current move up could be the last chance for possible upward bounce, if, say, market will show something like double bottom. Currently price action is very suitable for that – W&R of first bottom. This action in general is very typical for double bottoms and fake breakout could be the first sign of possible retracement up. Bearish market has no other reasons to stop right here, since there is no support right now – it has passed through 3/8 support, it’s not at oversold. Currently we should keep a close eye on move up. Now I’m gravitating to the thought that there really was W&R. Comex data is more reliable than just some Retail Forex broker, even Alpari UK.
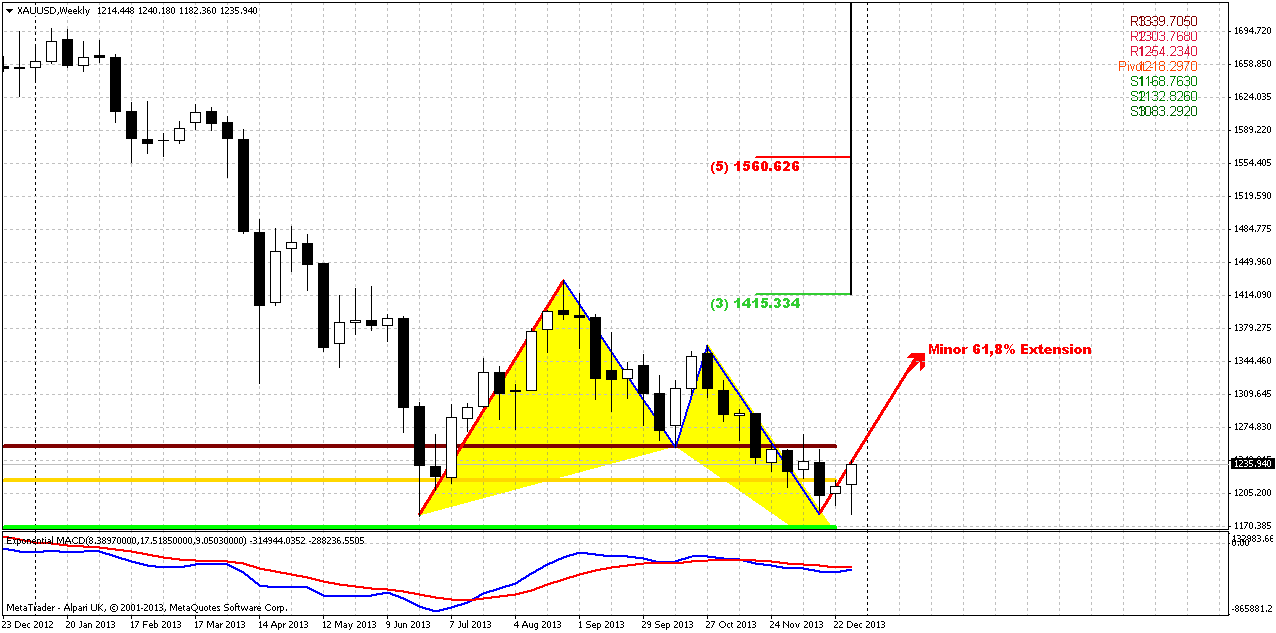
Weekly
Trend is still bearish here. Initially we’ve thought that this could become butterfly “buy” pattern, but it also could be “222” Buy, since if we’ve suggested that AB=CD has been completed and W&R really has happened, this could be double bottom. Also take a look, we have solid bullish divergence with MACD. By treating valleys as AB=CD pattern we’ll see that minor extension stands almost right at Yearly Pivot Point, and 1.618 extension stands slightly higher than Yearly PR1. This is really interesting agreement. Weekly chart points that we should search possibility for long entry. Odds suggest that after AB=CD completion market usually shows at minimum 3/8 retracement, and on the weekly chart this will be not small move. This, of cause, makes sense only if W&R of 1180 lows really has happened. If we will be wrong with this suggestion then we will get the trap that we’ve discussed previously.
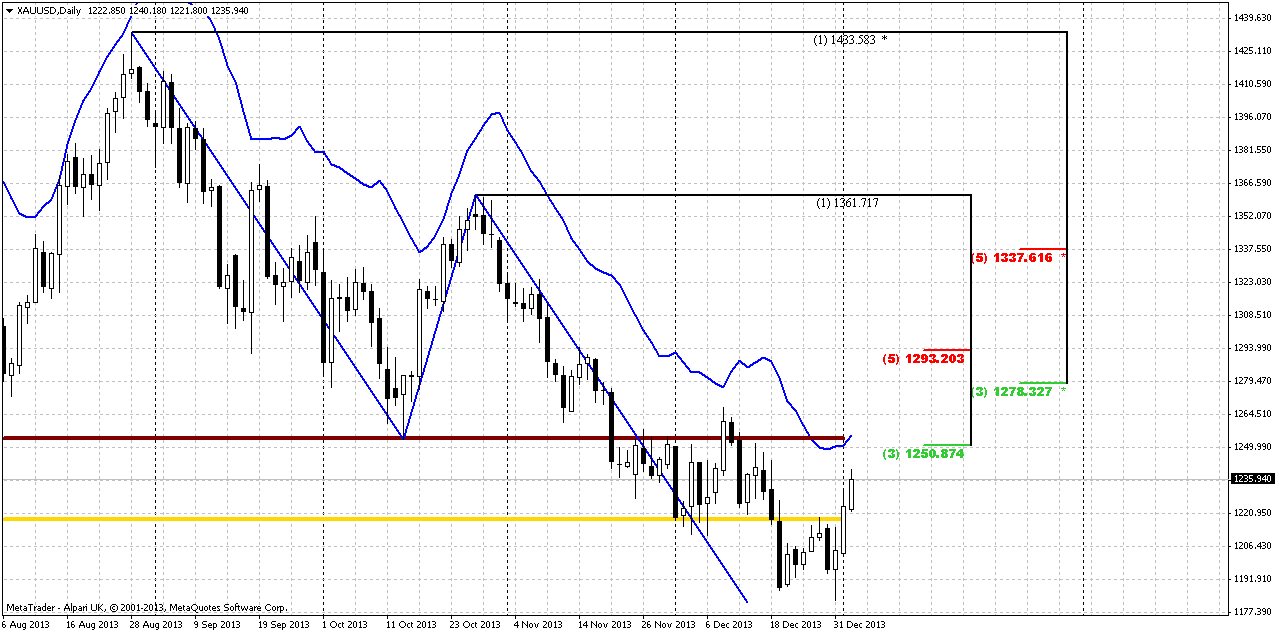
Daily
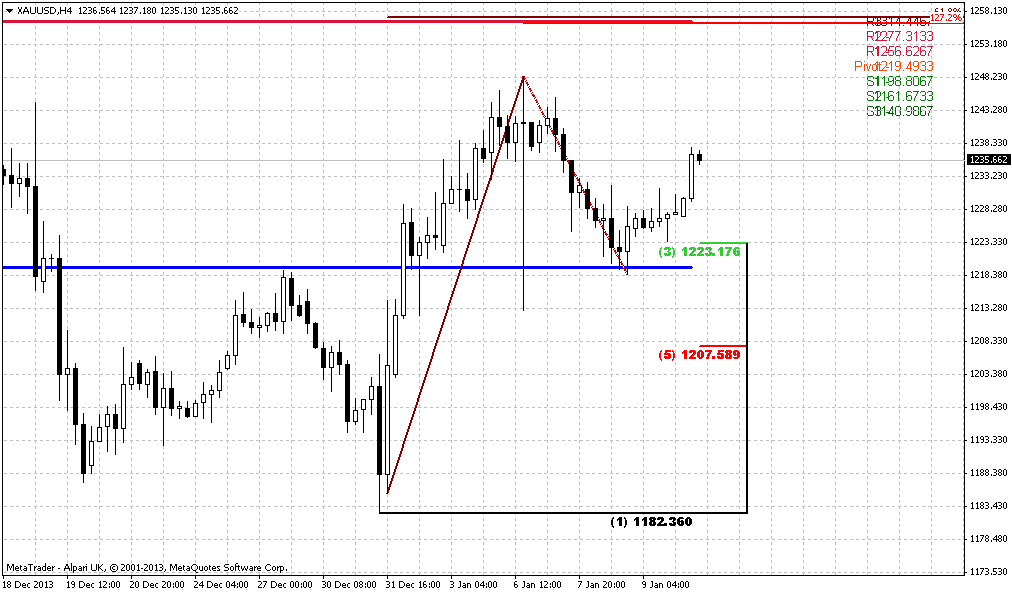
As we’ve decided that CME Gold futures charts deserve more trust than Alpari UK ones, let’s suggest that market still has touched daily targets. Now market stands above WPP and WPR1, trend holds bullish here. In this case we need to search possibility enter long. Next destination point is 1250 Fib resistance accompanied by MPR1 and daily overbought. In general, we could get reversed H&S pattern here that should lead market at minimum to 1280-1293 K-resistance area, but this is a bit extended view. So, if we will be lucky we will get chance to take long position prior 1250, if not – then we will need to wait bounce off the 1250 resistance to take position.
4-hour
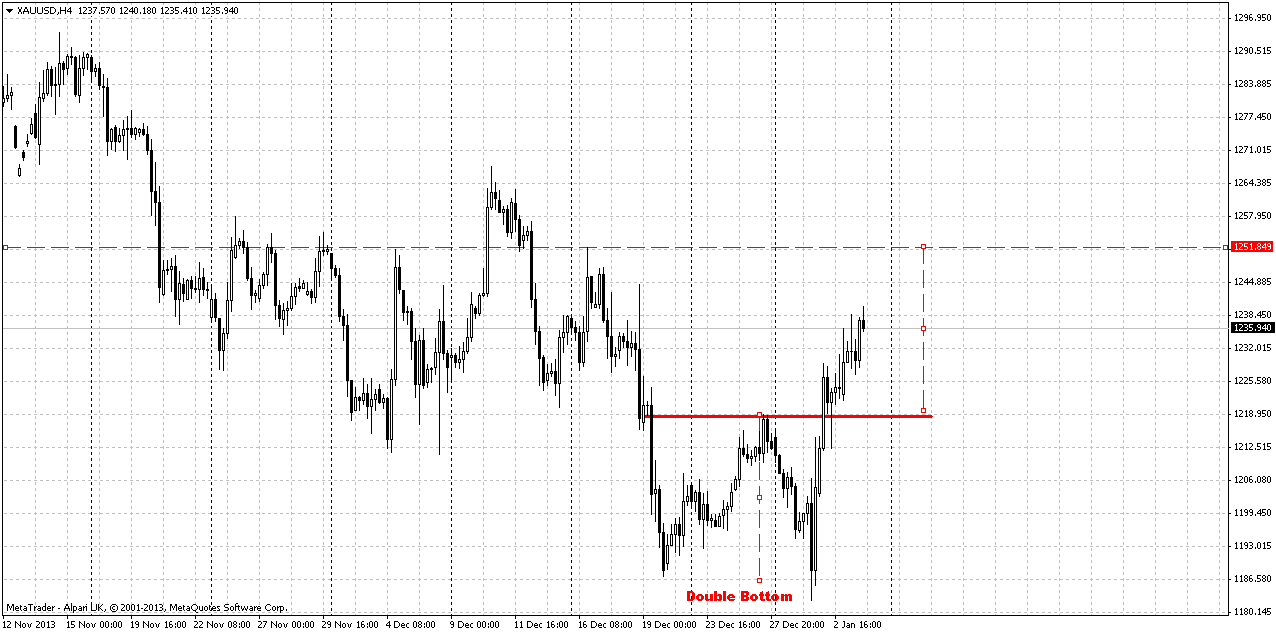
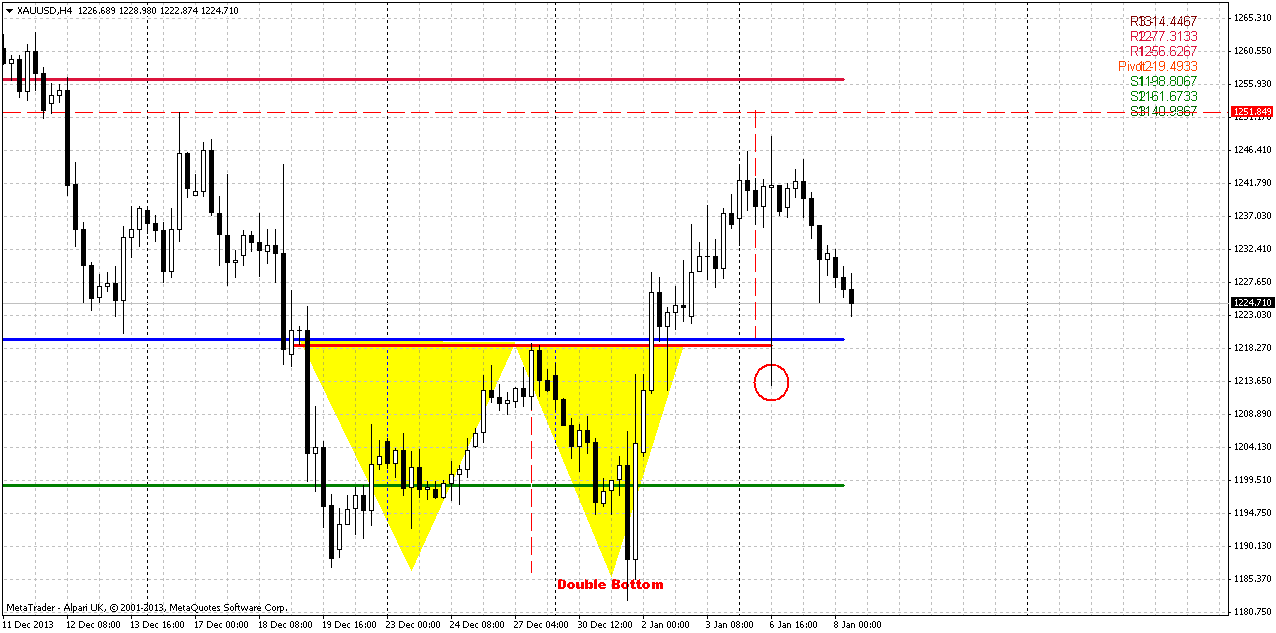
On 4-hour chart we probably have smaller Double Bottom pattern, since W&R stands also for recent intraday lows as well. Target of this pattern is the same – 1250 level. Trend is bullish here.
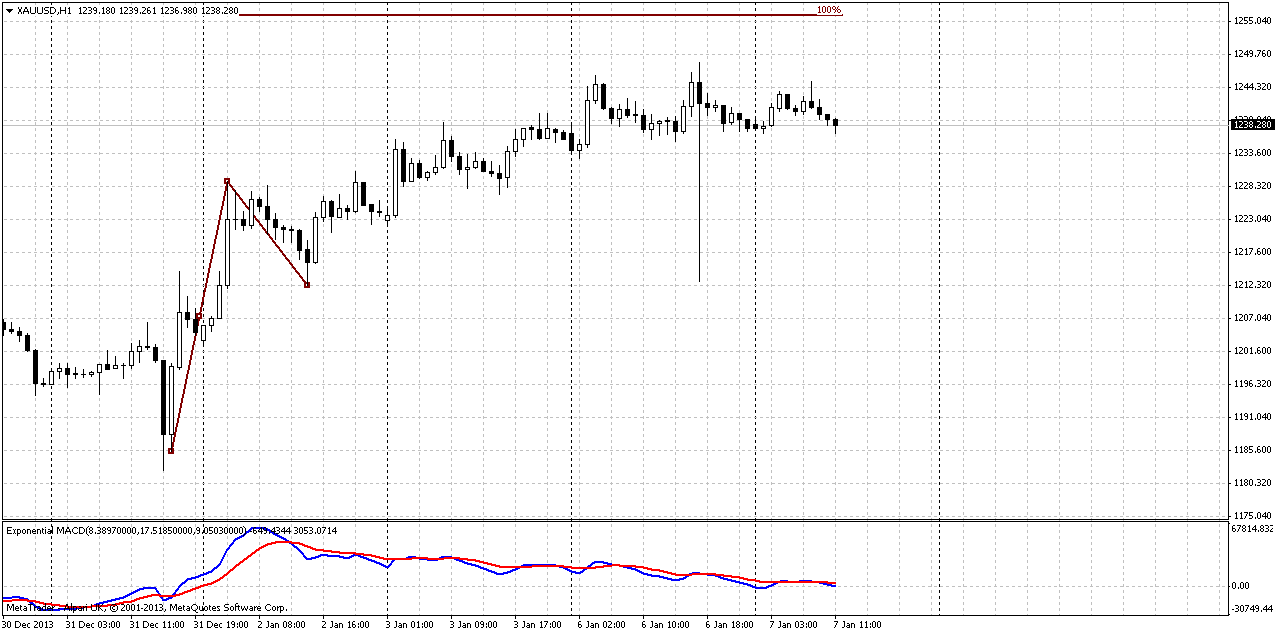
1-hour
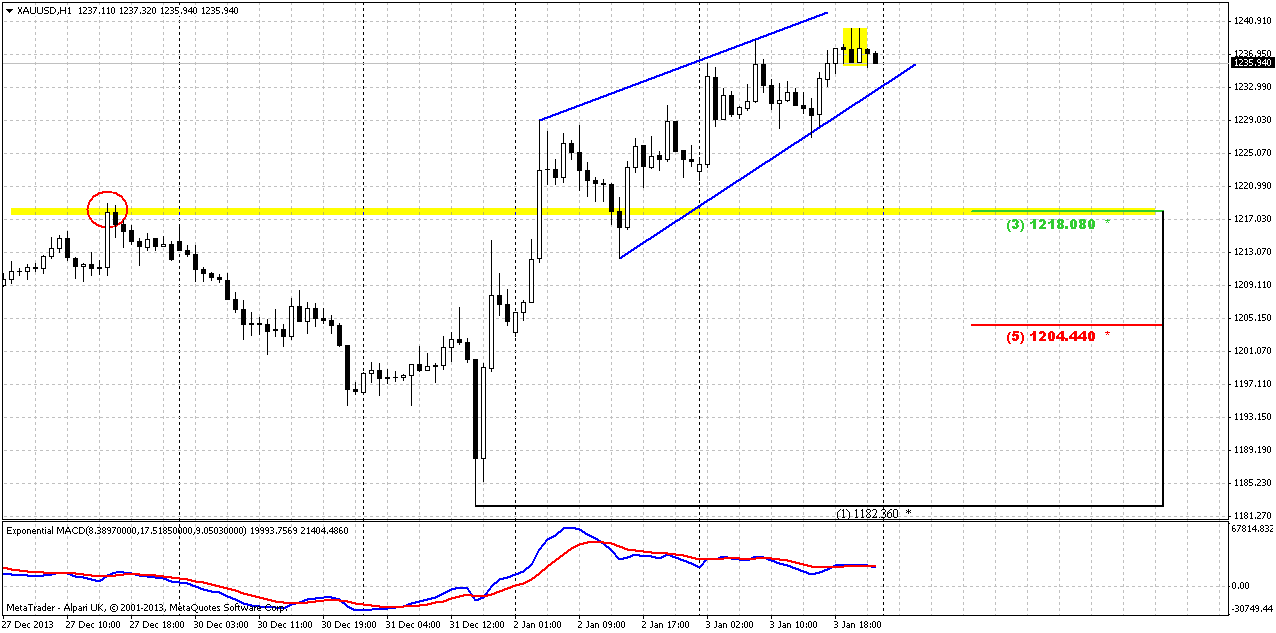
Hourly chart shows that retracement down still could possible prior reaching of 1250 area. Thus, here we have wedge pattern accompanied by divergence and Tweezer tops pattern. This pattern is not as strong as, say, engulfing pattern, but still, it has reversal quality. Depending on how this retracement will develop, I hope we will understand whether this was real reversal up or not yet. At first glance 1218 level looks acceptable, since this is combination of Fib support and neck line of 4-hour Double Bottom pattern.
Conclusion:
Currently we still have suspicions concerning reality of reversal, although we have to appoint that upward action looks really nice. We still will try to rely on COMEX Data and treat this move as reversal. In long term perspective market could hit as Yearly PP as PR1 that stands in agreement with gold’s habit and weekly AB=CD pattern. After retracement will be completed we can’t exclude another leg down, since in 2013 we’ve got volatility breakout. And, as a rule, VOB leads to 2-leg action.
In short-term perspective upward action has 1250 target. If market will show retracement down before it will hit 1250, we will try to take long position. At first glance 1218 level looks suitable.
The technical portion of Sive's analysis owes a great deal to Joe DiNapoli's methods, and uses a number of Joe's proprietary indicators. Please note that Sive's analysis is his own view of the market and is not endorsed by Joe DiNapoli or any related companies.
Gold rose 1 percent on Friday, rallying for a second consecutive day with a boost from renewed fund buying and equities' weakness after bullion posted its worst annual decline in 2013 in more than 30 years. Brisk coin buying, strong Chinese physical demand and new positions initiated by funds related to new-year index rebalancing also helped lift gold to a weekly gain of more than 2 percent, its largely rise in 10 weeks. Analysts said gold appeared to find support from equities' losses this week after bullion's tumble and the stock market's strong run last year. "Positive bullion prices in reaction to the decline in equities may set the tone for 2014 and reinforce the negative correlation between the two," said James Steel, chief precious metals analyst at HSBC. Traders also cited short covering for the metal's strength as bullion has rallied more than 4 percent after hitting a six-month low at under $1,200 an ounce on Tuesday. U.S. Comex gold futures for February delivery settled up $13.40 at $1,238.60 an ounce, with trading volume about 20 percent below its 30-day average, preliminary Reuters data showed.
Gold's gains came after it lost nearly 30 percent in 2013, ending a 12-year bull run, largely due to the U.S. Federal Reserve's plan to unwind its monetary stimulus. Bullion's second day of sharp gains came as U.S. stocks eased on Friday, extending a broad decline in the new year with major indexes on track to end the week lower. Premiums on the Shanghai Gold Exchange showed that Chinese buying has picked up in recent days as global prices hovered around $1,200 near the end of 2013, dealers said. Also boosting gold market sentiment were brisk sales of the U.S. Mint's new 2014-dated American Eagle gold coins on the first business day of the year, extending last year's strength boosted by gold prices' broad decline.
Some analysts, however, cautioned that the upward momentum in the early days of the new year may only last a few weeks due to some index rebalancing activity. A stronger U.S. dollar and heavy losses in crude oil prices this week could pressure the precious metal as more participants return next week following the recent holidays, said Edward Meir, metals analyst at brokerage INTL FCStone.
Among other precious metals, silver rose 0.4 percent to $20.08 an ounce. Platinum gained 0.4 percent to $1,406.74, and palladium eased 0.1 percent to $725.72 an ounce. Platinum group metals now digest news that the top four automakers in the U.S. market missed December sales expectations. However, 2013 will still easily be the best year for the industry since before the recession.
CFTC data has not changed much from previous week. Recent data shows increasing of short positions with shy growth of open interest, but hardly we could call changes as significant.
Monthly
January has started with upward action. Our forum member Triantus yesterday has posted chart where we can see that gold market has cleared 1180 lows. This is really significant moment and it could point our analysis upside down. Thus I’ve checked different exchanged-traded charts. Bullion price on London exchange shows that there was no W&R of 1180 lows. While continious futures on COMEX shows that there was really W&R of previous lows. If this is really the case, then all becomes clear – why market has shown solid appreciation and that AUD action was really very helpful for analysis of gold market.
As another application of significantly oversold we’ve suggested retracement up. Thus, we’ve made an assumption of possible deeper upward retracement that could take a shape of AB=CD, and invalidation for this setup is previous lows around 1170s. In fact current move up could be the last chance for possible upward bounce, if, say, market will show something like double bottom. Currently price action is very suitable for that – W&R of first bottom. This action in general is very typical for double bottoms and fake breakout could be the first sign of possible retracement up. Bearish market has no other reasons to stop right here, since there is no support right now – it has passed through 3/8 support, it’s not at oversold. Currently we should keep a close eye on move up. Now I’m gravitating to the thought that there really was W&R. Comex data is more reliable than just some Retail Forex broker, even Alpari UK.
Weekly
Trend is still bearish here. Initially we’ve thought that this could become butterfly “buy” pattern, but it also could be “222” Buy, since if we’ve suggested that AB=CD has been completed and W&R really has happened, this could be double bottom. Also take a look, we have solid bullish divergence with MACD. By treating valleys as AB=CD pattern we’ll see that minor extension stands almost right at Yearly Pivot Point, and 1.618 extension stands slightly higher than Yearly PR1. This is really interesting agreement. Weekly chart points that we should search possibility for long entry. Odds suggest that after AB=CD completion market usually shows at minimum 3/8 retracement, and on the weekly chart this will be not small move. This, of cause, makes sense only if W&R of 1180 lows really has happened. If we will be wrong with this suggestion then we will get the trap that we’ve discussed previously.
Daily
As we’ve decided that CME Gold futures charts deserve more trust than Alpari UK ones, let’s suggest that market still has touched daily targets. Now market stands above WPP and WPR1, trend holds bullish here. In this case we need to search possibility enter long. Next destination point is 1250 Fib resistance accompanied by MPR1 and daily overbought. In general, we could get reversed H&S pattern here that should lead market at minimum to 1280-1293 K-resistance area, but this is a bit extended view. So, if we will be lucky we will get chance to take long position prior 1250, if not – then we will need to wait bounce off the 1250 resistance to take position.
4-hour
On 4-hour chart we probably have smaller Double Bottom pattern, since W&R stands also for recent intraday lows as well. Target of this pattern is the same – 1250 level. Trend is bullish here.
1-hour
Hourly chart shows that retracement down still could possible prior reaching of 1250 area. Thus, here we have wedge pattern accompanied by divergence and Tweezer tops pattern. This pattern is not as strong as, say, engulfing pattern, but still, it has reversal quality. Depending on how this retracement will develop, I hope we will understand whether this was real reversal up or not yet. At first glance 1218 level looks acceptable, since this is combination of Fib support and neck line of 4-hour Double Bottom pattern.
Conclusion:
Currently we still have suspicions concerning reality of reversal, although we have to appoint that upward action looks really nice. We still will try to rely on COMEX Data and treat this move as reversal. In long term perspective market could hit as Yearly PP as PR1 that stands in agreement with gold’s habit and weekly AB=CD pattern. After retracement will be completed we can’t exclude another leg down, since in 2013 we’ve got volatility breakout. And, as a rule, VOB leads to 2-leg action.
In short-term perspective upward action has 1250 target. If market will show retracement down before it will hit 1250, we will try to take long position. At first glance 1218 level looks suitable.
The technical portion of Sive's analysis owes a great deal to Joe DiNapoli's methods, and uses a number of Joe's proprietary indicators. Please note that Sive's analysis is his own view of the market and is not endorsed by Joe DiNapoli or any related companies.
") ).
).