with charts
if i may, sive didn't say anything about a divergence explicitly. he wrote 'bullish dynamic pressure' in regards to price action (price kept bouncing off 1237.0 level), not indicator action. price action always comes first, indicator 2nd. in this instance, we can clearly see that there is some serious support propping the price up (of course, this changed this morning, but that's a different story).
yes, price is contradicting MACD, and some will argue that therefore MACD is pointing at some internal weakness build-up in price action, the move up is losing steam and therefore a downturn is near. however, many times an indicator can contradict price like this, and yet the bullish pressure in the price action wins the day by continuing upwards--the indicator just turns after the fact and starts pointing in the same direction as the most recent price action again.
so indicator only is totally unreliable. what is needed is whether or not price action is occurring at a key significant S/R level and what is the nature of said price action. then if that can be confirmed clearly, indicator is just additional sugar to make you feel better by providing so-called 'confirmation'.
as i was re-reading myself, i just remembered i forgot to add: although nominal resistance zone starts at 1247.0 until 1251.0, market decided that significant RSST level was going to be measured by the peaks closer to current price action and which stand no higher than 1245.0 (excluding the wick highs).
if that RSST level could have been confirmed clearly as being significant and key, then MACD could be read a showing exhaustion and potential reversal building up, which is eventually what happened this morning.
so problem is if most market participants consider a high to be a key RSST level but technically they should really consider another high, in essence making a technical mistake, well... that mistake becomes the new RSST level regardless of whether or not from an ideal technical point of view it should be treated as such because they are the ones with the power to move the market and the market will trade off of those levels when the whales decide those are the key levels. so whatever THEY (the big boys) are looking at and trading off of, becomes the law for the rest of us. regardless of theory. so our job is to guess as accurately as possible what it is they are looking at and whether that info tells them to SELL or BUY.
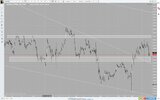
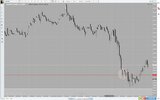
PS: here are the charts; first M30 (note triple top), more compressed than the other to show bigger picture, and 2nd chart is M5 with circle highlighting price action as red line SPPT is being tested. the white rectangles mark S/R zones. note how today market touched top of lower box and stopped and reversed right there. and initially, price also slowed down and stayed stuck at the red line until it broke it, but that's so close to the box S/R zone that it isn't that significant anyway. but from price action, it is clear that somebody else is looking at those exact same levels and closing their shorts right at those levels.
that's a bearish divergence on 1h tf. why do you call it bullish? thanks
")