Sive Morten
Special Consultant to the FPA
- Messages
- 18,690
Fundamentals
In the beginning of our weekly research I hold previous describtion of our trading plan on gold. Currently it is mostly based on counter opinion strategy and as we will see a bit later, looks like it starts to work. During previous weeks downward action has slowed down a bit. This is not probably the end yet of the long-term tendency but still, that could become a first sign of medium-term retracement. Our major plan for the gold is a bit different from common thoughts that now are dominating on the markets. People was so scared by drammatic plunge on gold since the start of the year, that now even scared to say “bullish” in relation to gold market. Here is an example of that thoughts by Reuters news:
"I'm still a bear, maybe on the wrong side of the camp, but with the stock market possibly hitting another record and with any slight uptick in interest rates, we could be looking at gold going very quickly below $1,100," said Frank McGhee, chief precious metal at Integrated Broking Services in Chicago. This market is so unpredictably violent that it could roll off a couple of hundred dollars in just three sessions."
We already have made warning in our previous research – when your grandma is bearish on gold, all mass media calls for selling gold and so on – it’s time to search possibility for long entry. This does not mean that we need to hurry with this, but we have to be careful to any bullish signs that could appear.
Our trading plan on gold assumes appearing of three stages. First stage is under way right now – this is the first impulse leg that gives us direction. Second stage is retracement up after initial plunge, while third stage – continuation down, because bearish momentum on the market is solid. 3rd stage does not necessary will lead to new low, but it probably will at least re-test lows of first leg. Now market gives more and more signs of tiredness – move down has slowed, market extremely oversold. On previous week price has climbed above significant 1300$ level. Time is approaching to seasonal bullish reverse point on gold market at the end of August. There are some other signs that may be not point on bullish reversal obviously, but it is definitely could be said that they are not bearish as well. In line with this week's rebound in gold, outflows from SPDR Gold Trust - the world's largest gold-backed exchange-traded fund - slowed to 3.9 tonnes on this week and on previous one. Two weeks ago contraction was for 22.9 tonnes. Gold holdings in SPDR are down 420 tonnes this year already, giving investors a fundamental reason to flee bullion. I have some suspicions that we are approaching or already stand somewhere around boiling point.
Currently gold market lives with expectations of two major events. First is Fed Reserve message on monetary policy on next week and news that JPMorgan Chase & Co said it was considering a sale or a spin-off of its physical commodities business, including its holdings of commodities assets and its physical trading operations, as regulators increase scrutiny of Wall Street's role in commodities.
By Reuters news Gold was flat on Friday after a late rally erased initial losses and bullion ended the week nearly 3 percent higher as wariness over the U.S. Federal Reserve's message at next week's monetary policy meeting pushed the dollar down. A rally to climb back over a key technical threshold at $1,300 an ounce earlier in the week prompted speculators fearing a reversal of the recent downward price trend to rush to buyback bearish bets. And that probably is the sign that other investors start to suspect that something is changing around. On Friday, sharp losses in industrial metals across the board more than offset the dollar's fall to a five-week low, which was driven by speculation the Federal Open Market Committee (FOMC) will emphasize next week its intention to keep interest rates low for longer. Traders said some profit-taking was seen as buyers cashed in from gold's Friday session high of $1,340, about $160 higher than the three-year low hit June 28.
Speaking about JPM, U.S. bank said it will remain fully committed to its traditional banking activities in the commodity markets, including financial derivatives and the vaulting and trading of precious metals.
CFTC recent report again shows support to growing speculators’ long position by open interest data. We’ve seen this for the first time on previous week. Usually when OI starts to move with net position becomes a first hint on possible trend shifting. This should give us additional confidence in our bullish view on gold in medium-term perspective.
 Thus, now can say the same what we’ve told on previous 2-3 weeks. Although overall long-term bearish sentiment still holds, but in nearest months we could get significant upward bounce on gold market and we have to be ready to use it.
Monthly
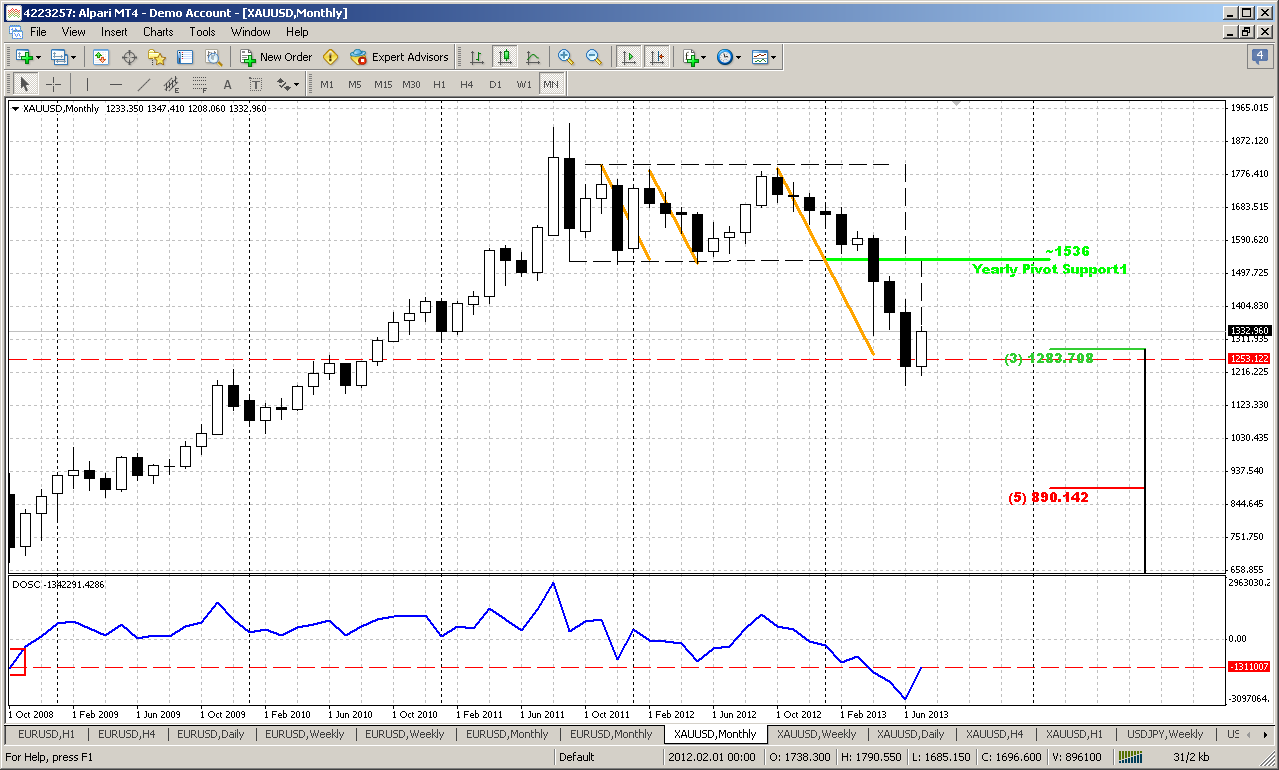
As a result of past week we have slightly bigger July candle than on previous one. But this makes all the difference. Here I also think – could we get some DiNapoli directional – for instance B&B, since we have minimum required number of bars in down thrust – eight. But I’m not sure with it yet and need to see for development of situation a bit more. Other moments of our previous analysis here are the same:
July is still rather small and just inside one for June by far. Thus, our previous analysis is still the same. June candle leads us to further confirmation of Volatility Breakout pattern here by showing even lower close than in May and April. This pattern usually provides solid reliability, since it based not on some price averaging as other indicators but on statistical measure of standard deviation, i.e. on volatility. This is in fact the core of the market’s breath and if we can call it in this way – some statistical law that could lead to significant consequences.
Now we have VOB setup here. Market never was as oversold as it stands now. Take a look at DOSC indicator again – market now stands at all time extreme point that is lower than the previous extreme value in 2008. This gives us very significant conclusion that will be hard to overvalue. Usually when market forms VOB it leads to 2-leg downward move in some shape of AB-CD, but not necessary that AB should be equal to CD. The minimum target of VOB is 0.618 extension of AB-CD, where AB – initial swing down that has given VOB. Other words – now market is forming AB move. On previous week in fundamental part above we’ve discussed possibility of appearing of BC leg, since sentiment is extremely bearish. Then some retracement up should follow and then downward continuation, i.e. extension. And major question now – is current level suitable for starting of upward bounce? Technically it is worthy of our attention and not only because this is significant Fib level. Take a look – this is also target of double harmonic swing and target of rectangle breakout. Usually price tends to pass down the distance that equals the height of broken rectangle. And yes, monthly oversold is also here. It is not necessary that bounce will start tomorrow. It could happen even not in July and after some fluctuations around 1200, but we should be careful and keep an eye on possible reversal patterns on weekly chart.
So two significant conclusions could be made here: whatever bounce market will show here – this probably will be just retracement but not a reversal – the same thought we’ve made based on fundamental picture analysis. The fact that market has passed slightly below Fib support level doesn’t mean yet that this level is broken. This is monthly chart and really big picture. We need to see stable possession below 1200 to accept this idea.
Weekly
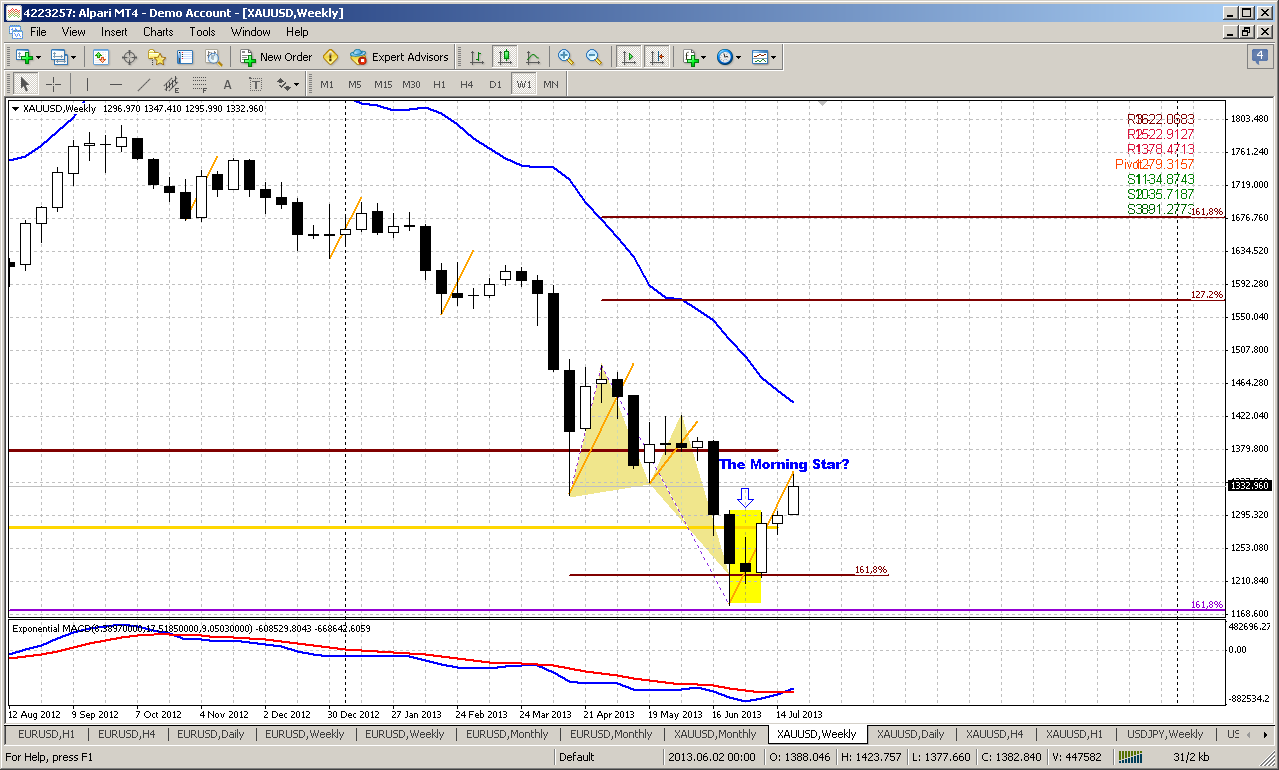
While price action stands in a row with pattern that has been formed two weeks ago, we’re still mostly interested with perspectives. General thoughts are still the same here. As we’ve start to think about potential medium term bounce in fundamental part of our research, it should become visible somehow and discover itself by some reversal pattern or action. On previous week we’ve said – guys, this could be a morning star pattern here and market now behaves in a row with this pattern. Actually weekly chart makes us think about as long-term as short term perspective. It’s more or less clear about short term, since we have clear pattern:
We already know that price stands at monthly Fib support, 1.618 target of initial AB=CD on weekly chart, weekly oversold and Butterfly “Buy”, although butterfly target was exceeded to the downside. But previously we didn’t have the major part of puzzle - the reversal pattern. I do not know whether current one is reliable or not, but this is the only that we have, and it looks like bullish morning star. So, in short term perspective we can stick with it. Until market will not break its low the chances that upward action will continue exist. Take a look that minimum target of this pattern coincides with MPR1.
But what could be in long-term perspective, what pattern can appear here? Usually butterfly (since we already have it) could lead to 3 different reversal patterns. Butterfly itself, reverse H&S and 3-Drive Buy. 3-Drive probably has less chance to appear, because market will need to create new lows to complete it, but this is very difficult at extreme oversold level. Hence, most probable are H&S and/or butterfly per se. For us it is not big difference, because they will have the equal upward targets. Ultimately, market could reach 1600-1650 area, while close target stands around 1570.
If some development will start we need to see breaking of bearish tendency of lower lows and lower highs. It will be nice if we will get higher high for our confidence as soon as possible. Currently we see some nice signs for the bulls – market has closed above MPP and exceeded harmonic swing retracement. But this is just the fist step still.
Currently we have two significant events that have happened already – trend has turned bullish and market moved significantly above MPP. It will be perfect if we will get close above MPR1 that could add a lot of confidence and support the thought that current action is really medium-term deep retracement.
And last but not least – market stands precisely at the point of double harmonic swing retracement. The same distance it has passed, when butterfly pattern formed. If price will exceed it – that will be another points in favor of upward continuation.
Daily
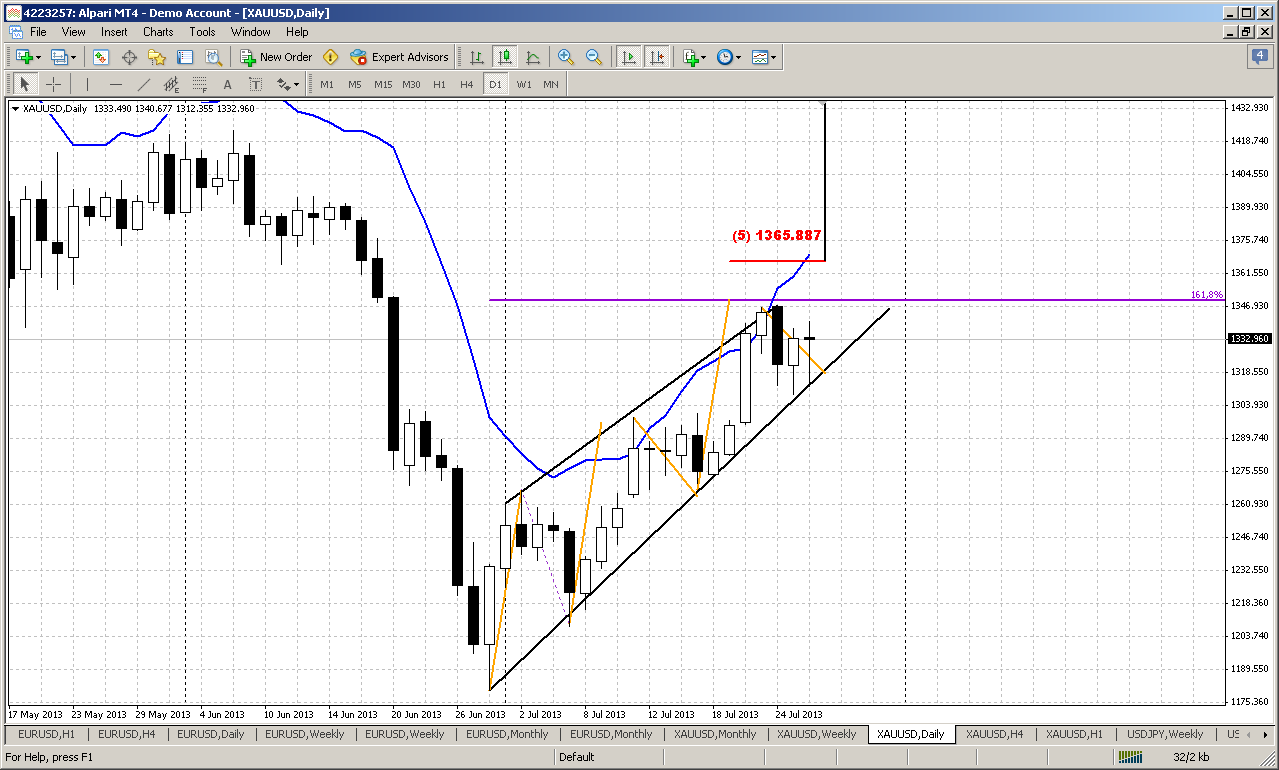
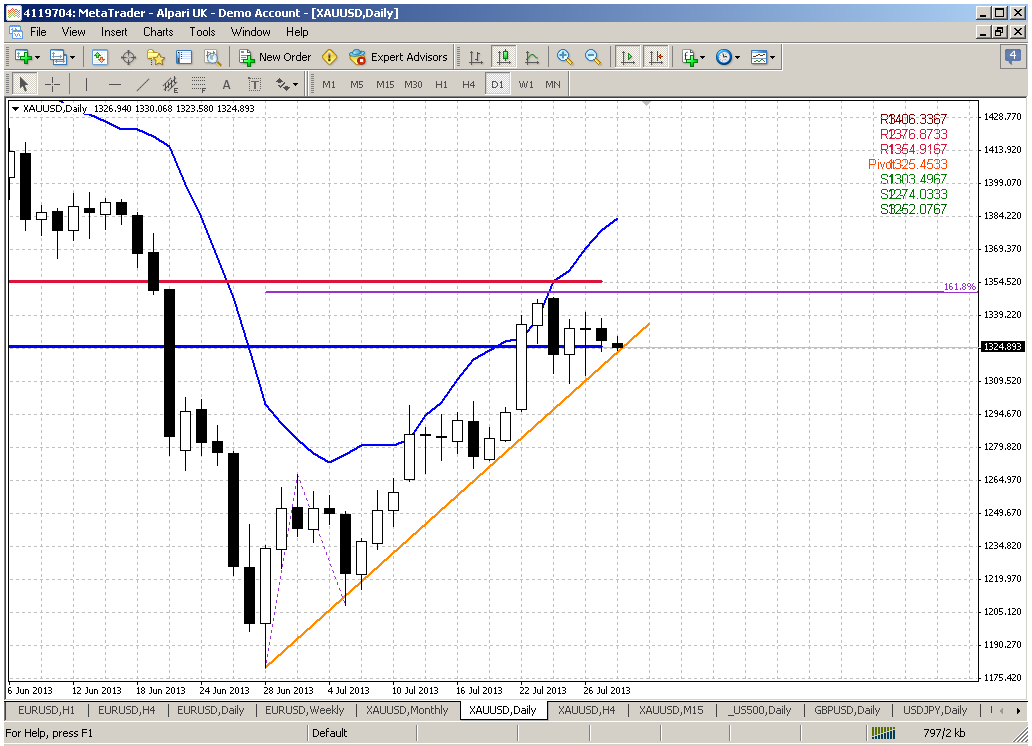
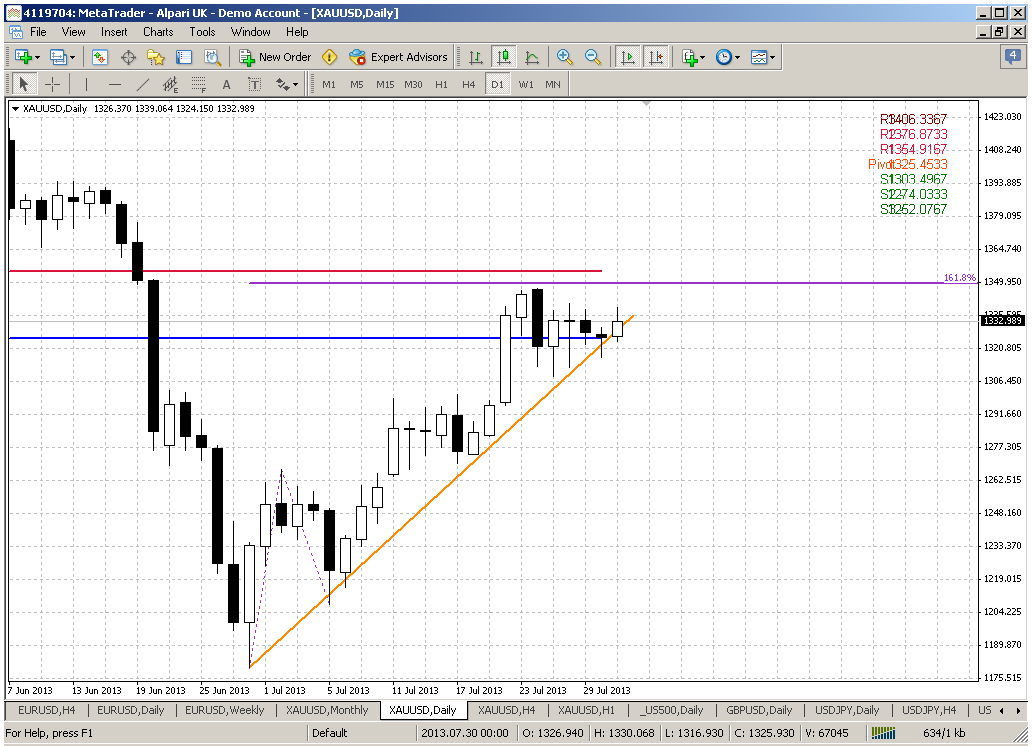
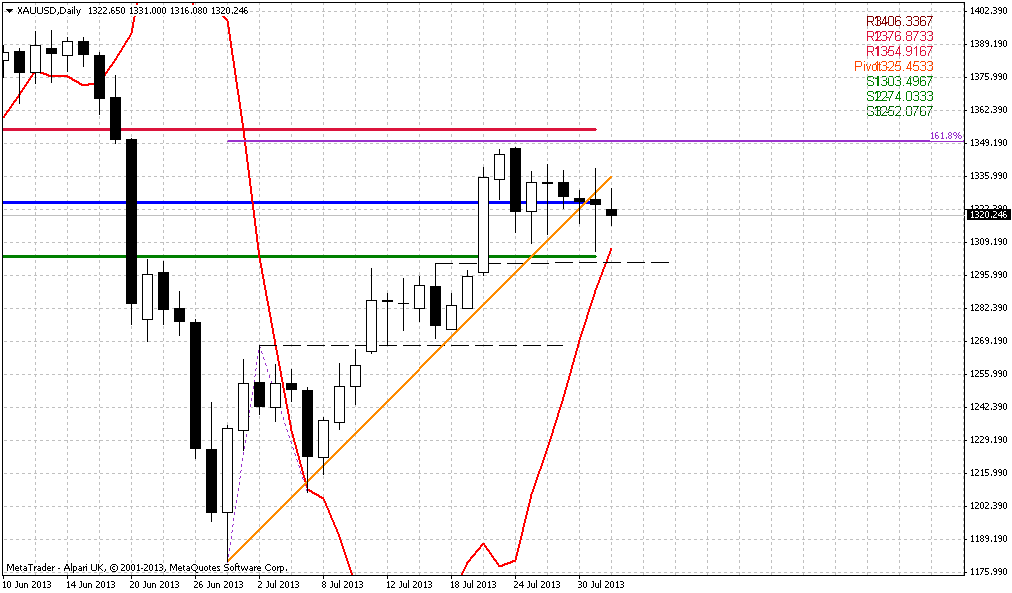
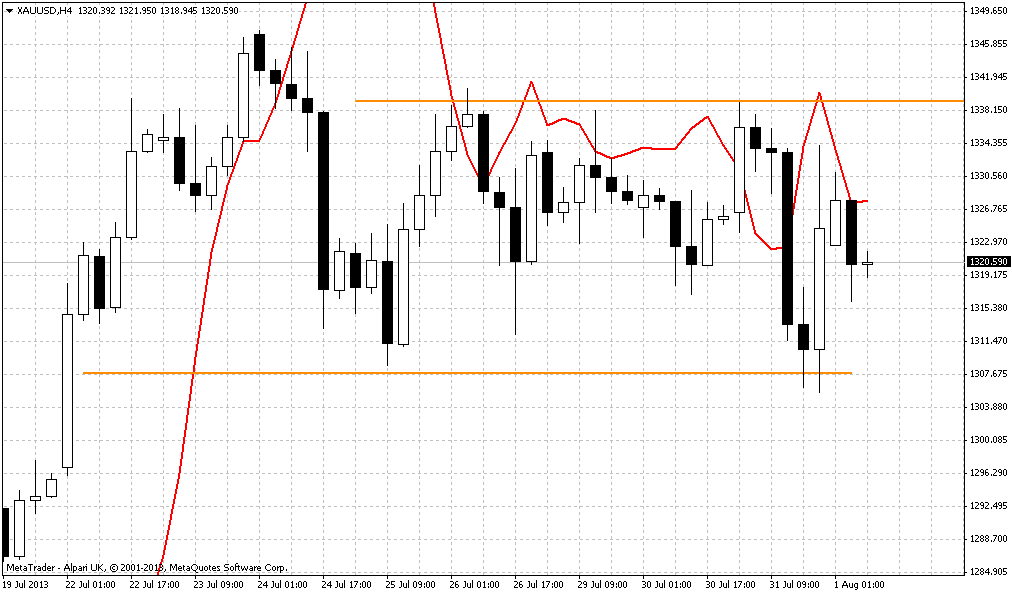
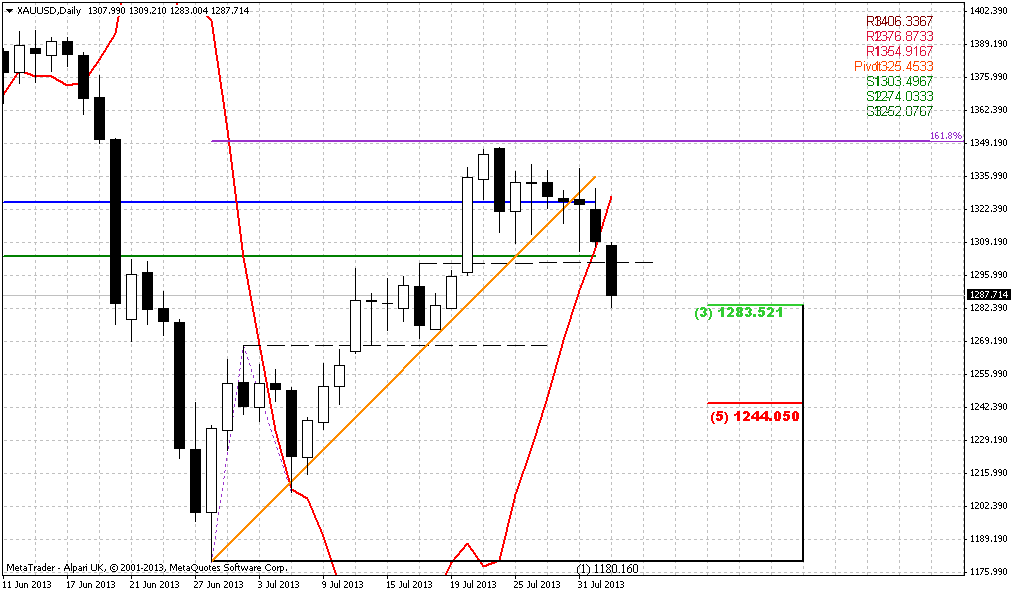
On daily time frame situation is moderately bullish and market stands at some defining point, almost as EUR. By surface view current action looks like rising wedge pattern that at least theoretically as a rule leads to downward continuation. But we do not have some common signs for wedges as exhausting ones by far – no divergence with MACD, market consistently shows 2-step forward 1-step back action. Each retracement just re-tested previous swing high. From bullish development point of view we do not want to see downward breakout of this wedge, at least right now, because market has not formed yet greater upward swing on weekly time frame. Still if this happen it will not necessary mean that all bullish potential is over. It will be just not as perfect as it could be. To continue with bullish scenario it will be much better, if market will show upward acceleration through upper border of this wedge-channel pattern. Theoretically this is possible, especially because market has done already harmonic retracement down.
4-hour
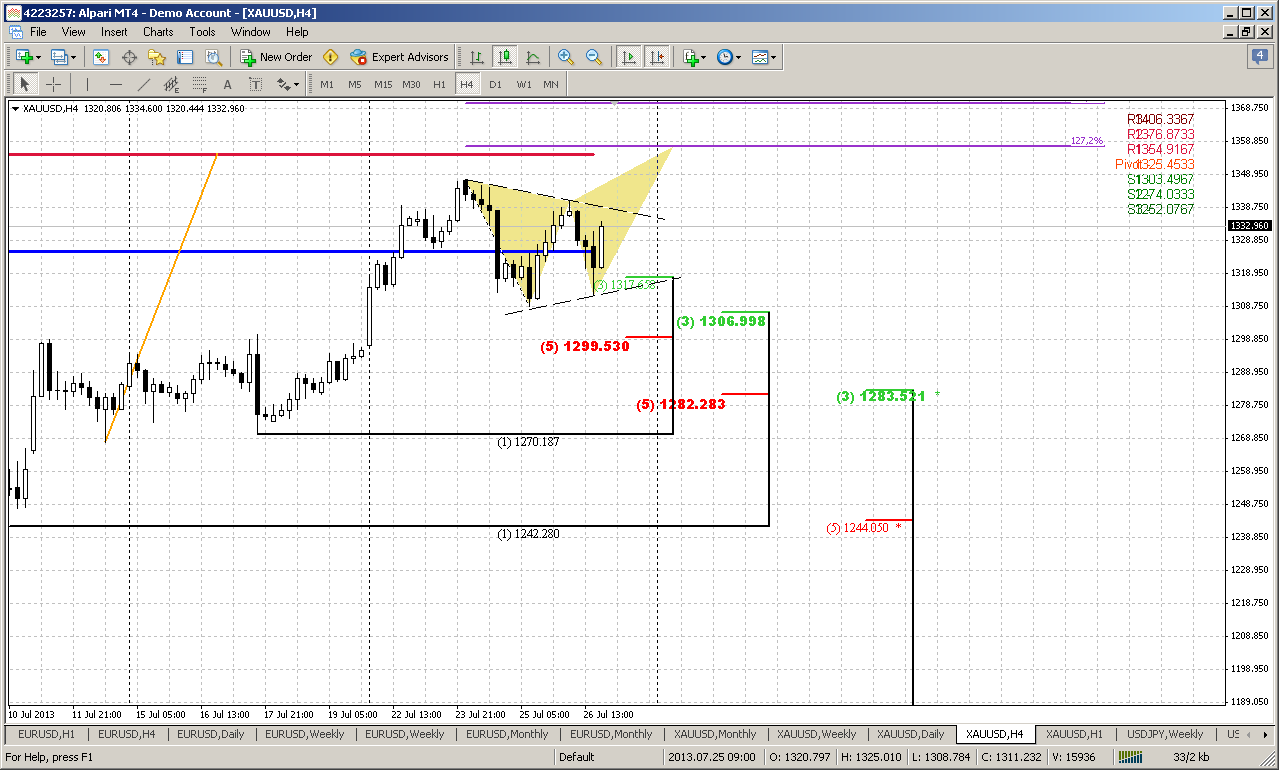
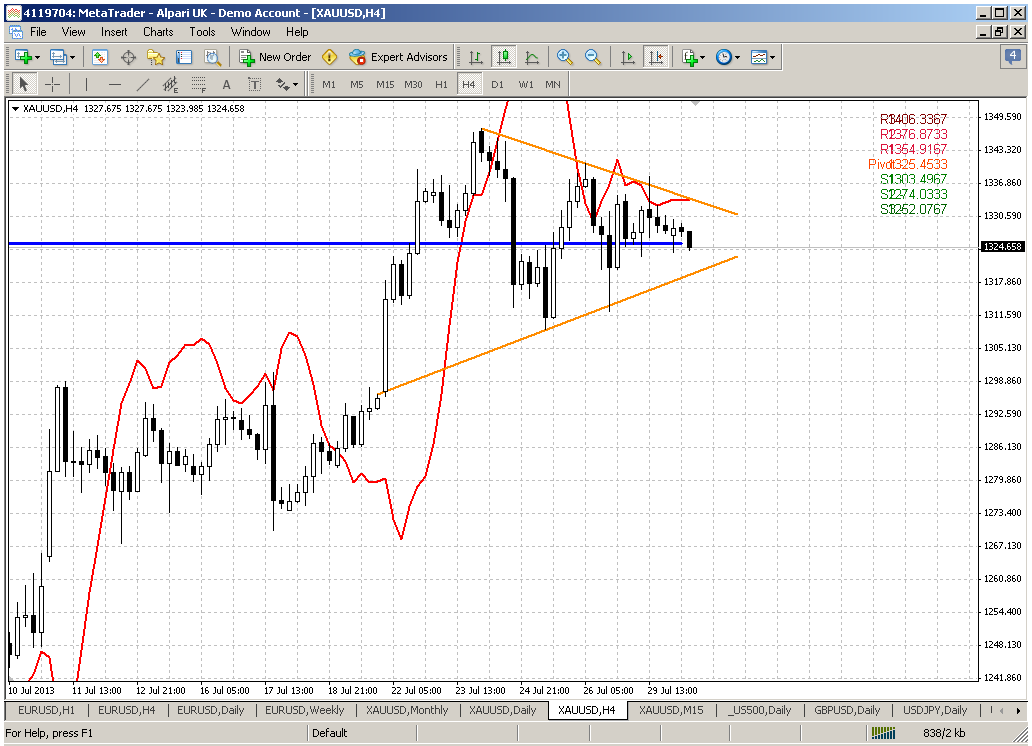
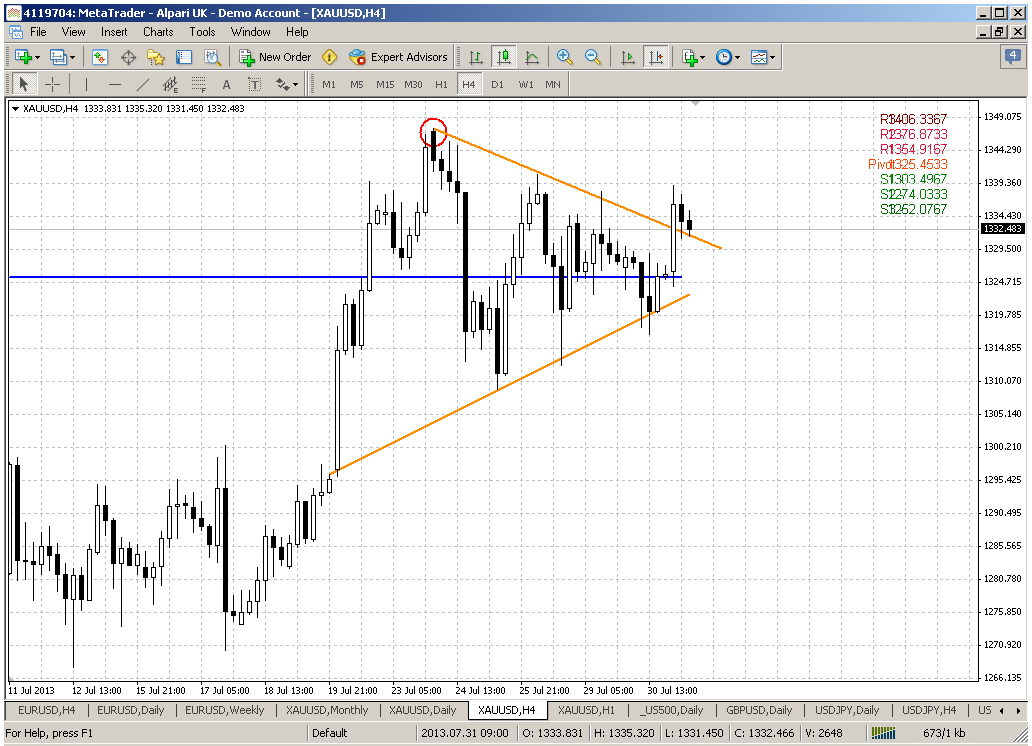
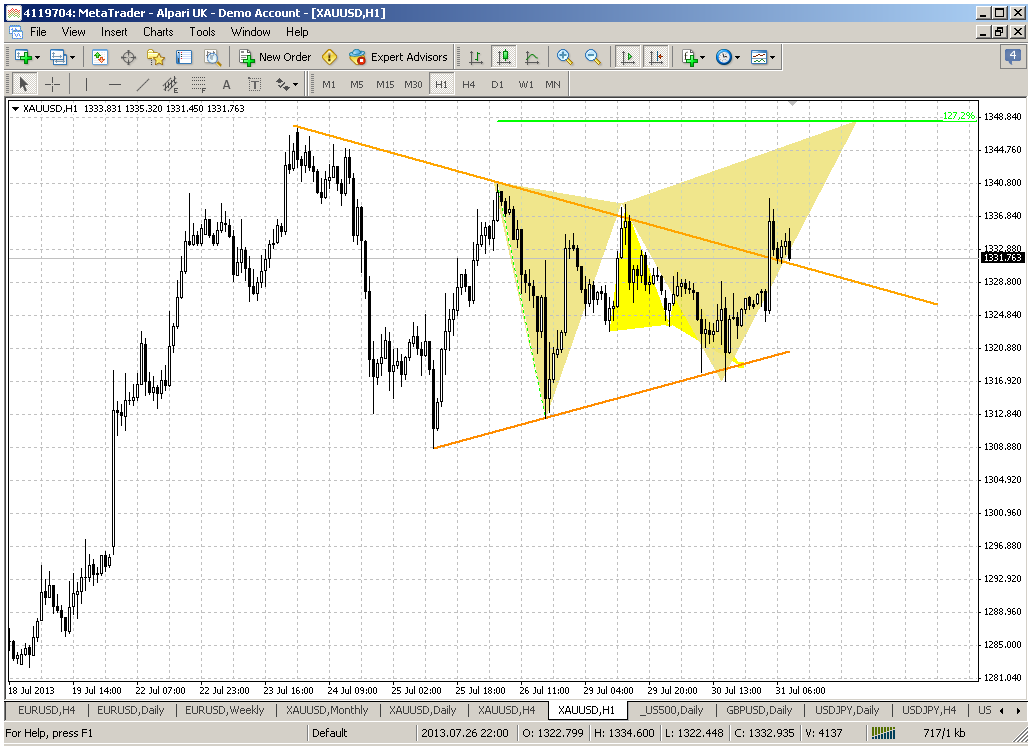
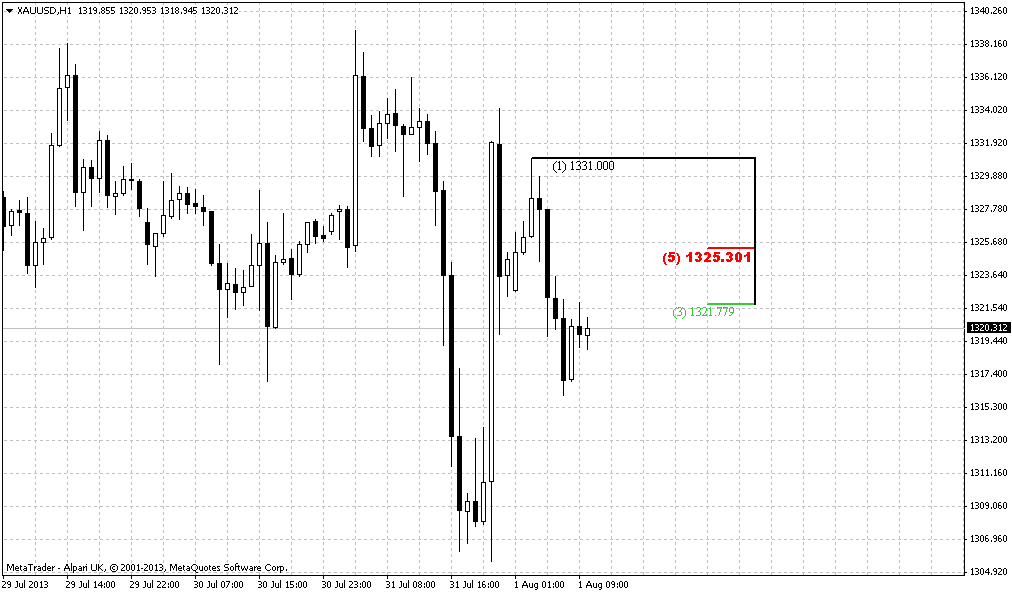
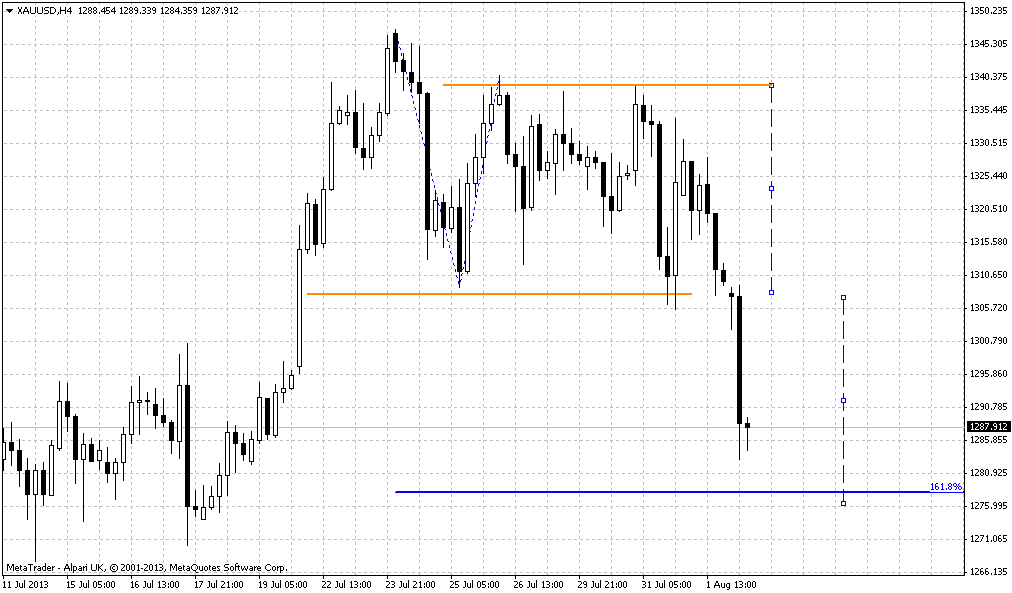
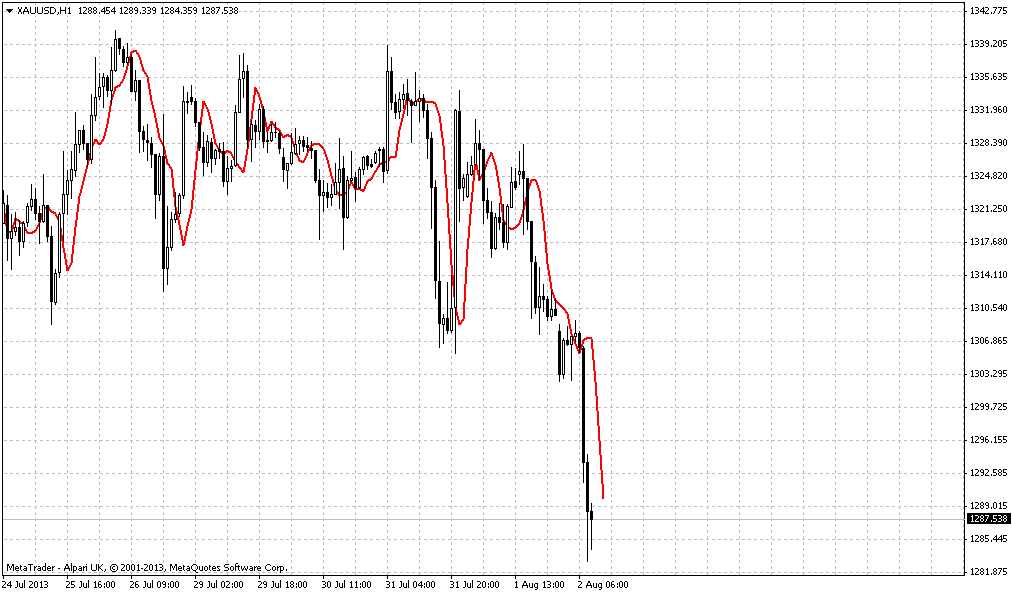
Here market has not quite reached the target of harmonic swing as well as 1.618 target of AB-CD pattern on daily. We’ve discussed this moment previously. Currently market could form as butterfly pattern as triangle. They are very often add each other. Appearing of butterfly is a bit more logical, since 1.27 extension of this pattern coincides with target of harmonic swing, WPR1 and market finally will touch 1.618 daily extension. May be some retracement will follow after that.
Conclusion:
Technically and fundamentally gold market stands in long-term bearish motion, but there are more and more factors start to appear that make downward action as not as cloudless as it was recently. Also we’ve got VOB pattern that gives us forecast for long-term price behavior and promise compounded downward move in shape of some AB-CD. Now major question in big picture – is when and how BC up leg will start.
We do not know just yet – is current move up is just a minor bounce or something bigger. Fundamentally some supportive factors have appeared, and this could shift to greater retracement.
Most recent price action shows more bullish signs than bearish. Although they are not as bright and obvious as sometimes could be – they still significant.
In short-term perspective to support our view, it will be perfect if market will show upward breakout of the channel. Too deep retracement on daily time frame could significantly postpone any bullish scenario or even cancel it for awhile.
The technical portion of Sive's analysis owes a great deal to Joe DiNapoli's methods, and uses a number of Joe's proprietary indicators. Please note that Sive's analysis is his own view of the market and is not endorsed by Joe DiNapoli or any related companies.
In the beginning of our weekly research I hold previous describtion of our trading plan on gold. Currently it is mostly based on counter opinion strategy and as we will see a bit later, looks like it starts to work. During previous weeks downward action has slowed down a bit. This is not probably the end yet of the long-term tendency but still, that could become a first sign of medium-term retracement. Our major plan for the gold is a bit different from common thoughts that now are dominating on the markets. People was so scared by drammatic plunge on gold since the start of the year, that now even scared to say “bullish” in relation to gold market. Here is an example of that thoughts by Reuters news:
"I'm still a bear, maybe on the wrong side of the camp, but with the stock market possibly hitting another record and with any slight uptick in interest rates, we could be looking at gold going very quickly below $1,100," said Frank McGhee, chief precious metal at Integrated Broking Services in Chicago. This market is so unpredictably violent that it could roll off a couple of hundred dollars in just three sessions."
We already have made warning in our previous research – when your grandma is bearish on gold, all mass media calls for selling gold and so on – it’s time to search possibility for long entry. This does not mean that we need to hurry with this, but we have to be careful to any bullish signs that could appear.
Our trading plan on gold assumes appearing of three stages. First stage is under way right now – this is the first impulse leg that gives us direction. Second stage is retracement up after initial plunge, while third stage – continuation down, because bearish momentum on the market is solid. 3rd stage does not necessary will lead to new low, but it probably will at least re-test lows of first leg. Now market gives more and more signs of tiredness – move down has slowed, market extremely oversold. On previous week price has climbed above significant 1300$ level. Time is approaching to seasonal bullish reverse point on gold market at the end of August. There are some other signs that may be not point on bullish reversal obviously, but it is definitely could be said that they are not bearish as well. In line with this week's rebound in gold, outflows from SPDR Gold Trust - the world's largest gold-backed exchange-traded fund - slowed to 3.9 tonnes on this week and on previous one. Two weeks ago contraction was for 22.9 tonnes. Gold holdings in SPDR are down 420 tonnes this year already, giving investors a fundamental reason to flee bullion. I have some suspicions that we are approaching or already stand somewhere around boiling point.
Currently gold market lives with expectations of two major events. First is Fed Reserve message on monetary policy on next week and news that JPMorgan Chase & Co said it was considering a sale or a spin-off of its physical commodities business, including its holdings of commodities assets and its physical trading operations, as regulators increase scrutiny of Wall Street's role in commodities.
By Reuters news Gold was flat on Friday after a late rally erased initial losses and bullion ended the week nearly 3 percent higher as wariness over the U.S. Federal Reserve's message at next week's monetary policy meeting pushed the dollar down. A rally to climb back over a key technical threshold at $1,300 an ounce earlier in the week prompted speculators fearing a reversal of the recent downward price trend to rush to buyback bearish bets. And that probably is the sign that other investors start to suspect that something is changing around. On Friday, sharp losses in industrial metals across the board more than offset the dollar's fall to a five-week low, which was driven by speculation the Federal Open Market Committee (FOMC) will emphasize next week its intention to keep interest rates low for longer. Traders said some profit-taking was seen as buyers cashed in from gold's Friday session high of $1,340, about $160 higher than the three-year low hit June 28.
Speaking about JPM, U.S. bank said it will remain fully committed to its traditional banking activities in the commodity markets, including financial derivatives and the vaulting and trading of precious metals.
CFTC recent report again shows support to growing speculators’ long position by open interest data. We’ve seen this for the first time on previous week. Usually when OI starts to move with net position becomes a first hint on possible trend shifting. This should give us additional confidence in our bullish view on gold in medium-term perspective.
Monthly
As a result of past week we have slightly bigger July candle than on previous one. But this makes all the difference. Here I also think – could we get some DiNapoli directional – for instance B&B, since we have minimum required number of bars in down thrust – eight. But I’m not sure with it yet and need to see for development of situation a bit more. Other moments of our previous analysis here are the same:
July is still rather small and just inside one for June by far. Thus, our previous analysis is still the same. June candle leads us to further confirmation of Volatility Breakout pattern here by showing even lower close than in May and April. This pattern usually provides solid reliability, since it based not on some price averaging as other indicators but on statistical measure of standard deviation, i.e. on volatility. This is in fact the core of the market’s breath and if we can call it in this way – some statistical law that could lead to significant consequences.
Now we have VOB setup here. Market never was as oversold as it stands now. Take a look at DOSC indicator again – market now stands at all time extreme point that is lower than the previous extreme value in 2008. This gives us very significant conclusion that will be hard to overvalue. Usually when market forms VOB it leads to 2-leg downward move in some shape of AB-CD, but not necessary that AB should be equal to CD. The minimum target of VOB is 0.618 extension of AB-CD, where AB – initial swing down that has given VOB. Other words – now market is forming AB move. On previous week in fundamental part above we’ve discussed possibility of appearing of BC leg, since sentiment is extremely bearish. Then some retracement up should follow and then downward continuation, i.e. extension. And major question now – is current level suitable for starting of upward bounce? Technically it is worthy of our attention and not only because this is significant Fib level. Take a look – this is also target of double harmonic swing and target of rectangle breakout. Usually price tends to pass down the distance that equals the height of broken rectangle. And yes, monthly oversold is also here. It is not necessary that bounce will start tomorrow. It could happen even not in July and after some fluctuations around 1200, but we should be careful and keep an eye on possible reversal patterns on weekly chart.
So two significant conclusions could be made here: whatever bounce market will show here – this probably will be just retracement but not a reversal – the same thought we’ve made based on fundamental picture analysis. The fact that market has passed slightly below Fib support level doesn’t mean yet that this level is broken. This is monthly chart and really big picture. We need to see stable possession below 1200 to accept this idea.
Weekly
While price action stands in a row with pattern that has been formed two weeks ago, we’re still mostly interested with perspectives. General thoughts are still the same here. As we’ve start to think about potential medium term bounce in fundamental part of our research, it should become visible somehow and discover itself by some reversal pattern or action. On previous week we’ve said – guys, this could be a morning star pattern here and market now behaves in a row with this pattern. Actually weekly chart makes us think about as long-term as short term perspective. It’s more or less clear about short term, since we have clear pattern:
We already know that price stands at monthly Fib support, 1.618 target of initial AB=CD on weekly chart, weekly oversold and Butterfly “Buy”, although butterfly target was exceeded to the downside. But previously we didn’t have the major part of puzzle - the reversal pattern. I do not know whether current one is reliable or not, but this is the only that we have, and it looks like bullish morning star. So, in short term perspective we can stick with it. Until market will not break its low the chances that upward action will continue exist. Take a look that minimum target of this pattern coincides with MPR1.
But what could be in long-term perspective, what pattern can appear here? Usually butterfly (since we already have it) could lead to 3 different reversal patterns. Butterfly itself, reverse H&S and 3-Drive Buy. 3-Drive probably has less chance to appear, because market will need to create new lows to complete it, but this is very difficult at extreme oversold level. Hence, most probable are H&S and/or butterfly per se. For us it is not big difference, because they will have the equal upward targets. Ultimately, market could reach 1600-1650 area, while close target stands around 1570.
If some development will start we need to see breaking of bearish tendency of lower lows and lower highs. It will be nice if we will get higher high for our confidence as soon as possible. Currently we see some nice signs for the bulls – market has closed above MPP and exceeded harmonic swing retracement. But this is just the fist step still.
Currently we have two significant events that have happened already – trend has turned bullish and market moved significantly above MPP. It will be perfect if we will get close above MPR1 that could add a lot of confidence and support the thought that current action is really medium-term deep retracement.
And last but not least – market stands precisely at the point of double harmonic swing retracement. The same distance it has passed, when butterfly pattern formed. If price will exceed it – that will be another points in favor of upward continuation.
Daily
On daily time frame situation is moderately bullish and market stands at some defining point, almost as EUR. By surface view current action looks like rising wedge pattern that at least theoretically as a rule leads to downward continuation. But we do not have some common signs for wedges as exhausting ones by far – no divergence with MACD, market consistently shows 2-step forward 1-step back action. Each retracement just re-tested previous swing high. From bullish development point of view we do not want to see downward breakout of this wedge, at least right now, because market has not formed yet greater upward swing on weekly time frame. Still if this happen it will not necessary mean that all bullish potential is over. It will be just not as perfect as it could be. To continue with bullish scenario it will be much better, if market will show upward acceleration through upper border of this wedge-channel pattern. Theoretically this is possible, especially because market has done already harmonic retracement down.
4-hour
Here market has not quite reached the target of harmonic swing as well as 1.618 target of AB-CD pattern on daily. We’ve discussed this moment previously. Currently market could form as butterfly pattern as triangle. They are very often add each other. Appearing of butterfly is a bit more logical, since 1.27 extension of this pattern coincides with target of harmonic swing, WPR1 and market finally will touch 1.618 daily extension. May be some retracement will follow after that.
Conclusion:
Technically and fundamentally gold market stands in long-term bearish motion, but there are more and more factors start to appear that make downward action as not as cloudless as it was recently. Also we’ve got VOB pattern that gives us forecast for long-term price behavior and promise compounded downward move in shape of some AB-CD. Now major question in big picture – is when and how BC up leg will start.
We do not know just yet – is current move up is just a minor bounce or something bigger. Fundamentally some supportive factors have appeared, and this could shift to greater retracement.
Most recent price action shows more bullish signs than bearish. Although they are not as bright and obvious as sometimes could be – they still significant.
In short-term perspective to support our view, it will be perfect if market will show upward breakout of the channel. Too deep retracement on daily time frame could significantly postpone any bullish scenario or even cancel it for awhile.
The technical portion of Sive's analysis owes a great deal to Joe DiNapoli's methods, and uses a number of Joe's proprietary indicators. Please note that Sive's analysis is his own view of the market and is not endorsed by Joe DiNapoli or any related companies.
 i don't understand gold!