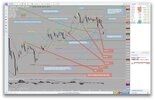
GOLD PRO Weekly July 29 - August 02, 2013

Dear Sive,

Price had shot down to 1291, I have open a long position here. Is it possible to deep retracement up to follow now or would there still be high chance of bearish continuation ? Cheers

Hi Fang,
well, I'm not a prophet, but if treat current move down from rectangle breakout point of view. Retracement is possible somewhere from 1275-1280 area, but I can't say whether it will reach 1291...
 
here is a technical post-mortem. screenshot attached. note how the 4HR candle is in the process of producing a longer wick right at the 200 SMA and 78.6% fib SPPT.
 

Attachments

  • XAUUSD_H4_comments.jpg
    XAUUSD_H4_comments.jpg
    175.3 KB · Views: 6
sive, i don't see any price gap in your data feed on H4. as i just posted, you can see a significant gap over the K-area. does anyone have that gap as well, or is it just the FXCM data feed (through tradingview.com) that is not clean?
 
never mind. it's this goddam company's data that is not clean. i checked with my other feed and it's the same as yours. no gap!!
 
BAT BUY on M30

screenshot attached. also attached M5 with red line indicating first top level RSTT.

i would not buy yet. wait until the price falls further. watch the shape of MACD on M5. when you get the lower low in price but MACD is not going lower than the previous hump, you have divergence. then check the level where price seems to be getting support and watch the size of the wicks. any stop grabbing wick spikes, buy into that and target first TP at the red line on M5 which also happens to be the 38.2% fib retrace of the drop from point A to D in the bat structure you can see in the screenshot of M30.

also note that D or end point of bat was exactly right at the 38.2% of daily fib structure, 840.0. would watch for a bounce here... but if not, then ...

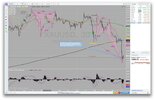
if markets drops further from here, a good buy point would be pivot S2 = 734.1 and SPPT of rectangle low at 701.4, and what happens around 750.0 needs to be considered as well.

a further drop will target the 615.7 level, which is the 61.8% fib of the move up from 1,208.14.

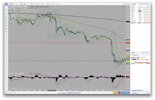
right now, market remains flat, mini rectangle on M5/M15 and is very much still walking the band on M30/H1. this is dangerous. i think it will drop further, give us some stop grabbers, then reverse up.

now, from a longer term approach, personally i would sell into the rallies. this buying business i'd say is only good for very short term scalping. just be clear. don't want to any misunderstanding that i mean the market is gonna go bullish from here on. i have no idea.
 

Attachments

  • XAUUSD_M30_bat_BUY.jpg
    XAUUSD_M30_bat_BUY.jpg
    152.5 KB · Views: 3
  • XAUUSD_M5.jpg
    XAUUSD_M5.jpg
    143.6 KB · Views: 5
Last edited:
Could it be the bearish hidden divergence playing out on D1 I was concerned about a week back or just a retest of my W1 resistance,either way I don't like shorting gold especially around these levels I'll look for buy signal around my next W1 support for the initial bounce and possibly the retracement to come:)
gold 3.jpg
 
mmmhhh.... london 10.45, frankfurt 11.45.... that was it? :mad:
got to wait another 90 mins +/-, for NY to come online.
 
Back
Top