Sive Morten
Special Consultant to the FPA
- Messages
- 18,690
Fundamentals
Gold slid for a second consecutive day as the yen plummeted to its lowest against the U.S. dollar in more than four years on Friday, a day after the U.S. currency rose above the 100-yen level. The dollar rally also weighed on industrial commodities led by crude
Gold's sharp losses last month has intensified a disconnect between funds that sold on dissatisfaction over bullion's underperformance and individual investors who could not get enough physical gold coins and bars at bargain prices.
Fundamentally the explanation of plunge on passed week is the same – low attractiveness of gold, compares to other assets with current anemic inflation. New splash in dollar strength has led to downward continuation on gold market. Even demand on physical gold among population of India and China can’t stop price decreasing. As we’ve said on previous week - although we see a lot of signs greater liquidity inflow in world economy, such as Fed promise to continue $85B monthly bond purchases, reducing ECB rate and intention of Bank of Japan to inject about $1.4 trillion into its economy to spur growth. Still, as there is no such thing as a hyperinflation scenario for at least the Western countries, that's why many investors think that gold will suffer in the medium term and put attention on more risky assets, such as US equities.
Although currently SPDR Fund reports inflow, but it looks anemic compares to huge withdrawal that has happened since the start of the year. Analysts tell about significant gold-buying Indian festival on May 13, that could tight difference between huge supply from institutional investors and demand from public, but hardly it will make drastical impact on overall weak sentiment.
Technically some downward acceleration was triggered by stop reaching below 1440 support area.
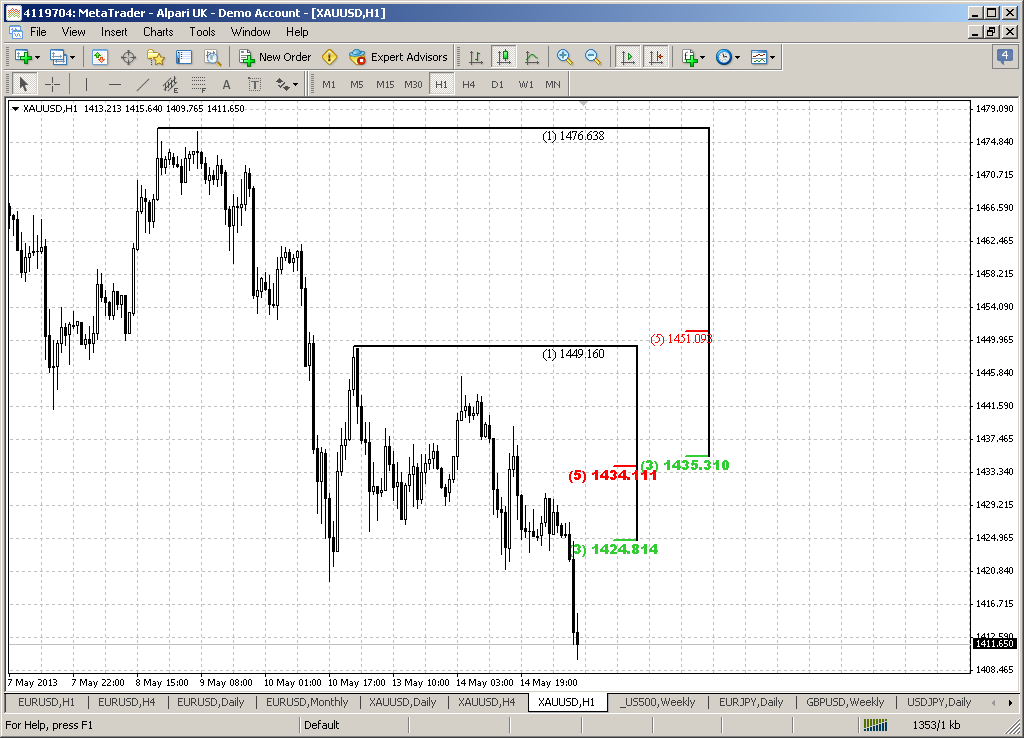
Analysis of open interest and gold price shows that open interest has increased as short position becomes larger:
These events confirms our assumption that current move up was just a retracement when investors just want to take breath after huge sell-off in the middle of April.
Sponsored by Pellucid FX - Premium STP Forex Broker >>
Monthly
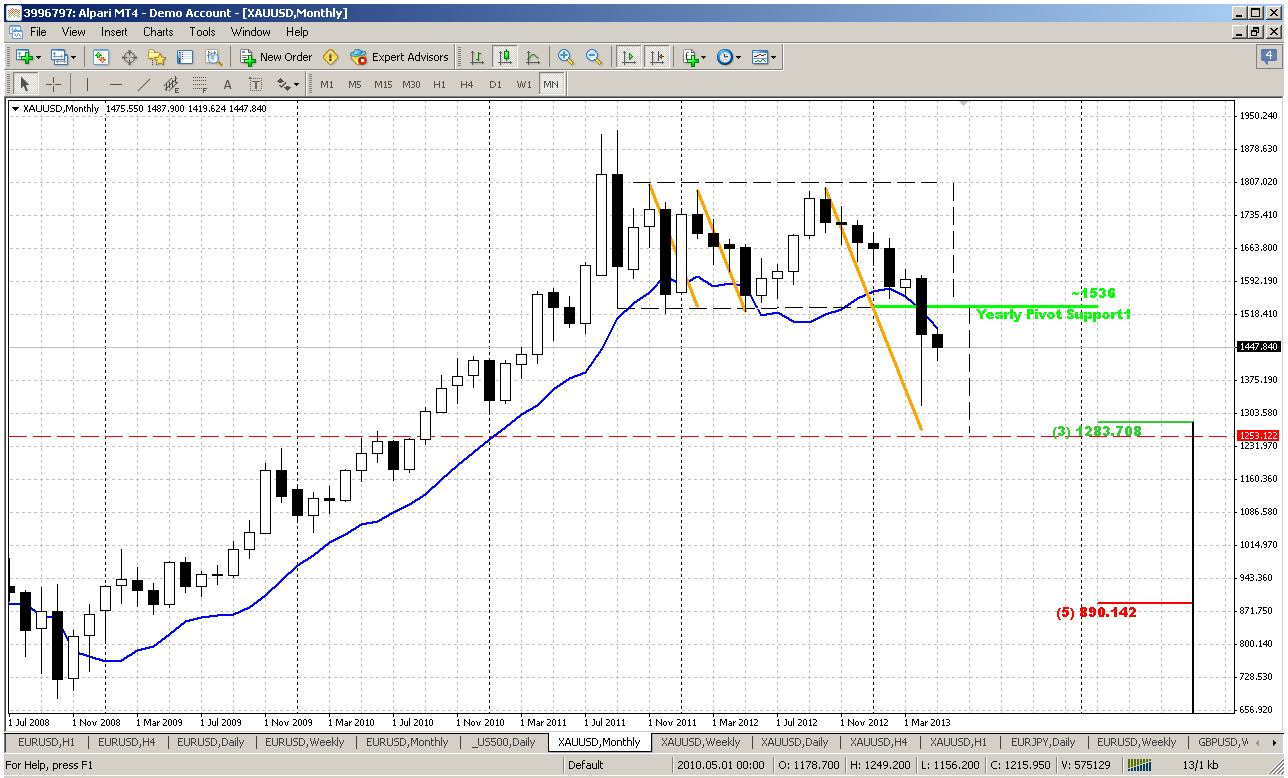
On monthly time frame we do not see a lot of action, since price is pressed by oversold condition and May is rather small-ranged candle compares to April. Probably we can call is a breath taking period by investors. When the bearish doom & gloom has finished by mass profit taking and fast move down come to pass – now investors are trying to re-assess what to do next and trying to enter in the same water again.
Fundamentally overall picture remains moderately bearish as technically. Market has significant bearish impulse that probably should lead to some continuation in the future. The nearest destination point is a harmonic swing target at major 3/8 Fib support.
But from technical point of view it is difficult to find reasons now to take long-term bearish position, since it will constantly be under the risk of significant pullback due oversold condition. Thus we continue to stand with our plan of more extended upward retracement on daily time frame.
Sponsored by Pellucid FX - Premium STP Forex Broker >>
Weekly
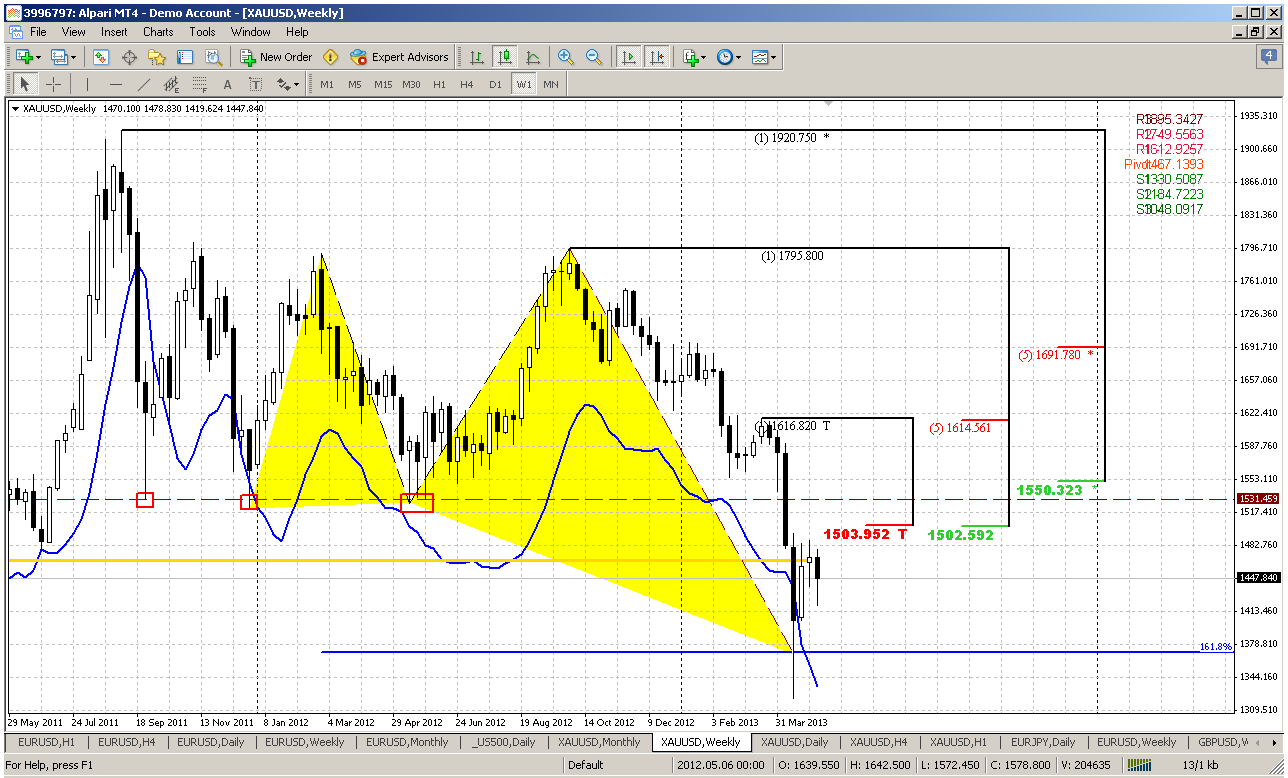
Although on EUR weekly chart we’ve got major information for analysis, I can’t tell the same about gold market. Two recent weeks is very difficult to comment, since they are rather small in terms of range, especially previous one. Now we see that market has failed not only to move above MPP, but also to test Weekly K-resistance area and hints on potential move down.
Currently our analysis of weekly time frame is based on expectation of counter reaction to deep oversold situation on monthly chart and former oversold here on weekly. Since initial reaction that has put market under deep oversold was really strong, some kind of counter reaction of comparable strength should follow. And this counter reaction should lead market to a bit higher levels, than it stands now. This counter move up has started from support and oversold on weekly time frame and has formed first upward leg. In general this total setup has definite name by DiNapoli framework, and assumes taking short-term long position at the retracement from first bounce up. The minimum objective target is minor 0.618 extension of resulting AB-CD pattern. And now it looks like this retracement has started. Hence our task is to estimate potential end point of this retracement and pattern that will let us to enter long.
At least now I see no other setups or patterns here that we could trade except to stick with DiNapoli directional pattern and count on the moment that gold likes to make deep retracements up.
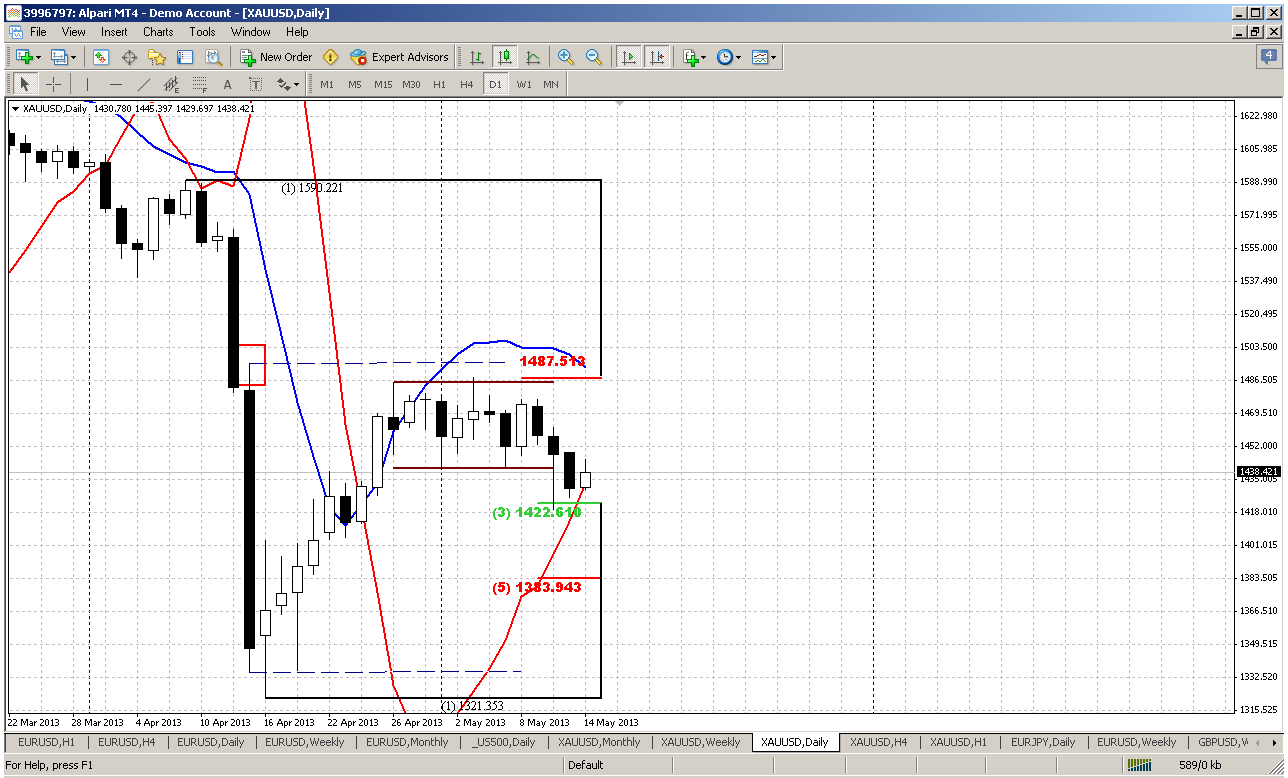
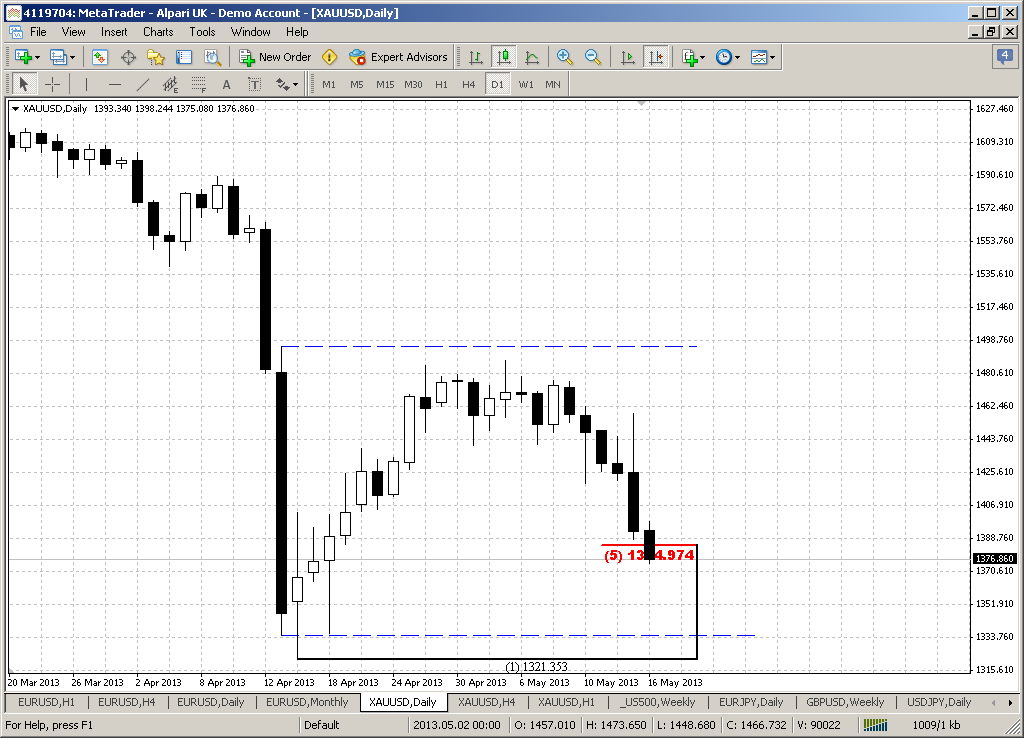
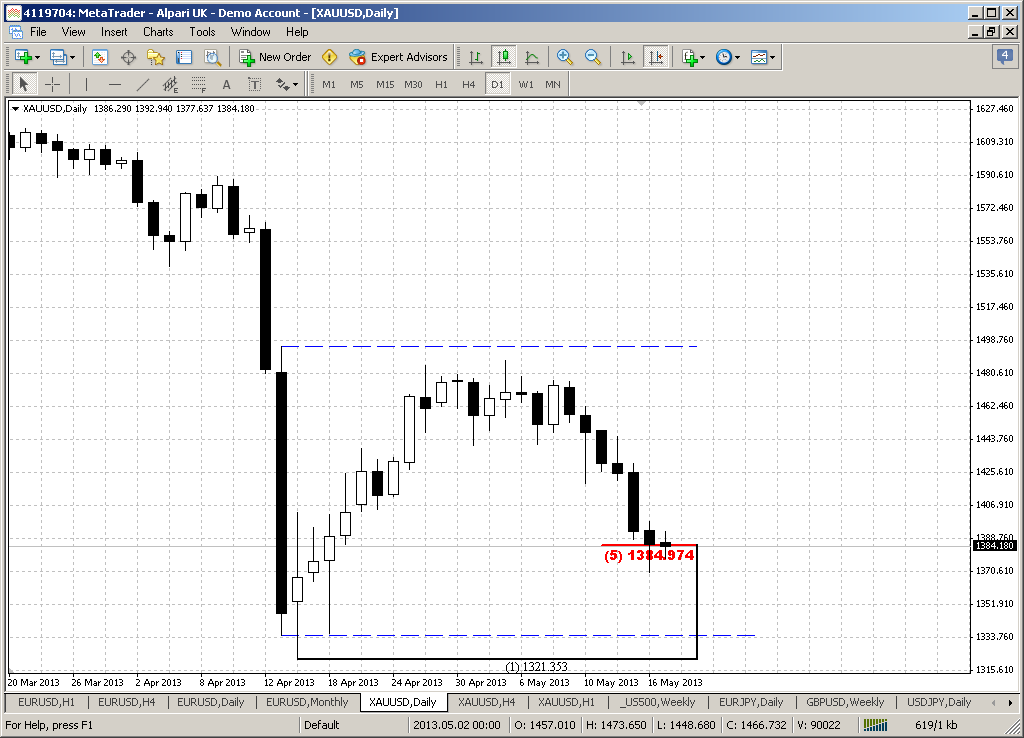
Daily
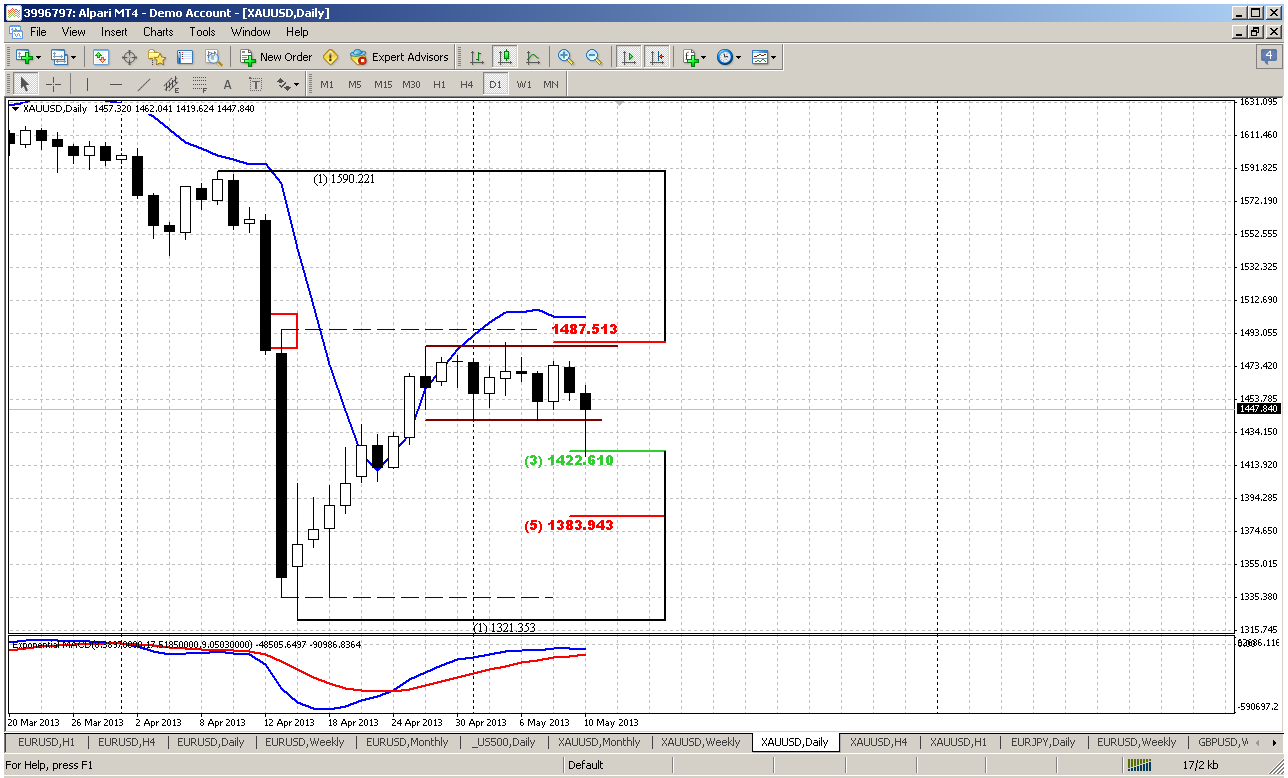
It is very difficult to give comments guys on daily gold chart. Just look at the picture – what do you see here? Can you give any definite commentary that will clarify further direction or at least to tell something new? Hardly since price stands flat for 2 weeks… that’s why gold market is not very attractive for trading on daily time frame. What nuances I see here… Trend still holds bullish here and all price action for whole month is held by long black candle. In fact it carries all past action inside. This is very often happens after big moves. Particularly by this reason the high and low of this candle becomes very significant levels and breakout direction could determine the trend for medium-term perspective.
What else can we see? Right near the high of this candle we have strong resistance area – daily overbought, 5/8 minor Fib resistance and weekly K-resistance slightly higher. This level limits potential upward move and tells that market will not able to move significantly above it. Hence this is the ultimate level for upward action in nearest perspective.
And last one moment that seems to be very significant for coming week – we have consolidation downward breakout failure, at least this could be fake breakout, if market will not move again below its lower border. If this is really true, then we have to be ready for moving to upper border of consolidation or even for upward breakout. Who knows this could be W&R again as it was with downward breakout, but as we’ve said above – market will not be able to pass 1500 area freely.
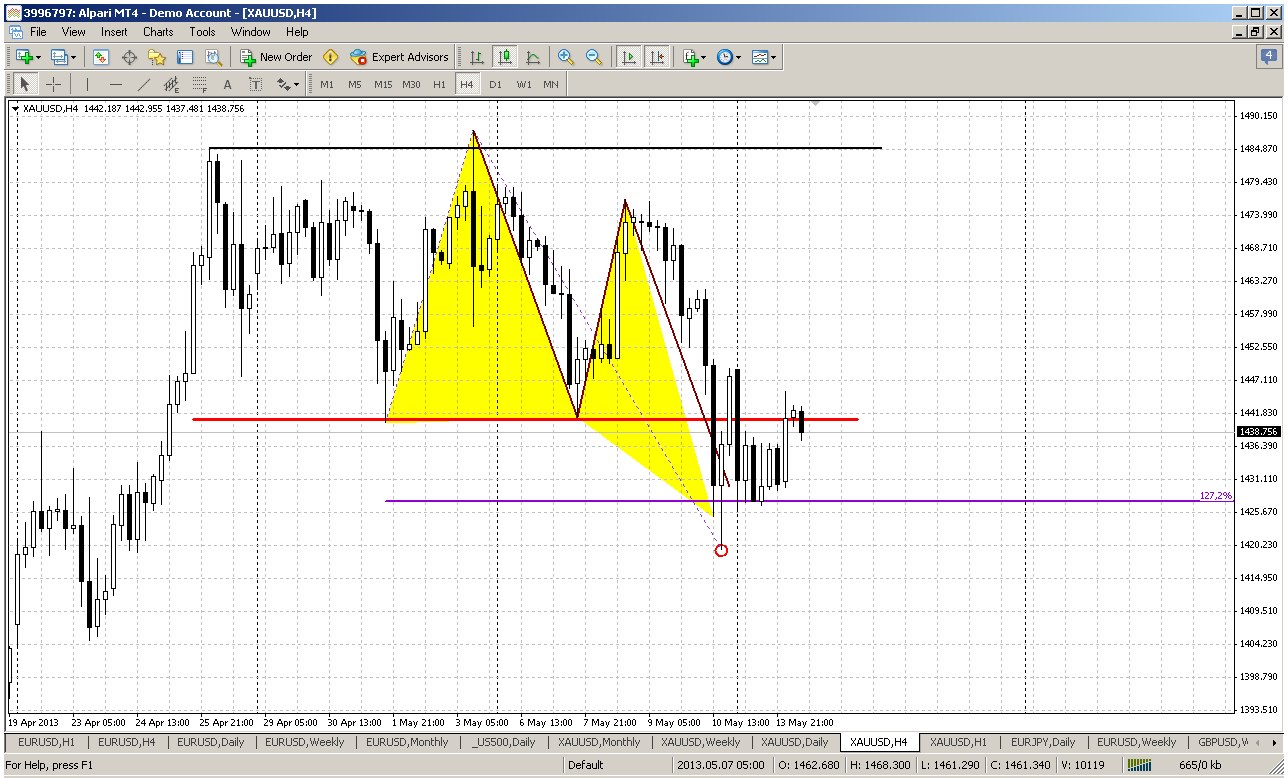
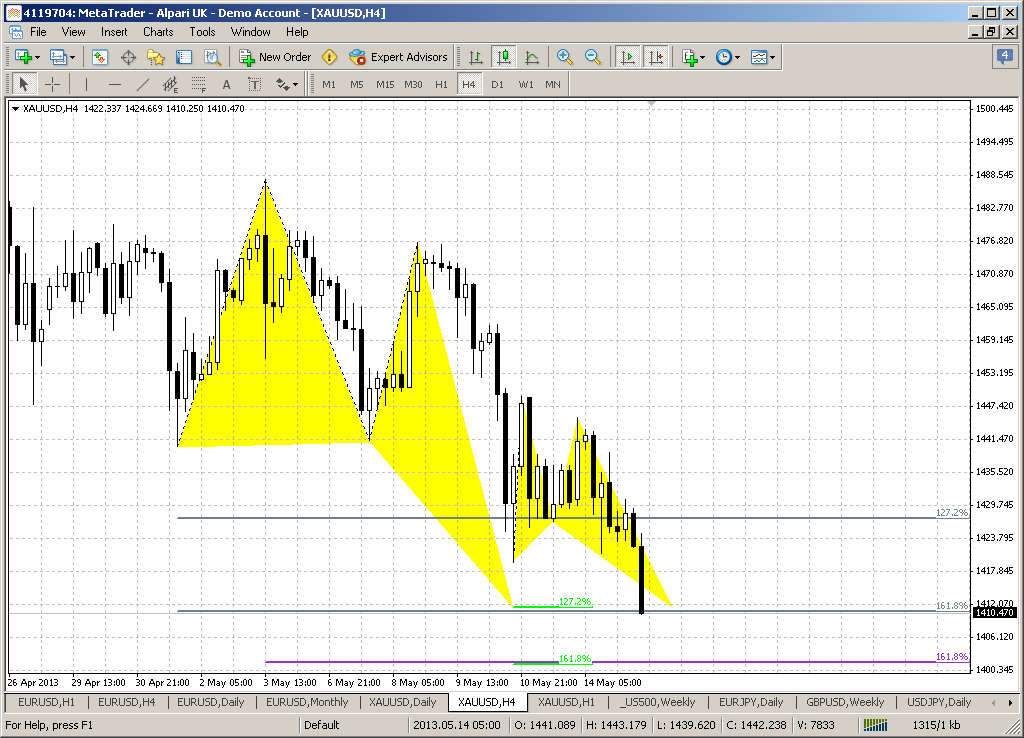
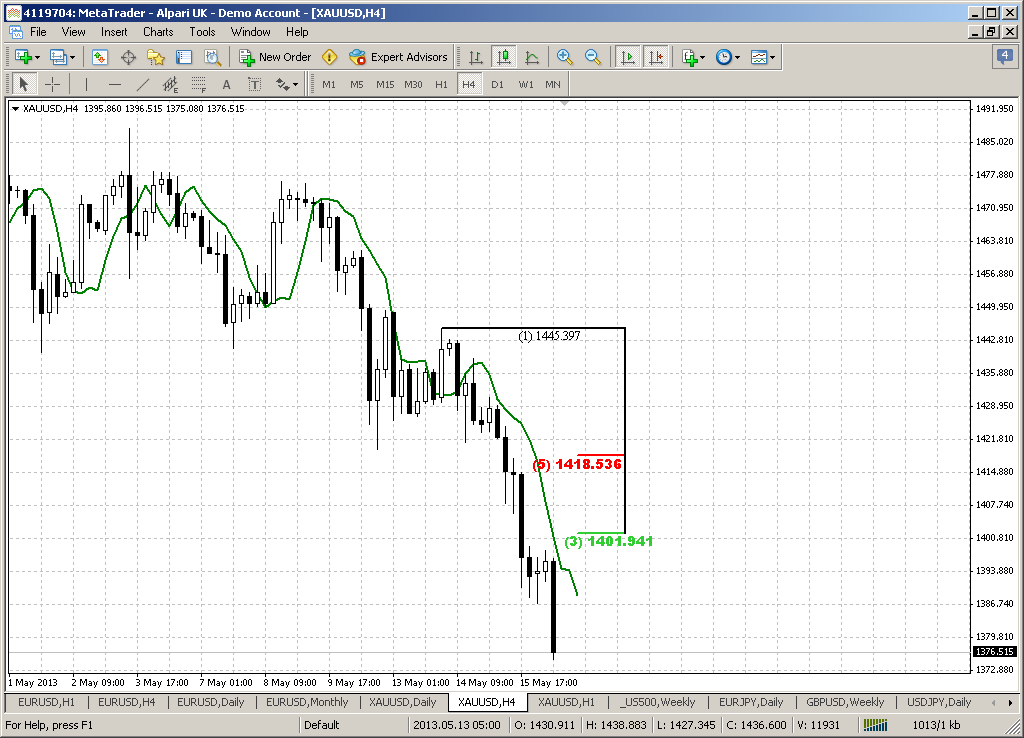
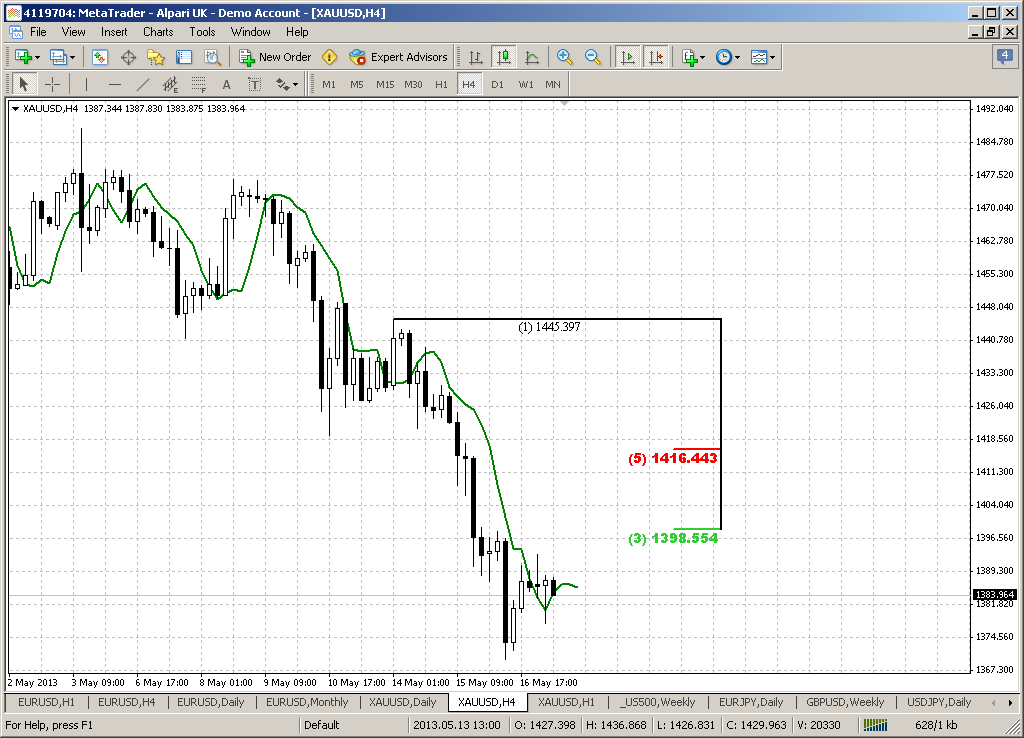
4-hour
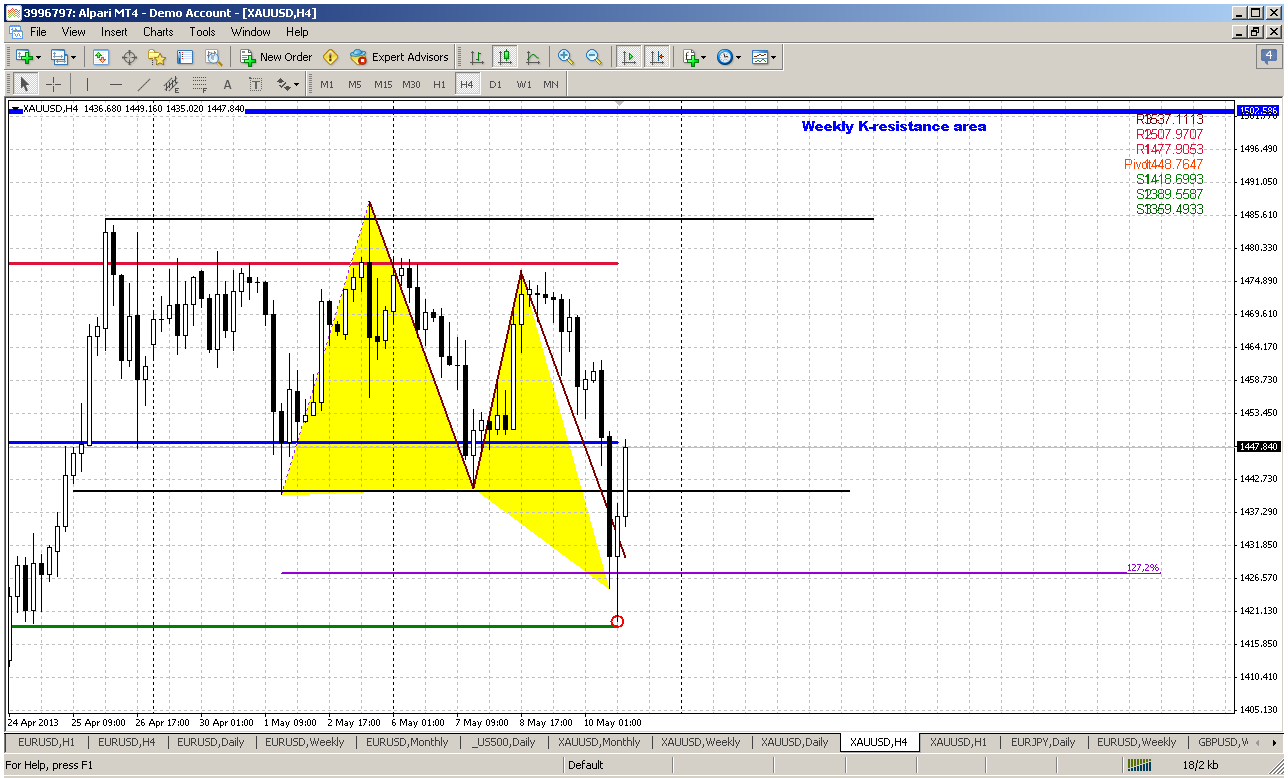
This time frame is more interesting, but still cares more riddles than answers. Instead of upward butterfly we’ve got downward butterfy “buy” but most interesting is – what the last move up was? Was it just profit taking or real return back inside of consolidation. Depending on answer we have to count on different development. We see that market has reached AB-CD target and 1.27 extension of butterfly. Here pivot point will give us assistance in the beginning of the week. If market will move and hold above it, then we probably can treat this breakout as fake one and, hence, should be ready as we’ve said above for further upward action to the border or even to 1505 level.
If market will fail around WPP and move again below the lower border of consolidation, then it was just profit taking and market will go lower. With first scenario we will do nothing, but wait and preparing for short entry around 1500-1505 area. If market will continue move down then we will keep an eye on 1380 5/8 Fib support level, since here move down could finish and continuation of upward daily leg could follow.
Sponsored by Pellucid FX - Premium STP Forex Broker >>
Conclusion:
Gold market now cares more questions rather than answers. Price action is very unstable and volatile. That’s why in recent updates I mostly offer to wait really significant levels that could give more or less feasible protection. One of these levels is 1500-1503 where should be relatively safe to enter short. Another level is a finish of possible downward retracement that should become BC leg of our AB-CD pattern that we intend to trade on daily time frame. But now gold is still messing inside of tight consolidation.
The gold games are continuing and on Friday we probably have seen cunning W&R and stop grabbing below lower border of consolidation. If on Monday market will hold above WPP, then we probably should be ready for similar action around upper border and that will be our chance to enter short.
If this was just a profit taking and market will return below the lower border – then it is better to wait at least 1380 area, where downward retracement could finish. Trading gold inside of consolidation is rather expensive issue.
The technical portion of Sive's analysis owes a great deal to Joe DiNapoli's methods, and uses a number of Joe's proprietary indicators. Please note that Sive's analysis is his own view of the market and is not endorsed by Joe DiNapoli or any related companies.
Gold slid for a second consecutive day as the yen plummeted to its lowest against the U.S. dollar in more than four years on Friday, a day after the U.S. currency rose above the 100-yen level. The dollar rally also weighed on industrial commodities led by crude
Gold's sharp losses last month has intensified a disconnect between funds that sold on dissatisfaction over bullion's underperformance and individual investors who could not get enough physical gold coins and bars at bargain prices.
Fundamentally the explanation of plunge on passed week is the same – low attractiveness of gold, compares to other assets with current anemic inflation. New splash in dollar strength has led to downward continuation on gold market. Even demand on physical gold among population of India and China can’t stop price decreasing. As we’ve said on previous week - although we see a lot of signs greater liquidity inflow in world economy, such as Fed promise to continue $85B monthly bond purchases, reducing ECB rate and intention of Bank of Japan to inject about $1.4 trillion into its economy to spur growth. Still, as there is no such thing as a hyperinflation scenario for at least the Western countries, that's why many investors think that gold will suffer in the medium term and put attention on more risky assets, such as US equities.
Although currently SPDR Fund reports inflow, but it looks anemic compares to huge withdrawal that has happened since the start of the year. Analysts tell about significant gold-buying Indian festival on May 13, that could tight difference between huge supply from institutional investors and demand from public, but hardly it will make drastical impact on overall weak sentiment.
Technically some downward acceleration was triggered by stop reaching below 1440 support area.
Analysis of open interest and gold price shows that open interest has increased as short position becomes larger:
These events confirms our assumption that current move up was just a retracement when investors just want to take breath after huge sell-off in the middle of April.
Sponsored by Pellucid FX - Premium STP Forex Broker >>
Monthly
On monthly time frame we do not see a lot of action, since price is pressed by oversold condition and May is rather small-ranged candle compares to April. Probably we can call is a breath taking period by investors. When the bearish doom & gloom has finished by mass profit taking and fast move down come to pass – now investors are trying to re-assess what to do next and trying to enter in the same water again.
Fundamentally overall picture remains moderately bearish as technically. Market has significant bearish impulse that probably should lead to some continuation in the future. The nearest destination point is a harmonic swing target at major 3/8 Fib support.
But from technical point of view it is difficult to find reasons now to take long-term bearish position, since it will constantly be under the risk of significant pullback due oversold condition. Thus we continue to stand with our plan of more extended upward retracement on daily time frame.
Sponsored by Pellucid FX - Premium STP Forex Broker >>
Weekly
Although on EUR weekly chart we’ve got major information for analysis, I can’t tell the same about gold market. Two recent weeks is very difficult to comment, since they are rather small in terms of range, especially previous one. Now we see that market has failed not only to move above MPP, but also to test Weekly K-resistance area and hints on potential move down.
Currently our analysis of weekly time frame is based on expectation of counter reaction to deep oversold situation on monthly chart and former oversold here on weekly. Since initial reaction that has put market under deep oversold was really strong, some kind of counter reaction of comparable strength should follow. And this counter reaction should lead market to a bit higher levels, than it stands now. This counter move up has started from support and oversold on weekly time frame and has formed first upward leg. In general this total setup has definite name by DiNapoli framework, and assumes taking short-term long position at the retracement from first bounce up. The minimum objective target is minor 0.618 extension of resulting AB-CD pattern. And now it looks like this retracement has started. Hence our task is to estimate potential end point of this retracement and pattern that will let us to enter long.
At least now I see no other setups or patterns here that we could trade except to stick with DiNapoli directional pattern and count on the moment that gold likes to make deep retracements up.
Daily
It is very difficult to give comments guys on daily gold chart. Just look at the picture – what do you see here? Can you give any definite commentary that will clarify further direction or at least to tell something new? Hardly since price stands flat for 2 weeks… that’s why gold market is not very attractive for trading on daily time frame. What nuances I see here… Trend still holds bullish here and all price action for whole month is held by long black candle. In fact it carries all past action inside. This is very often happens after big moves. Particularly by this reason the high and low of this candle becomes very significant levels and breakout direction could determine the trend for medium-term perspective.
What else can we see? Right near the high of this candle we have strong resistance area – daily overbought, 5/8 minor Fib resistance and weekly K-resistance slightly higher. This level limits potential upward move and tells that market will not able to move significantly above it. Hence this is the ultimate level for upward action in nearest perspective.
And last one moment that seems to be very significant for coming week – we have consolidation downward breakout failure, at least this could be fake breakout, if market will not move again below its lower border. If this is really true, then we have to be ready for moving to upper border of consolidation or even for upward breakout. Who knows this could be W&R again as it was with downward breakout, but as we’ve said above – market will not be able to pass 1500 area freely.
4-hour
This time frame is more interesting, but still cares more riddles than answers. Instead of upward butterfly we’ve got downward butterfy “buy” but most interesting is – what the last move up was? Was it just profit taking or real return back inside of consolidation. Depending on answer we have to count on different development. We see that market has reached AB-CD target and 1.27 extension of butterfly. Here pivot point will give us assistance in the beginning of the week. If market will move and hold above it, then we probably can treat this breakout as fake one and, hence, should be ready as we’ve said above for further upward action to the border or even to 1505 level.
If market will fail around WPP and move again below the lower border of consolidation, then it was just profit taking and market will go lower. With first scenario we will do nothing, but wait and preparing for short entry around 1500-1505 area. If market will continue move down then we will keep an eye on 1380 5/8 Fib support level, since here move down could finish and continuation of upward daily leg could follow.
Sponsored by Pellucid FX - Premium STP Forex Broker >>
Conclusion:
Gold market now cares more questions rather than answers. Price action is very unstable and volatile. That’s why in recent updates I mostly offer to wait really significant levels that could give more or less feasible protection. One of these levels is 1500-1503 where should be relatively safe to enter short. Another level is a finish of possible downward retracement that should become BC leg of our AB-CD pattern that we intend to trade on daily time frame. But now gold is still messing inside of tight consolidation.
The gold games are continuing and on Friday we probably have seen cunning W&R and stop grabbing below lower border of consolidation. If on Monday market will hold above WPP, then we probably should be ready for similar action around upper border and that will be our chance to enter short.
If this was just a profit taking and market will return below the lower border – then it is better to wait at least 1380 area, where downward retracement could finish. Trading gold inside of consolidation is rather expensive issue.
The technical portion of Sive's analysis owes a great deal to Joe DiNapoli's methods, and uses a number of Joe's proprietary indicators. Please note that Sive's analysis is his own view of the market and is not endorsed by Joe DiNapoli or any related companies.