Sive Morten
Special Consultant to the FPA
- Messages
- 18,695
Fundamentals
On past week gold has continued downward tendency, or better to say re-established downward action as dollar rose to highest since 2008 after some Federal Reserve officials said the central bank should end its stimulus for the U.S. economy.
Fundamentally we know where the problems are. As US economy gradually starts to show improvement in statistical data, inflation still stands anemic. Such sort of combination is a dreadful cocktail for gold. Thus on previous week Investors also rejected gold's safe-haven lure after a May reading for U.S. consumer sentiment hit a near six-year high, showing Americans are feeling better about their financial and economic prospects. The Thomson Reuters/University of Michigan's preliminary reading on the overall index on consumer sentiment rose to 83.7 from 76.4 in April, topping economists' expectations for 78. Early we’ve mentioned about improvements in other spheres – labor and sales. Although many investors tell about tremendous growth on equity market, I still look at this with some suspicions. The point is that current equity growth mostly is a bubble that absorbs all money that investors withdraw from other assets, including gold. This fact could be confirmed by some moments. First is bond market – it stands flat and yields are not growing. Second – US companies. Their results are shallow and in general they come to growing profits by expenses reducing steps, but not due growing revenues and sales. That’s why I still think that stock market is mostly the result of Fed policy and a victim, rather than the initial reason of gold falling. I think that it is overvalued currently. Still, major U.S. stock indexes were on track to close up for a fourth straight week as the dollar rocketed to a 4-1/2-year high against the yen.
Speaking about Fed policy, a trio of hawkish regional Federal Reserve officials has called on the central bank to stop buying mortgage-backed bonds, citing the recent improvement in the U.S. housing market. San Francisco Fed chief John Williams, one of the three, said he expected U.S. stimulus action to ease from this summer. Richard Fisher, head of the Dallas Fed, meanwhile, said "the efficacy of continued (bond) purchases is questionable."
Thus, fundamentally fast decreasing of gold prices has one major reason. This is unfavorable combination of anemic inflation and US economy improvement data. If bond market would be not as overbought as it stands now, I probably would put the bet on money flow mostly in the bond market and partially in the stock market. But as bond market extremely overbought, investors in fact have no choice in their running for return and put funds in stocks, despite how expensive they are.
At the same time, we already have discussed long-term US economy risks. Particularly they concern US budget sequestering, end of tax benefit program and Debt ceil debates that should happen soon. These moments could make negative impact on consumption in long-term period. If this will be accompanied by inflation resurrection this could trigger at least deep retracement on stock markets. So I think that it is too early to fall in euphoria with stocks. Probably it is better to focus on Asian stock market or Emerging market mixed funds that include investing as in stock as in bonds. Another solution could be focusing on stocks with high dividend yield. This could last for really long time, when situation will become safe and clear to invest in risky assets. First sign of it probably will be US Treasuries yield decrease.
Speaking about technical moments we see almost the same picture with growing of Open Interest and decreasing of Net long speculative positions, that confirms existing of long-term bear trend:
The largest, New York's SPDR Gold Trust, reported an outflow of another 5.7 tonnes on Thursday, bringing the drop in its holdings this week to more than 10 tonnes. This decreasing is going with simultaneous growth of open interest and reducing of net long speculative positions. Current combination is typical for bear trend.

Sponsored by Pellucid FX - Premium STP Forex Broker >>
Monthly
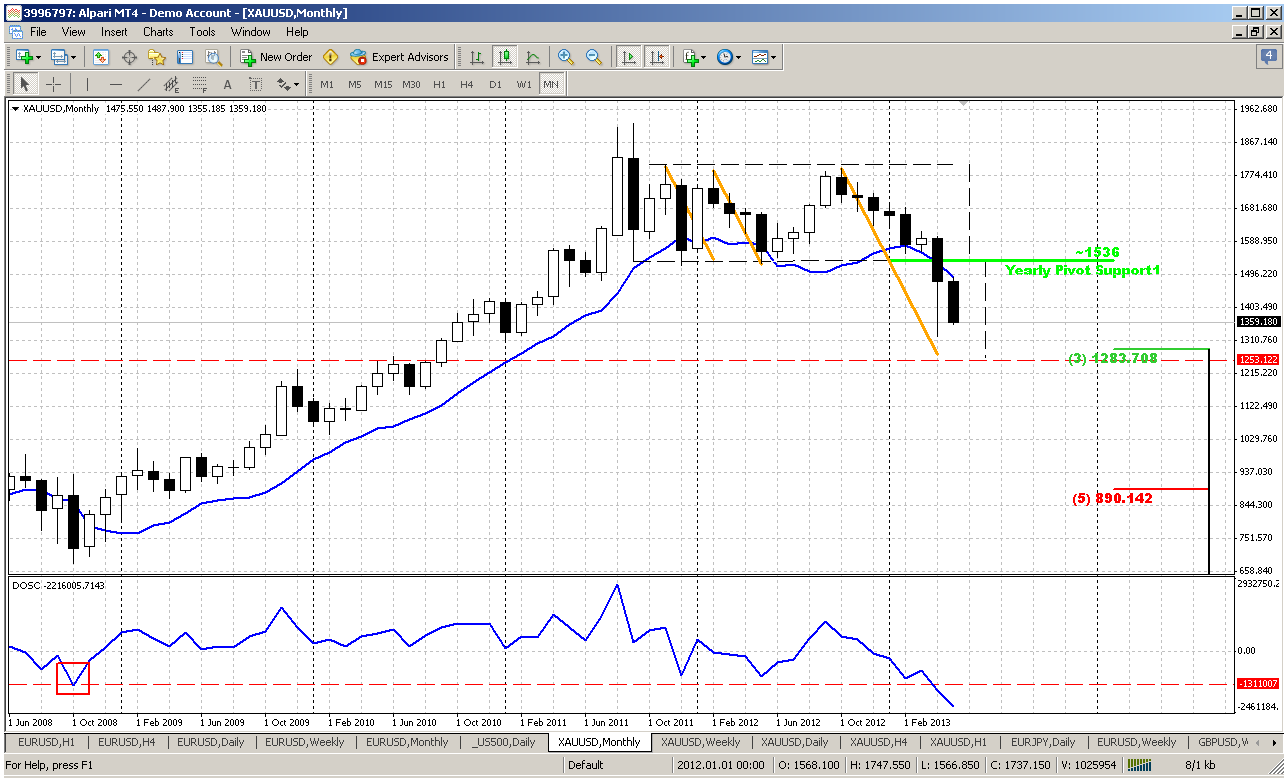
On monthly time frame market looks extremely bearish. Trend is down, market has moved below yearly pivot support 1 and this is strong bearish fact itself. But as May close price currently stands at extreme low – possible VOB (Volatility breakout) signal could rebound. Take a look at DOSC indicator again – market now stands at all time extreme point that is lower than the previous extreme value in 2008.
If May close will happen somewhere in this area – this significantly will increase probability of 2-step downward action as AB-CD. Other words, it will mean that downward move will get an extra mile. And will give much more confidence with deeper retracement, may be even 850-1000 area.
At the same time this carries problem for us. Since it becomes very difficult to treat oversold and overbought conditions. For example, now market is strongly oversold, but since this comes due fundamental globe flow of funds out of the gold, we can’t definitely say solely by oversold analysis, whether market continue move down or will show bounce up. Since normal behavior of indicator is distorted now by fundamental influence.
Sponsored by Pellucid FX - Premium STP Forex Broker >>
Weekly
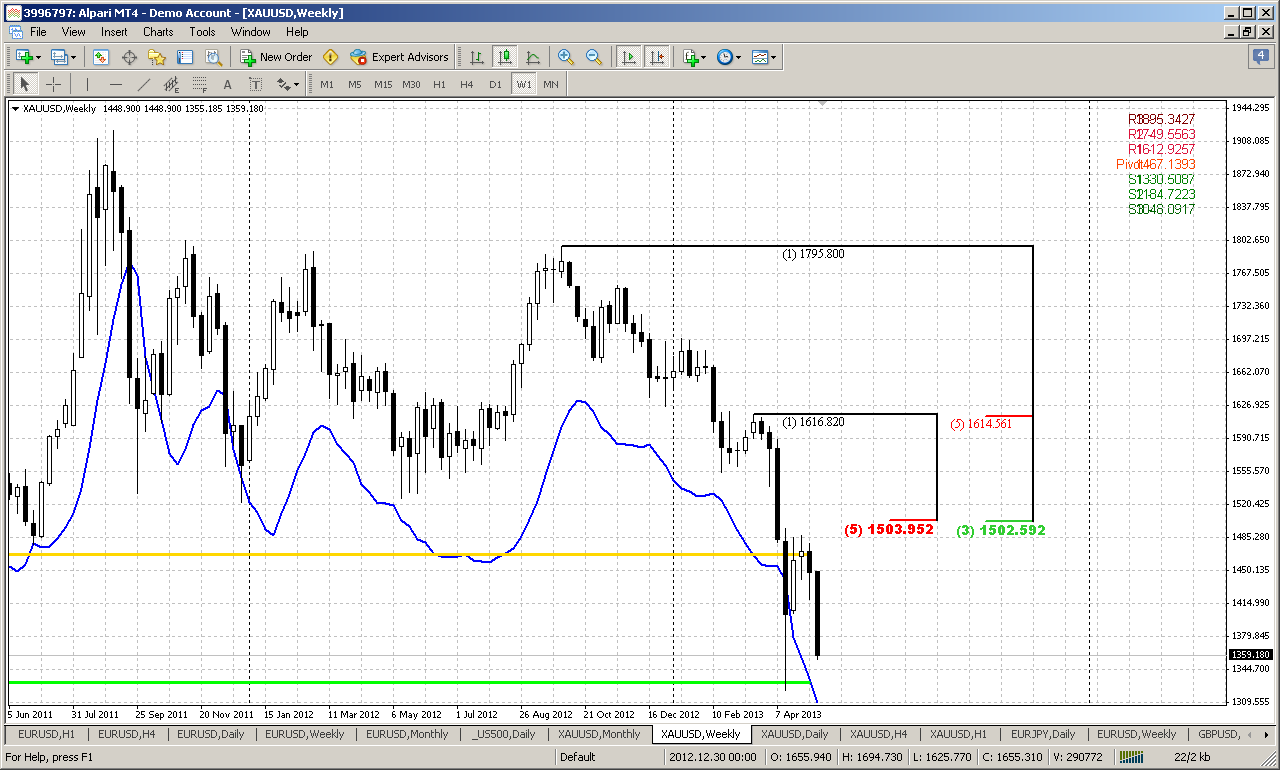
On weekly time frame, despite of deep oversold and solid support area around 1320, market was able to show just minor 5/8 retracement to K-resistance area, tested MPP and turned right back down. Situation with stronger than ever oversold condition on monthly makes weekly analysis rather difficult. May be market will totally disrespect this and fundamental factor will again dominate over market for sometime, but we can’t rely on this, since we do not know this definitely. Our task is dealing with probabilities. If we will take a look at weekly gold from this perspective, then there are two points that we should be focused on here. First is – if we will take short position, we have to be extra careful or even avoid keeping it below current 1320 lows, particularly due monthly deep oversold. Second is – since 1320 area is 1.618 extension target and MPS1 market still could show deeper bounce by Double Bottom pattern. I do not want to say that it has to happen, I just try to catch important moments from what I see here. This lets us to create approximate trading plan – trying to enter short on lower time frames with target around 1320. When market will hit it – wait possible signs of either Double bottom for deeper retracement up or clear signs of downward continuation.
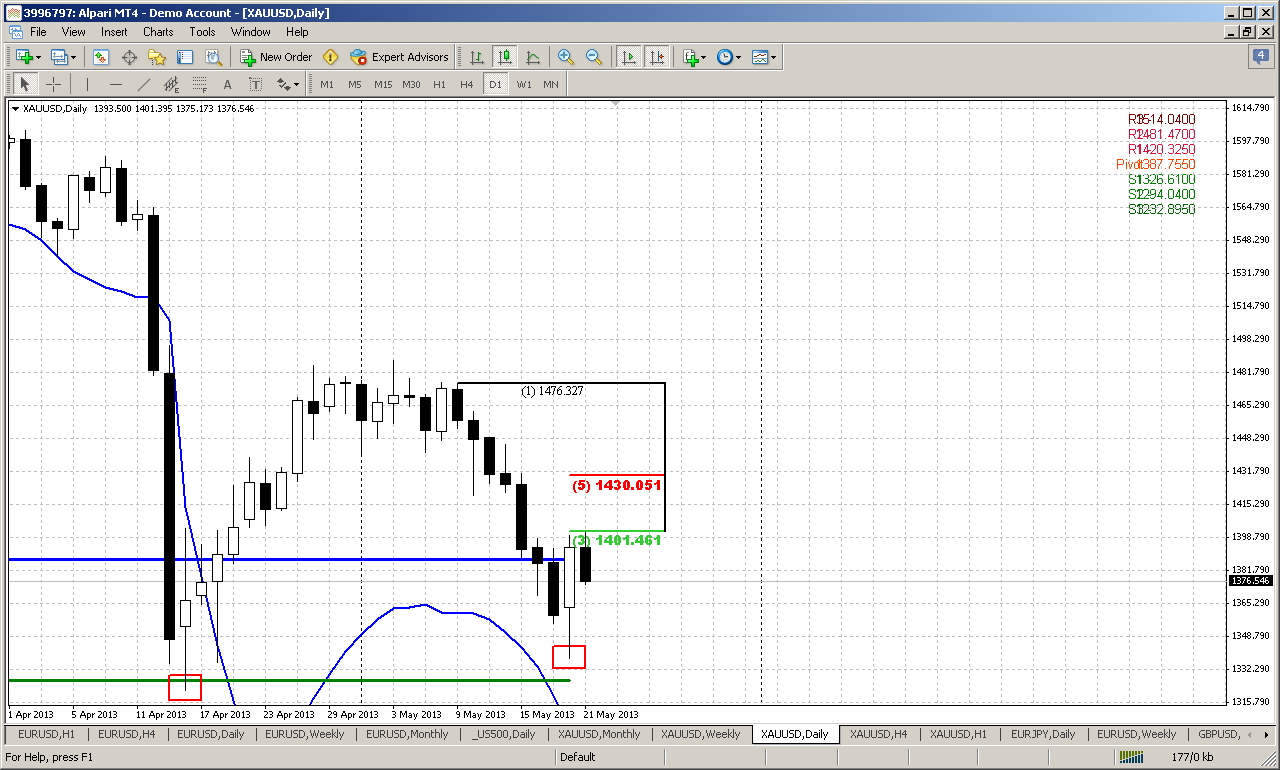
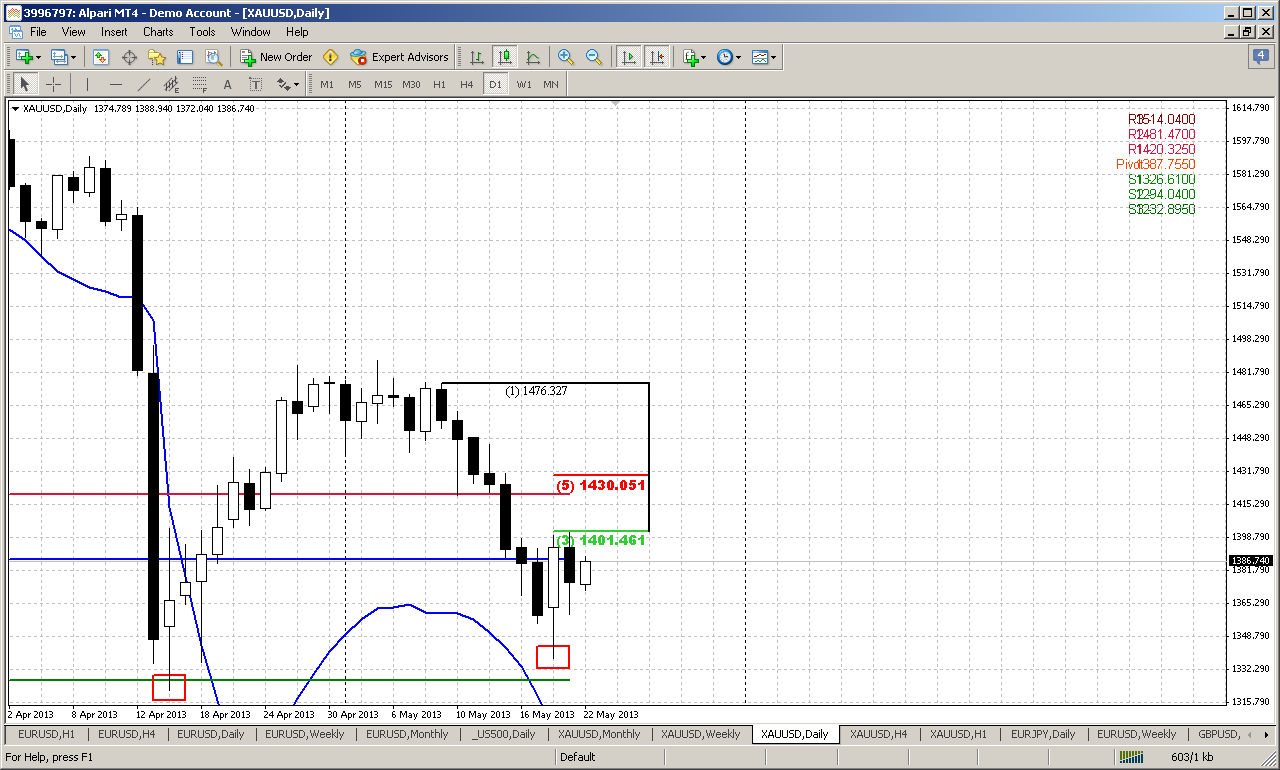
Daily
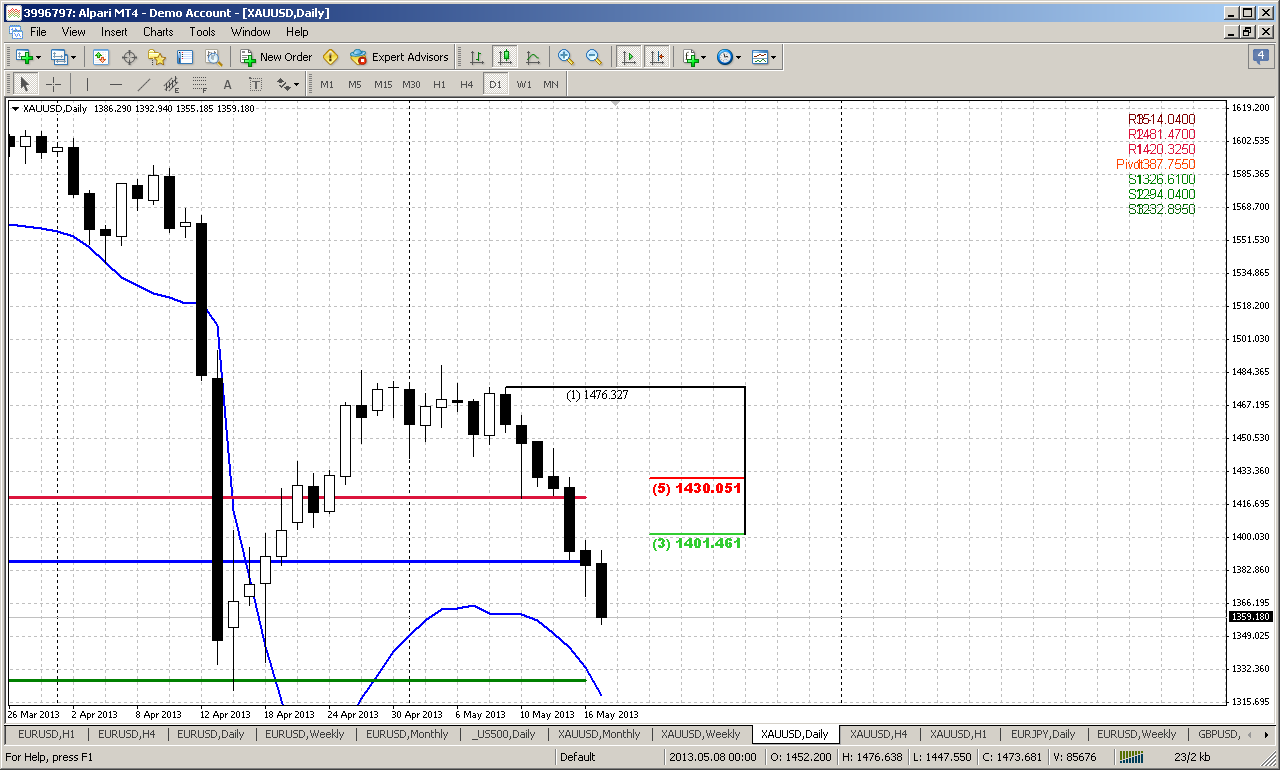
On daily time frame market has passed through all major supports and targets and in fact now stands in free area till the 1320 lows. Trend is bearish here. Daily oversold level allows price to reach this level. We can see that WPS1 stands right at lows as well as MPS1. I do not see any patterns here right now. Hopefully, if market will show bounce to WPP and 3/8 Fib resistance – that could a chance for scalp short to 1320 area. This is in fact, first stage of the plan.
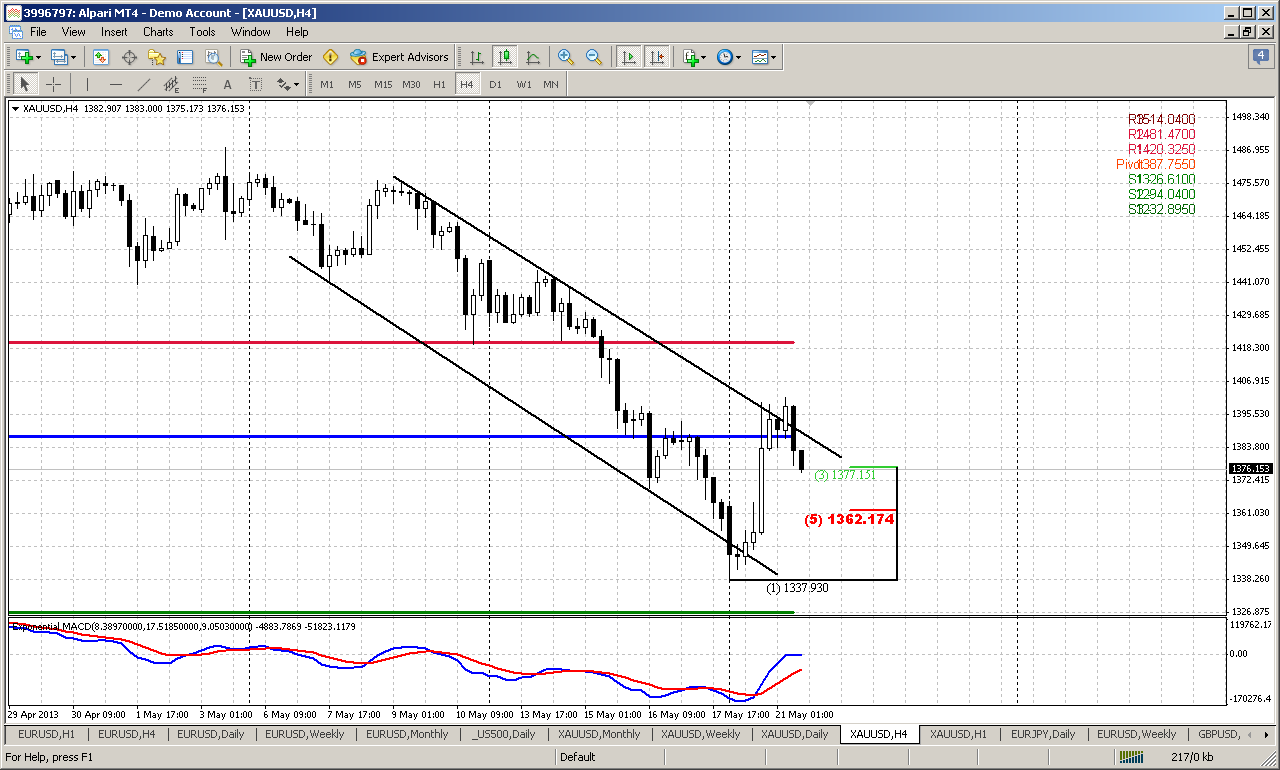
1-hour
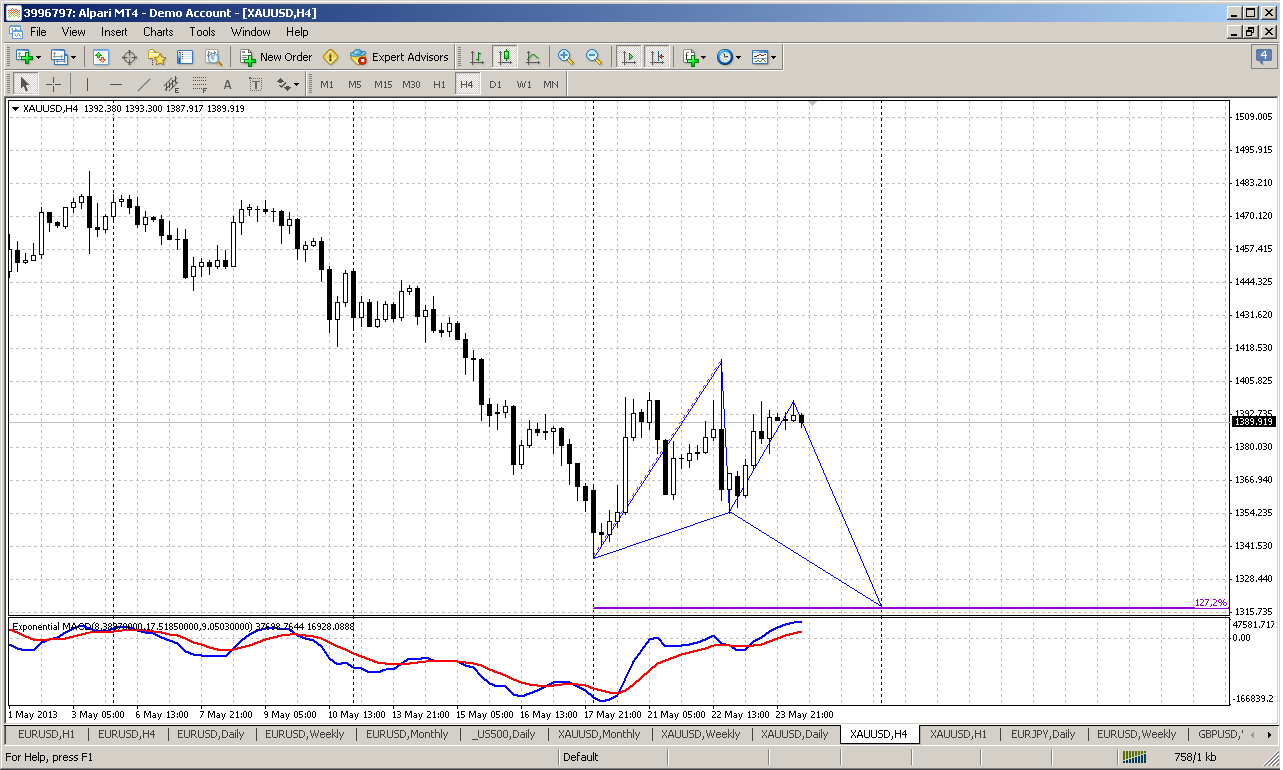
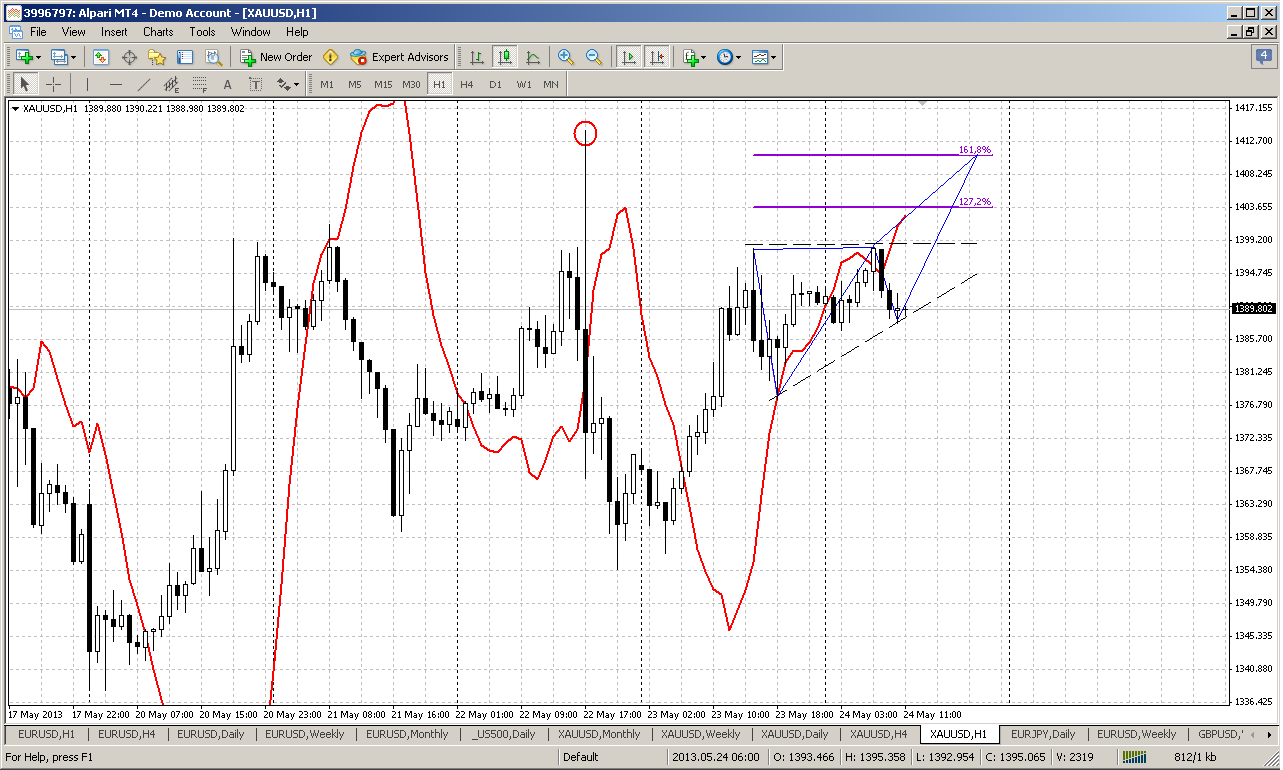
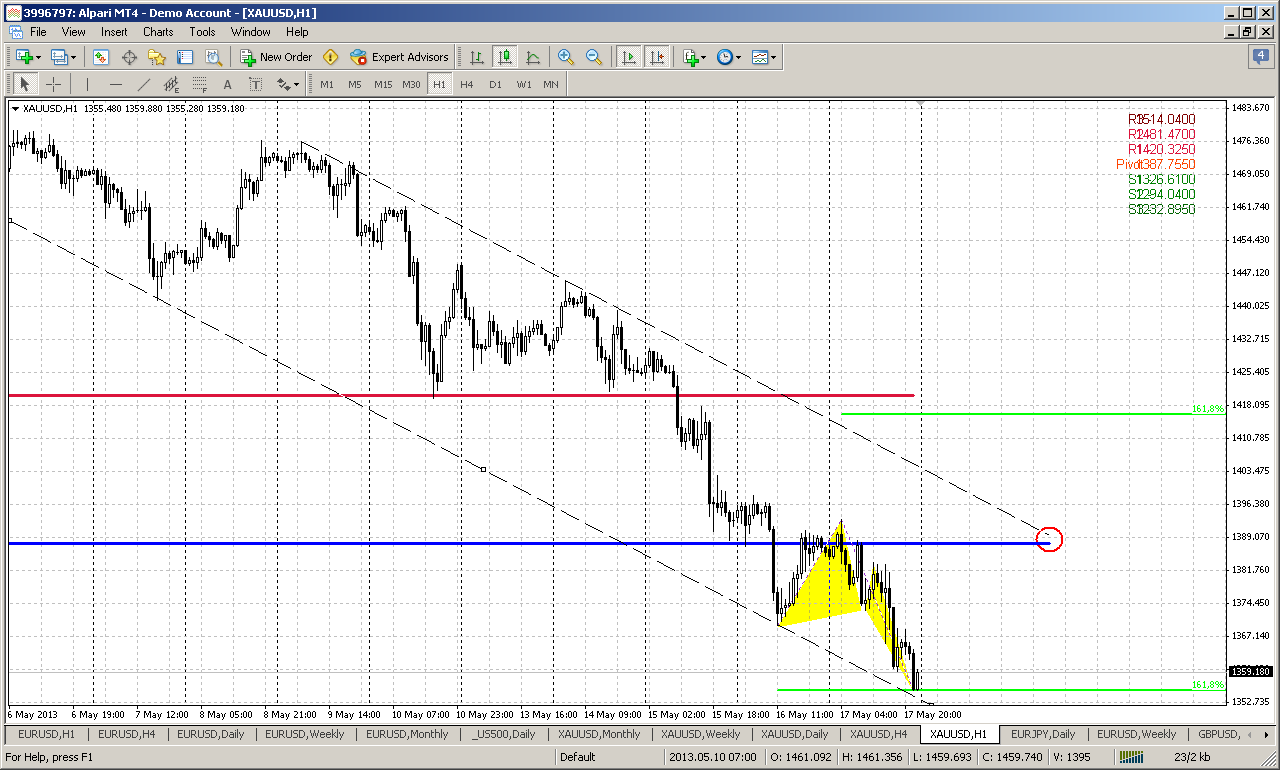
On Friday we’ve said that market still could show reversal patterns around, but will they work or not – is quite different question. So, If you remember we’ve discussed two possibilities – DRPO “Buy” on 4 hour chart and Butterfly on hourly chart. Since our butterfly has proceeded to 1.618 target – it makes DRPO appearing rather difficult, because now there is a too much difference between DRPO bottoms. Thus, I offer to you be focused only on butterfly pattern.
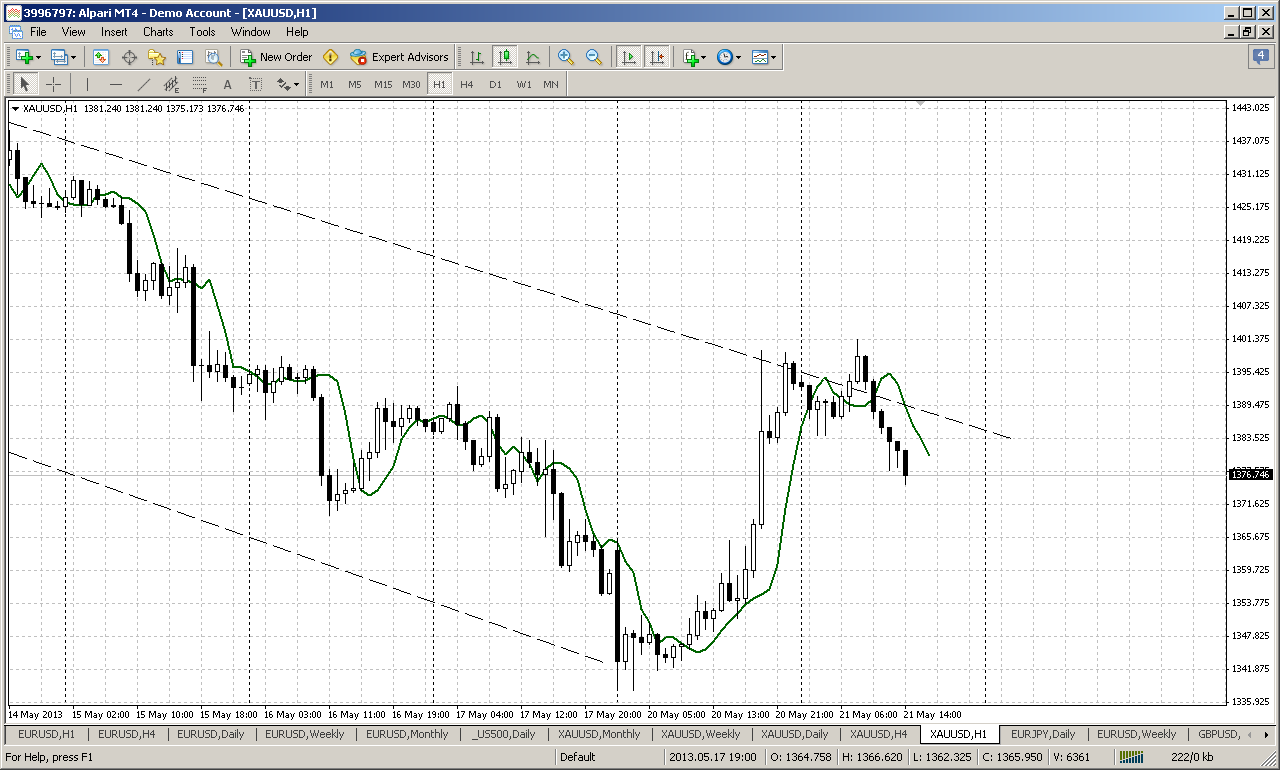
As you can see action on hourly time frame holds in downward channel, and buttefly has appeared right at its bottom. This makes pullback more probable. The nearest target will be crossing of upper channel line and WPP around 1390 – that’s by the way very close to daily 3/8 Fib resistance, while farer target stands around WPR1 and ultimate 1.618 butterfly target around 1418.
So, if butterlfy will work – we should be careful and be focused on one of these levels for short entry. I also absolutely do not object against scalp buy trade, but you should understand what risks you are taking in this case – all trends are bearish, and market not at support, except this channel’s border.
If butterfly will fail, then, probably market will proceed directly to 1320 low and currently is very difficult to say, what opportunities we could get for trading in this case. This move could become fast, and in fact we can appear not in time to do anything.
Sponsored by Pellucid FX - Premium STP Forex Broker >>
Conclusion:
Technically and fundamentally gold market stands in long-term bearish motion, but extreme oversold level on monthly time frame puts limitations on positions and targets that we can get on lower time frames. That’s why currently it is very dangerous trying to keep shorts below current low around 1320 – that will be our next downward target.
Unfortunately as on weekly as on daily charts we do not have any patterns that could give us hints on possible significant upward retracement. All that we have now is small butterfly pattern on hourly chart that, as we hope, will be able to trigger bounce at least to WPP testing around 1390 area. If this will really happen, then we can try to take short around WPP with target at 1320. If butterfly will fail, then market will reach 1320 pretty fast, I suppose and hardly we will be able to do anything.
Still, existence of support around 1320 area makes possible appearing of Double bottom pattern on daily, but this we will discussed on next week or even later, depending on when and how market will hit 1320 lows.
The technical portion of Sive's analysis owes a great deal to Joe DiNapoli's methods, and uses a number of Joe's proprietary indicators. Please note that Sive's analysis is his own view of the market and is not endorsed by Joe DiNapoli or any related companies.
On past week gold has continued downward tendency, or better to say re-established downward action as dollar rose to highest since 2008 after some Federal Reserve officials said the central bank should end its stimulus for the U.S. economy.
Fundamentally we know where the problems are. As US economy gradually starts to show improvement in statistical data, inflation still stands anemic. Such sort of combination is a dreadful cocktail for gold. Thus on previous week Investors also rejected gold's safe-haven lure after a May reading for U.S. consumer sentiment hit a near six-year high, showing Americans are feeling better about their financial and economic prospects. The Thomson Reuters/University of Michigan's preliminary reading on the overall index on consumer sentiment rose to 83.7 from 76.4 in April, topping economists' expectations for 78. Early we’ve mentioned about improvements in other spheres – labor and sales. Although many investors tell about tremendous growth on equity market, I still look at this with some suspicions. The point is that current equity growth mostly is a bubble that absorbs all money that investors withdraw from other assets, including gold. This fact could be confirmed by some moments. First is bond market – it stands flat and yields are not growing. Second – US companies. Their results are shallow and in general they come to growing profits by expenses reducing steps, but not due growing revenues and sales. That’s why I still think that stock market is mostly the result of Fed policy and a victim, rather than the initial reason of gold falling. I think that it is overvalued currently. Still, major U.S. stock indexes were on track to close up for a fourth straight week as the dollar rocketed to a 4-1/2-year high against the yen.
Speaking about Fed policy, a trio of hawkish regional Federal Reserve officials has called on the central bank to stop buying mortgage-backed bonds, citing the recent improvement in the U.S. housing market. San Francisco Fed chief John Williams, one of the three, said he expected U.S. stimulus action to ease from this summer. Richard Fisher, head of the Dallas Fed, meanwhile, said "the efficacy of continued (bond) purchases is questionable."
Thus, fundamentally fast decreasing of gold prices has one major reason. This is unfavorable combination of anemic inflation and US economy improvement data. If bond market would be not as overbought as it stands now, I probably would put the bet on money flow mostly in the bond market and partially in the stock market. But as bond market extremely overbought, investors in fact have no choice in their running for return and put funds in stocks, despite how expensive they are.
At the same time, we already have discussed long-term US economy risks. Particularly they concern US budget sequestering, end of tax benefit program and Debt ceil debates that should happen soon. These moments could make negative impact on consumption in long-term period. If this will be accompanied by inflation resurrection this could trigger at least deep retracement on stock markets. So I think that it is too early to fall in euphoria with stocks. Probably it is better to focus on Asian stock market or Emerging market mixed funds that include investing as in stock as in bonds. Another solution could be focusing on stocks with high dividend yield. This could last for really long time, when situation will become safe and clear to invest in risky assets. First sign of it probably will be US Treasuries yield decrease.
Speaking about technical moments we see almost the same picture with growing of Open Interest and decreasing of Net long speculative positions, that confirms existing of long-term bear trend:
The largest, New York's SPDR Gold Trust, reported an outflow of another 5.7 tonnes on Thursday, bringing the drop in its holdings this week to more than 10 tonnes. This decreasing is going with simultaneous growth of open interest and reducing of net long speculative positions. Current combination is typical for bear trend.
Sponsored by Pellucid FX - Premium STP Forex Broker >>
Monthly
On monthly time frame market looks extremely bearish. Trend is down, market has moved below yearly pivot support 1 and this is strong bearish fact itself. But as May close price currently stands at extreme low – possible VOB (Volatility breakout) signal could rebound. Take a look at DOSC indicator again – market now stands at all time extreme point that is lower than the previous extreme value in 2008.
If May close will happen somewhere in this area – this significantly will increase probability of 2-step downward action as AB-CD. Other words, it will mean that downward move will get an extra mile. And will give much more confidence with deeper retracement, may be even 850-1000 area.
At the same time this carries problem for us. Since it becomes very difficult to treat oversold and overbought conditions. For example, now market is strongly oversold, but since this comes due fundamental globe flow of funds out of the gold, we can’t definitely say solely by oversold analysis, whether market continue move down or will show bounce up. Since normal behavior of indicator is distorted now by fundamental influence.
Sponsored by Pellucid FX - Premium STP Forex Broker >>
Weekly
On weekly time frame, despite of deep oversold and solid support area around 1320, market was able to show just minor 5/8 retracement to K-resistance area, tested MPP and turned right back down. Situation with stronger than ever oversold condition on monthly makes weekly analysis rather difficult. May be market will totally disrespect this and fundamental factor will again dominate over market for sometime, but we can’t rely on this, since we do not know this definitely. Our task is dealing with probabilities. If we will take a look at weekly gold from this perspective, then there are two points that we should be focused on here. First is – if we will take short position, we have to be extra careful or even avoid keeping it below current 1320 lows, particularly due monthly deep oversold. Second is – since 1320 area is 1.618 extension target and MPS1 market still could show deeper bounce by Double Bottom pattern. I do not want to say that it has to happen, I just try to catch important moments from what I see here. This lets us to create approximate trading plan – trying to enter short on lower time frames with target around 1320. When market will hit it – wait possible signs of either Double bottom for deeper retracement up or clear signs of downward continuation.
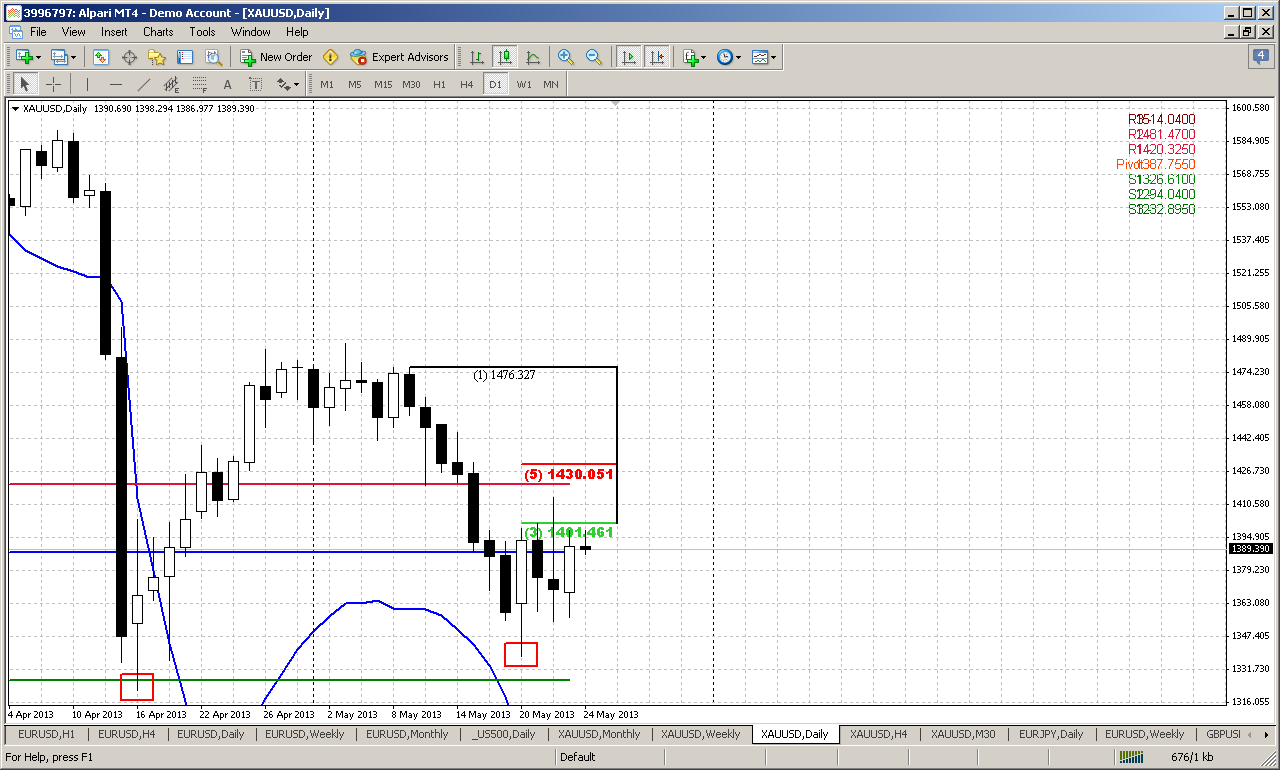
Daily
On daily time frame market has passed through all major supports and targets and in fact now stands in free area till the 1320 lows. Trend is bearish here. Daily oversold level allows price to reach this level. We can see that WPS1 stands right at lows as well as MPS1. I do not see any patterns here right now. Hopefully, if market will show bounce to WPP and 3/8 Fib resistance – that could a chance for scalp short to 1320 area. This is in fact, first stage of the plan.
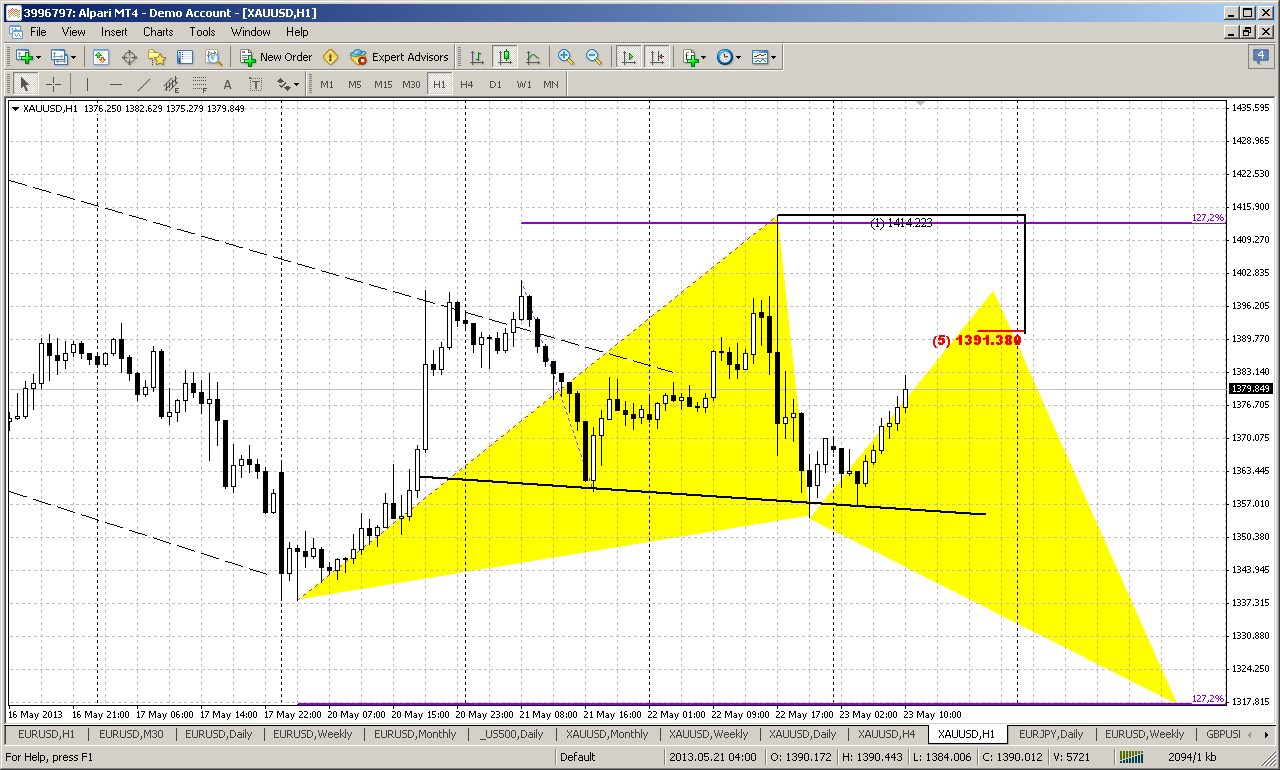
1-hour
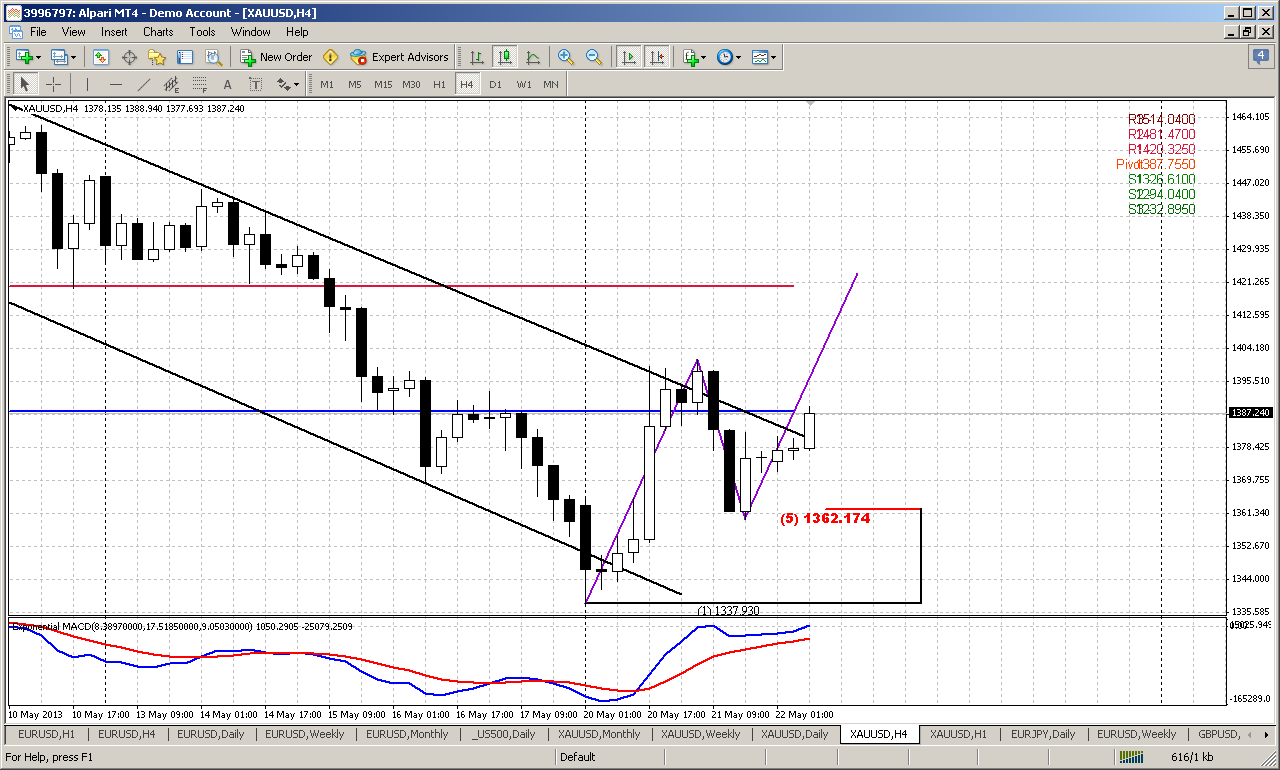
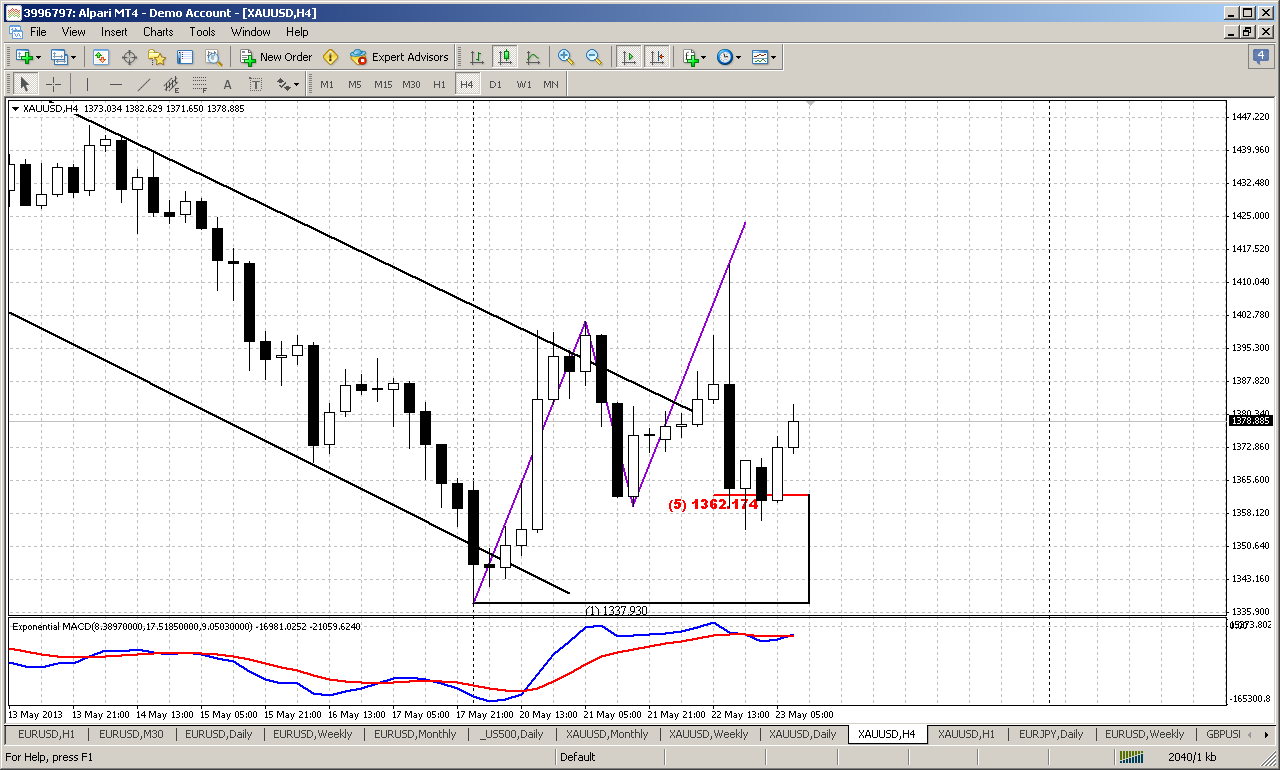
On Friday we’ve said that market still could show reversal patterns around, but will they work or not – is quite different question. So, If you remember we’ve discussed two possibilities – DRPO “Buy” on 4 hour chart and Butterfly on hourly chart. Since our butterfly has proceeded to 1.618 target – it makes DRPO appearing rather difficult, because now there is a too much difference between DRPO bottoms. Thus, I offer to you be focused only on butterfly pattern.
As you can see action on hourly time frame holds in downward channel, and buttefly has appeared right at its bottom. This makes pullback more probable. The nearest target will be crossing of upper channel line and WPP around 1390 – that’s by the way very close to daily 3/8 Fib resistance, while farer target stands around WPR1 and ultimate 1.618 butterfly target around 1418.
So, if butterlfy will work – we should be careful and be focused on one of these levels for short entry. I also absolutely do not object against scalp buy trade, but you should understand what risks you are taking in this case – all trends are bearish, and market not at support, except this channel’s border.
If butterfly will fail, then, probably market will proceed directly to 1320 low and currently is very difficult to say, what opportunities we could get for trading in this case. This move could become fast, and in fact we can appear not in time to do anything.
Sponsored by Pellucid FX - Premium STP Forex Broker >>
Conclusion:
Technically and fundamentally gold market stands in long-term bearish motion, but extreme oversold level on monthly time frame puts limitations on positions and targets that we can get on lower time frames. That’s why currently it is very dangerous trying to keep shorts below current low around 1320 – that will be our next downward target.
Unfortunately as on weekly as on daily charts we do not have any patterns that could give us hints on possible significant upward retracement. All that we have now is small butterfly pattern on hourly chart that, as we hope, will be able to trigger bounce at least to WPP testing around 1390 area. If this will really happen, then we can try to take short around WPP with target at 1320. If butterfly will fail, then market will reach 1320 pretty fast, I suppose and hardly we will be able to do anything.
Still, existence of support around 1320 area makes possible appearing of Double bottom pattern on daily, but this we will discussed on next week or even later, depending on when and how market will hit 1320 lows.
The technical portion of Sive's analysis owes a great deal to Joe DiNapoli's methods, and uses a number of Joe's proprietary indicators. Please note that Sive's analysis is his own view of the market and is not endorsed by Joe DiNapoli or any related companies.