Sive Morten
Special Consultant to the FPA
- Messages
- 18,655
Fundamentals
Yesterday in our FX report we've said that fundamental component is more interesting then technical one, but on gold market today is an opposite situation. On fundamental background we do not have something really new. There are three major components right now - reaction on Fed statement, US/China negotiations and Middle East tensions.
First driving factor is worked out already. Once J. Powell has announced the statement, gold has shown the same reaction as other markets across the board - minor dive on intraday charts due positive Fed view on US economy in general. But, initial drop was reversed relatively fast, as rate still was cut and some chances on another cut still stands on the table.
Middle East tensions around Aramco and Iran - Saudi Arabia relations has brought some support to gold, especially when D. Trump announced additional US troops contingent in S. Arabia to support ally.
As Reuters reports - Gold edged higher on Friday, heading for its first weekly rise in four, as investors focused on Middle East tensions while palladium hit a record peak on short supply.
“The jittery situation in the Middle East is one of the reasons to be concerned and switch to safe havens after disappointing knee-jerk reaction following the U.S. Federal Reserve rate cut,” said Commerzbank analyst Eugen Weinberg.
Adding to gold’s appeal, the United States said it was building a coalition to deter Iranian threats after last weekend’s attack on Saudi Arabian oil facilities.
Another supportive factor was the Fed’s second interest rate cut this year, though the central bank gave mixed signals on future cuts.
“(The) Global outlook still looks quite unfavourable and central banks around the globe will continue to ease monetary policy, which will be beneficial for gold,” said FXTM analyst Lukman Otunuga.
Lower interest rates reduce the opportunity cost of holding non-yielding bullion and weigh on the dollar, making gold cheaper for investors holding other currencies.
Finally, the major short-term driving factor is US/Sino tariffs negotiations which will drive the market in the beginning of the week. The recent news have not been priced-in yet and, as we suggest, they should push gold higher right on Monday.
Markets also focused on U.S.-China trade talks in Washington before high-level discussions next month. U.S. and Chinese deputy trade negotiators resumed face-to-face talks for the first time in nearly two months on Thursday.
But recent rumors tell that China delegation has stopped negotiations and leaved US without any explanations.
A U.S.-China trade deal appeared elusive on Friday after Chinese officials unexpectedly canceled a visit to farms in Montana and Nebraska as deputy trade negotiators wrapped up two days of negotiations in Washington.
This news have not been priced in by far and should push gold higher on Monday's open.
“Given potential upside catalysts (for gold) in the coming months, such as a dovish Fed and trade uncertainty, there is a risk that investors once again get left behind,” UBS analysts said in a note.
“Indicators suggest that market participants have reduced longs and are focusing on the $1,480 support area all the way down to $1,450 as attractive levels to re-engage.”
Indeed recent CFTC data shows that net long position steps out a bit from record high levels, supporting recent pullback on gold market. But this contraction doesn't show the signs of massive sell-off, stands gradual and mostly indicates long covering by short-term traders on retracement.

Source: cftc.gov
Charting by Investing.com
Thus, as a bottom line, our long-term bullish view stands intact. We still suggest that gold stands in the beginning of long-term bullish cycle and most interesting things are just started. Geopolitical and economical uncertainty is not disappeared, and getting more momentum, tensions among global financial powers of US, EU and China rises as well.
Somehow I suggest that when US will finish with China - they turn to EU, trying to do the same. Not too far ago - they already stopped massive EU business extension in Iran by threatening of tariffs imposing. All big EU companies - Siemens, Daimler, MAN trucks, Renault, Total and others stopped their projects in Iran.
On next week, in shorter-term view, we expect upside continuation on a background of negative news in US/China soap opera. Middle East tensions will support gold demand as well. This fundamental news gives us fresh technical view as well and provides clarity on some scenarios that were dubious last week.
Technical
Monthly
As we've said above, we really have something interesting here, on technical picture. The clue stands on weekly chart, but even on monthly we have the hint - price reaction on major resistance and target. Although we keep our major plan here and still watch for major retracement, recent price action tells that retracement has not started yet. Which, in turn, means that gold probably should shows either W&R or new near-standing top before reversal.
Price doesn't go down and stands near the target. This is not the way how usually bearish reaction develops.
On a long-term view, area of major 5/8 Fib resistance level at 1585 and monthly Overbought, accompanied by butterfly extension create solid barrier on a way up. Thus, although XOP target probably will be reached some day, but now odds suggest retracement.
Thus, we still keep this area - 1530-1585 as tactical ceil at current moment and expect that gold will show healthy retracement out there by fundamental reasons that we've mentioned.
Butterfly target has been hit relatively fast. Pattern itself suggests 3/8 retracement as minimal target. Hardly butterfly will fail as it is accompanied by Overbought and major Fib resistance level.

Weekly
On weekly chart you could see the one that I call as "perfect trading setup". The complex of different kind data creates unique trading setup. First is fundamental background - unpriced China recede, the hot stage of Gold's bullish seasonal trend, as wedding period starts in Asia and India in particular and finally, technical background that we see here.
Last week we already suspected that we could get DiNapoli pattern here. And, finally this week we have a clarity. This week reversal provides us very important information. First is, this is a bullish grabber which suggests run above recent top. Uncompleted minor XOP target around 1570 provides us target. Thus, we could make a stake for ~55$/contract potential, which is just excellent.
As gold was not able to reach 3/8 Fib support level, B&B setup has not happened and the only DiNapoli pattern that still could be formed is DRPO "Sell", which agrees with current situation.
That's being said, our trading plan suggest taking long position next week with ~1566-1570 target against grabber's lows. Second stage for 1-2 weeks is to watch for W&R around 1570 top and appearing of DRPO "Sell" pattern, which, in turn, should trigger monthly retracement scenario.

Daily
That's how we foresee the failure of daily H&S pattern in advance. There will be a lot of screams "let me out" on gold market next week, among of those who doesn't understand yet what is going on and still take bets on downside action, based on H&S pattern here:

Intraday
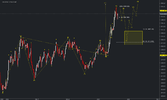
Here we need just plan how to take long position. Market is not at overbought on daily chart. Monday open could be strong, with gap up. Now it is difficult to suggest how precisely market will open...
On 4H chart we have another bullish signs - acceleration closer to the end of the session and W&R of the lows, instead of daily H&S neckline breakout. It seems that hardly we will get the fast chance to buy. The nearest resistance stands around 1530 area, including Fib level and WPR1. Let's hope that market will show some bounce out from there.

In general, we need to keep an eye on reaching some Fib support level. If it will be "222" Buy pattern - much better. Retracement should not be deep because this is first stage of upside reversal, market is not at overbought. Keep an eye on first two levels - now they are 1510 and 1505 K-support + WPP. The numbers could change once gold will climb higher, but the levels are the same. The control level is major 5/8. Now it stands at 1500. Although our absolute invalidation point is the weekly grabber's low - 1482, but 1500$ is starting point of Friday's thrust, and it will be not good if gold totally will erase it.

Conclusion
As our long-term bullish view as expectation of major retracement on monthly chart are still valid. On coming week we could take part in exciting trading setup that we have on weekly time frame and be involved in upside action first, then - in a process of market downside reversal within next 1-2 weeks.
The technical portion of Sive's analysis owes a great deal to Joe DiNapoli's methods, and uses a number of Joe's proprietary indicators. Please note that Sive's analysis is his own view of the market and is not endorsed by Joe DiNapoli or any related companies.
Yesterday in our FX report we've said that fundamental component is more interesting then technical one, but on gold market today is an opposite situation. On fundamental background we do not have something really new. There are three major components right now - reaction on Fed statement, US/China negotiations and Middle East tensions.
First driving factor is worked out already. Once J. Powell has announced the statement, gold has shown the same reaction as other markets across the board - minor dive on intraday charts due positive Fed view on US economy in general. But, initial drop was reversed relatively fast, as rate still was cut and some chances on another cut still stands on the table.
Middle East tensions around Aramco and Iran - Saudi Arabia relations has brought some support to gold, especially when D. Trump announced additional US troops contingent in S. Arabia to support ally.
As Reuters reports - Gold edged higher on Friday, heading for its first weekly rise in four, as investors focused on Middle East tensions while palladium hit a record peak on short supply.
“The jittery situation in the Middle East is one of the reasons to be concerned and switch to safe havens after disappointing knee-jerk reaction following the U.S. Federal Reserve rate cut,” said Commerzbank analyst Eugen Weinberg.
Adding to gold’s appeal, the United States said it was building a coalition to deter Iranian threats after last weekend’s attack on Saudi Arabian oil facilities.
Another supportive factor was the Fed’s second interest rate cut this year, though the central bank gave mixed signals on future cuts.
“(The) Global outlook still looks quite unfavourable and central banks around the globe will continue to ease monetary policy, which will be beneficial for gold,” said FXTM analyst Lukman Otunuga.
Lower interest rates reduce the opportunity cost of holding non-yielding bullion and weigh on the dollar, making gold cheaper for investors holding other currencies.
Finally, the major short-term driving factor is US/Sino tariffs negotiations which will drive the market in the beginning of the week. The recent news have not been priced-in yet and, as we suggest, they should push gold higher right on Monday.
Markets also focused on U.S.-China trade talks in Washington before high-level discussions next month. U.S. and Chinese deputy trade negotiators resumed face-to-face talks for the first time in nearly two months on Thursday.
But recent rumors tell that China delegation has stopped negotiations and leaved US without any explanations.
A U.S.-China trade deal appeared elusive on Friday after Chinese officials unexpectedly canceled a visit to farms in Montana and Nebraska as deputy trade negotiators wrapped up two days of negotiations in Washington.
This news have not been priced in by far and should push gold higher on Monday's open.
“Given potential upside catalysts (for gold) in the coming months, such as a dovish Fed and trade uncertainty, there is a risk that investors once again get left behind,” UBS analysts said in a note.
“Indicators suggest that market participants have reduced longs and are focusing on the $1,480 support area all the way down to $1,450 as attractive levels to re-engage.”
Indeed recent CFTC data shows that net long position steps out a bit from record high levels, supporting recent pullback on gold market. But this contraction doesn't show the signs of massive sell-off, stands gradual and mostly indicates long covering by short-term traders on retracement.
Source: cftc.gov
Charting by Investing.com
Thus, as a bottom line, our long-term bullish view stands intact. We still suggest that gold stands in the beginning of long-term bullish cycle and most interesting things are just started. Geopolitical and economical uncertainty is not disappeared, and getting more momentum, tensions among global financial powers of US, EU and China rises as well.
Somehow I suggest that when US will finish with China - they turn to EU, trying to do the same. Not too far ago - they already stopped massive EU business extension in Iran by threatening of tariffs imposing. All big EU companies - Siemens, Daimler, MAN trucks, Renault, Total and others stopped their projects in Iran.
On next week, in shorter-term view, we expect upside continuation on a background of negative news in US/China soap opera. Middle East tensions will support gold demand as well. This fundamental news gives us fresh technical view as well and provides clarity on some scenarios that were dubious last week.
Technical
Monthly
As we've said above, we really have something interesting here, on technical picture. The clue stands on weekly chart, but even on monthly we have the hint - price reaction on major resistance and target. Although we keep our major plan here and still watch for major retracement, recent price action tells that retracement has not started yet. Which, in turn, means that gold probably should shows either W&R or new near-standing top before reversal.
Price doesn't go down and stands near the target. This is not the way how usually bearish reaction develops.
On a long-term view, area of major 5/8 Fib resistance level at 1585 and monthly Overbought, accompanied by butterfly extension create solid barrier on a way up. Thus, although XOP target probably will be reached some day, but now odds suggest retracement.
Thus, we still keep this area - 1530-1585 as tactical ceil at current moment and expect that gold will show healthy retracement out there by fundamental reasons that we've mentioned.
Butterfly target has been hit relatively fast. Pattern itself suggests 3/8 retracement as minimal target. Hardly butterfly will fail as it is accompanied by Overbought and major Fib resistance level.
Weekly
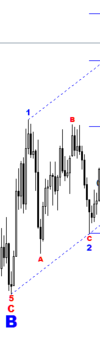
On weekly chart you could see the one that I call as "perfect trading setup". The complex of different kind data creates unique trading setup. First is fundamental background - unpriced China recede, the hot stage of Gold's bullish seasonal trend, as wedding period starts in Asia and India in particular and finally, technical background that we see here.
Last week we already suspected that we could get DiNapoli pattern here. And, finally this week we have a clarity. This week reversal provides us very important information. First is, this is a bullish grabber which suggests run above recent top. Uncompleted minor XOP target around 1570 provides us target. Thus, we could make a stake for ~55$/contract potential, which is just excellent.
As gold was not able to reach 3/8 Fib support level, B&B setup has not happened and the only DiNapoli pattern that still could be formed is DRPO "Sell", which agrees with current situation.
That's being said, our trading plan suggest taking long position next week with ~1566-1570 target against grabber's lows. Second stage for 1-2 weeks is to watch for W&R around 1570 top and appearing of DRPO "Sell" pattern, which, in turn, should trigger monthly retracement scenario.
Daily
That's how we foresee the failure of daily H&S pattern in advance. There will be a lot of screams "let me out" on gold market next week, among of those who doesn't understand yet what is going on and still take bets on downside action, based on H&S pattern here:
Intraday
Here we need just plan how to take long position. Market is not at overbought on daily chart. Monday open could be strong, with gap up. Now it is difficult to suggest how precisely market will open...
On 4H chart we have another bullish signs - acceleration closer to the end of the session and W&R of the lows, instead of daily H&S neckline breakout. It seems that hardly we will get the fast chance to buy. The nearest resistance stands around 1530 area, including Fib level and WPR1. Let's hope that market will show some bounce out from there.
In general, we need to keep an eye on reaching some Fib support level. If it will be "222" Buy pattern - much better. Retracement should not be deep because this is first stage of upside reversal, market is not at overbought. Keep an eye on first two levels - now they are 1510 and 1505 K-support + WPP. The numbers could change once gold will climb higher, but the levels are the same. The control level is major 5/8. Now it stands at 1500. Although our absolute invalidation point is the weekly grabber's low - 1482, but 1500$ is starting point of Friday's thrust, and it will be not good if gold totally will erase it.
Conclusion
As our long-term bullish view as expectation of major retracement on monthly chart are still valid. On coming week we could take part in exciting trading setup that we have on weekly time frame and be involved in upside action first, then - in a process of market downside reversal within next 1-2 weeks.
The technical portion of Sive's analysis owes a great deal to Joe DiNapoli's methods, and uses a number of Joe's proprietary indicators. Please note that Sive's analysis is his own view of the market and is not endorsed by Joe DiNapoli or any related companies.