Antony_NPBFX
NPBFX Representative (unconfirmed)
- Messages
- 1,093
Brent Crude Oil: general analysis 29.05.2019
Good afternoon, dear forum visitors!
NPBFX offers the latest release of analytics on Brent Crude Oil for a better understanding of the current market situation and more efficient trading.
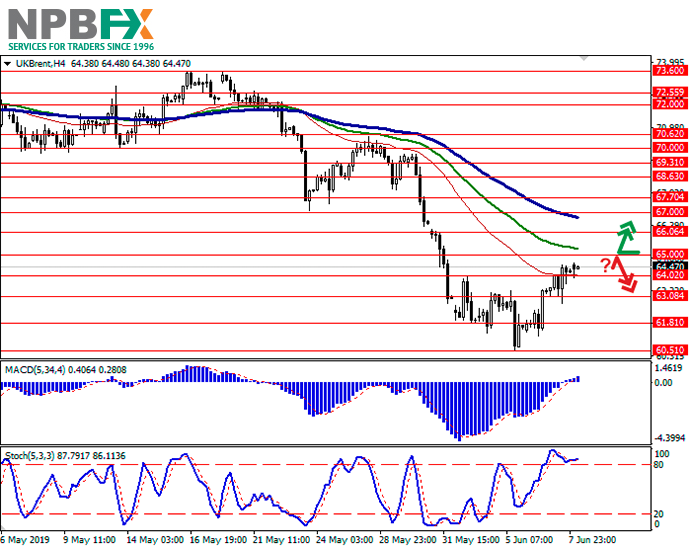
Current trend
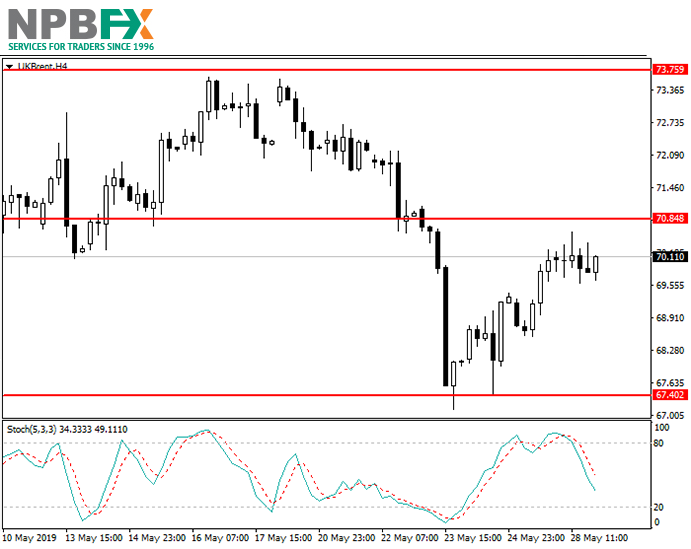
Oil is trading near the resistance level of 70.84.
At the moment, the risks of further reduction are high. Statistics on commercial oil reserves in the United States continues to grow due to the low refinery load, which is a negative signal for the course. Last week, the figure rose by 4.7 million barrels against the analysts' forecast of 0.6 million, and the total figure reached 476.8 million barrels, which is a record value over the past two years. Due to high reserves, the oil refining industry is also weakening: in the Middle West, the figure fell to 82.7%.
The second negative factor is the aggravation of the trade conflict between the United States and China. Last week, Donald Trump noted that he still hopes to settle all trade issues with Beijing, and the trade agreement is still possible. If the parties cannot agree, then the new list of Chinese companies will be added to the blacklist of the US Treasury.
On the other hand, the PRC and a number of other countries stated that they had completely stopped making direct purchases of “black gold” from Iran due to sanctions from the White House. Reducing the supply in the global market is a positive signal for the instrument and can significantly support the quotes.
Support and resistance
Stochastic is at the level of 34 and does not give signals for opening positions.
Resistance levels: 70.84, 71.80.
Support levels: 68.37, 67.40.
Trading tips
Long positions can be opened after the breakout of the level of 70.84 with the target at 71.80 and stop loss 70.00.
Use more opportunities of the NPBFX analytical portal: trading signals for commodities.
How can a trader determine if it’s worth buying or selling Brent Crude Oil now or better waiting for a more favorable period? Use trading signals for commodities from the top 10 technical indicators on the NPBFX portal and make the right decisions! All registered users have free and unlimited access to the minutely updated trading signals (MA10, BBands, Ichimoku, Stochastic, ZigZag, etc.) for Gold, Silver, Brent and WTI Crude oil.
If you have any questions about trading instruments, you can always ask an analyst in the online chat on the portal and get a free consultation of an experienced specialist.
Use the current recommendations of analysts on Brent Crude Oil and trade efficiently with NPBFX.
Good afternoon, dear forum visitors!
NPBFX offers the latest release of analytics on Brent Crude Oil for a better understanding of the current market situation and more efficient trading.
Current trend
Oil is trading near the resistance level of 70.84.
At the moment, the risks of further reduction are high. Statistics on commercial oil reserves in the United States continues to grow due to the low refinery load, which is a negative signal for the course. Last week, the figure rose by 4.7 million barrels against the analysts' forecast of 0.6 million, and the total figure reached 476.8 million barrels, which is a record value over the past two years. Due to high reserves, the oil refining industry is also weakening: in the Middle West, the figure fell to 82.7%.
The second negative factor is the aggravation of the trade conflict between the United States and China. Last week, Donald Trump noted that he still hopes to settle all trade issues with Beijing, and the trade agreement is still possible. If the parties cannot agree, then the new list of Chinese companies will be added to the blacklist of the US Treasury.
On the other hand, the PRC and a number of other countries stated that they had completely stopped making direct purchases of “black gold” from Iran due to sanctions from the White House. Reducing the supply in the global market is a positive signal for the instrument and can significantly support the quotes.
Support and resistance
Stochastic is at the level of 34 and does not give signals for opening positions.
Resistance levels: 70.84, 71.80.
Support levels: 68.37, 67.40.
Trading tips
Long positions can be opened after the breakout of the level of 70.84 with the target at 71.80 and stop loss 70.00.
Use more opportunities of the NPBFX analytical portal: trading signals for commodities.
How can a trader determine if it’s worth buying or selling Brent Crude Oil now or better waiting for a more favorable period? Use trading signals for commodities from the top 10 technical indicators on the NPBFX portal and make the right decisions! All registered users have free and unlimited access to the minutely updated trading signals (MA10, BBands, Ichimoku, Stochastic, ZigZag, etc.) for Gold, Silver, Brent and WTI Crude oil.
If you have any questions about trading instruments, you can always ask an analyst in the online chat on the portal and get a free consultation of an experienced specialist.
Use the current recommendations of analysts on Brent Crude Oil and trade efficiently with NPBFX.