NPBFX - making money with us since 1996!

EUR/USD: the euro is trying to keep growing 07.11.2022

Good afternoon, dear forum visitors!

NPBFX offers the latest release of analytics on EUR/USD for a better understanding of the current market situation and more efficient trading.

Current trend

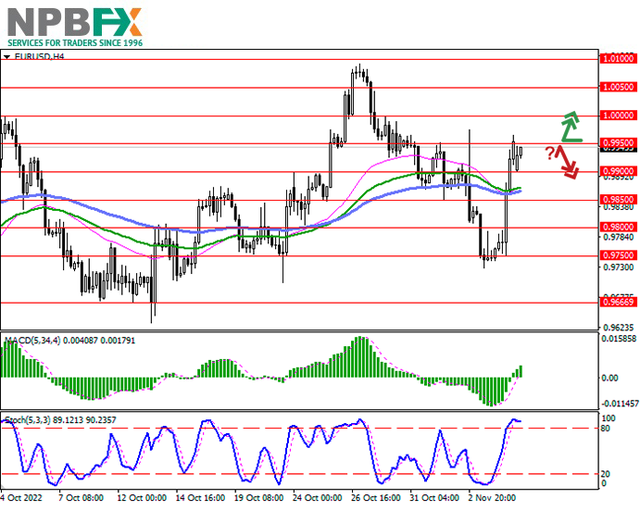
The European currency shows a weak growth, developing a strong "bullish" signal formed at the end of last week. The EUR/USD pair is testing 0.9940 for a breakout, trying to update Friday's local highs.

The instrument is significantly supported by the report on the US labor market for October, which reflected the growth in the number of Nonfarm Payrolls by 261.0 thousand against the expected increase by 200.0 thousand, while the September figure was adjusted from 263.0 thousand to 315.0 thousand. At the same time, the report indicated an increase in the Unemployment Rate in October from 3.5% to 3.7%, while the forecast was 3.6%. Thus, given the relatively optimistic situation on the labor market, investors strengthened their confidence that in the near future the US Federal Reserve may slow down the pace of interest rate increases. At the same time, there is no need to talk about any pause in the cycle of adjustments to the value yet, which was clearly reported by the Chair of the regulator, Jerome Powell, the day before.

In turn, moderate support for the euro last Friday was provided by macroeconomic statistics from Europe on business activity in the services sector from S&P Global. In October, the Services PMI in the euro area increased from 48.2 points to 48.6 points with neutral forecasts, and the Composite PMI in the Manufacturing sector over the same period corrected from 47.1 points to 47.3 points.

Last week it became known that after Russia sent additional volumes of gas to a pipeline branch in Turkey, the official representative of the President of the country, Ibrahim Kalyn, said that European countries can receive "blue fuel" through the Turkish hub, and the country is ready to make such a proposal already in the near future, which can help the European industry, which is experiencing a significant shortage of energy. In September, the EU Producer Price Index rose by only 1.6%, which led to a slowdown in the annual rate to 41.9% from 43.3%, and in October an even greater decline is expected, which indicates increased pressure on the industrial sector.

Support and resistance

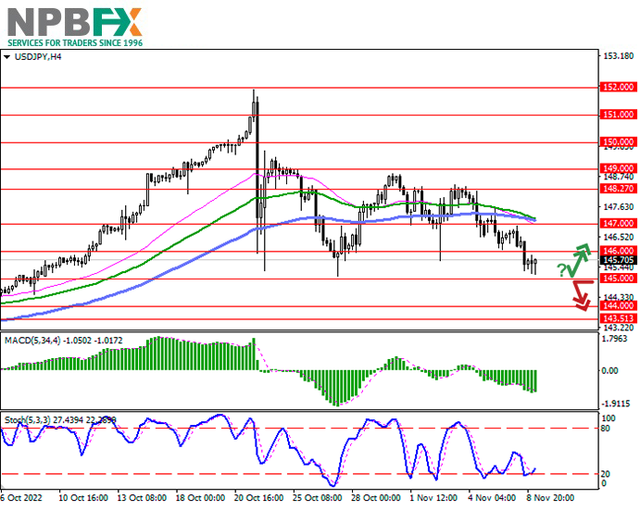
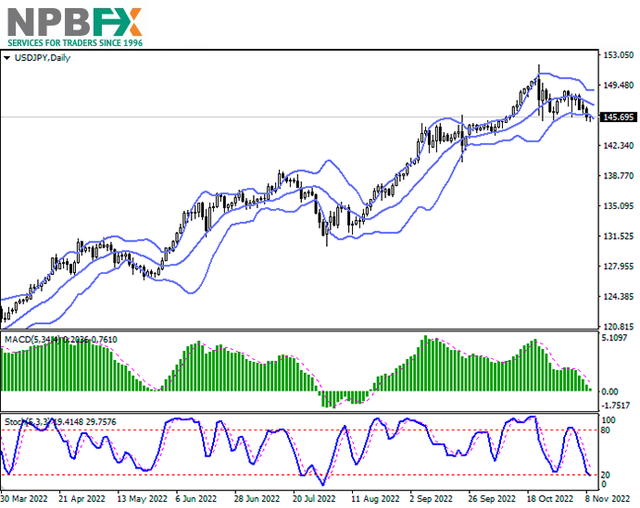
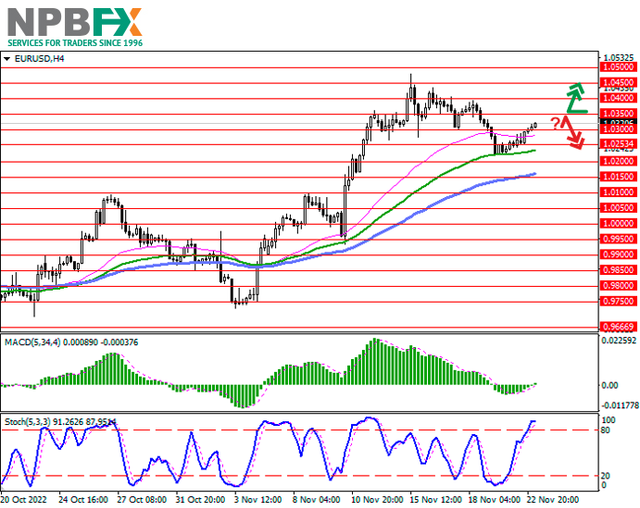
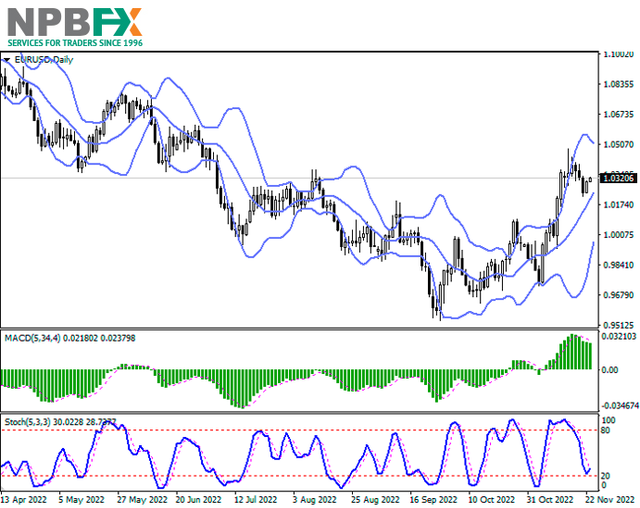
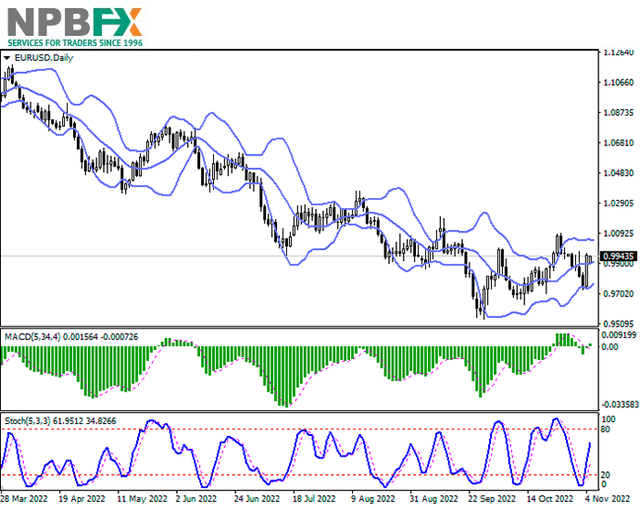
Bollinger Bands in D1 chart demonstrate flat dynamics. The price range is narrowing from below, reflecting the mixed dynamics of trading in the short term. MACD has reversed to growth having formed a new buy signal (located above the signal line). Stochastic is showing similar dynamics; however, the indicator line is already approaching its highs, indicating the risks of overbought euro in the ultra-short term.

Resistance levels: 0.9950, 1.0000, 1.0050, 1.0100.
Support levels: 0.9900, 0.9850, 0.9800, 0.9750.

eurusd-07112022-55.png


eurusd-07112022-66.png


Trading tips

Long positions can be opened after a breakout of 0.9950 with the target of 1.0050. Stop-loss — 0.9900. Implementation time: 2-3 days.

A rebound from 0.9950 as from resistance, followed by a breakdown of 0.9900 may become a signal for opening of new short positions with the target at 0.9800. Stop-loss — 0.9950.

Use more opportunities of the NPBFX analytical portal: E-book

If you just recently started to be interested in trading on FOREX and would like to deepen your knowledge, an electronic Beginner's Guide to FOREX Trading will be an excellent helper for you here. The book consists of 5 chapters and reflects fundamental concepts of the foreign exchange market to start successful trading. From the main chapters of the E-book you can learn about the concepts and history of FOREX, currencies and trend lines, technical indicators, types of orders, trading on news, psychology of trading, risk management and much more.

You can read a Beginner's guide to FOREX Trading online or download it free of charge from the NPBFX analytical portal in the "Education" section. In order to get unlimited access to the E-book and other useful instruments on the portal, you need to register on the NPBFX website.

If you have any questions about trading instruments, you can always ask an analyst in the online chat on the portal and get a free consultation of an experienced specialist.

Use the current recommendations of analysts on EUR/USD and trade efficiently with NPBFX.
 
USD/JPY: Bank of Japan intends to stick to the current course of monetary policy 09.11.2022

Good afternoon, dear forum visitors!

NPBFX offers the latest release of analytics on USD/JPY for a better understanding of the current market situation and more efficient trading.

Current trend

During the Asian session, the USD/JPY pair's dynamics are ambiguous, and it consolidates near 145.50 and local lows from October 27.

The US currency has been under pressure since the end of last week when a controversial report on the labor market was published, and investors again actively started talking about a possible easing of the US Federal Reserve's rhetoric. At the moment, the "bearish" activity in the dollar is decreasing ahead of the results of the midterm elections in the country, as well as against the backdrop of expectations for the publication of statistics on consumer inflation on Thursday: the currency may react positively to the victory of the Republicans, as they promise to pay more attention to domestic economic problems of the United States.

The macroeconomic statistics from Japan released on Wednesday do not significantly impact the dynamics of the trading instrument: the volume of bank lending in October rose by 2.7% after an increase of 2.3% last month against expectations of 2.5%. Eco Watchers current situation index increased from 48.4 points to 49.9 points, while analysts expected a decrease to 47.1 points, but the same agency's forecast for the same period fell from 49.2 points to 46 .4 points, contrary to the opinion of experts about the growth to 49.4 points.

In a summary of opinions published yesterday, the Bank of Japan stressed its commitment to the current monetary policy, which includes steps to slow inflation to the target value of 2.0%. Still, it noted the need to consider the impact of consumer price growth, which reached 3.0% in September for the first time in three decades, on the purchasing power of households, as companies prefer to pass their costs on to consumers. At the end of last month, the Japanese government presented a 199.0B dollars plan to help the population, including subsidizing utility bills and supplies of "black gold" to curb oil prices.

Support and resistance

On the daily chart, Bollinger bands are moderately declining. The price range is expanding from below but not as fast as the "bearish" activity develops. MACD is falling, keeping a strong sell signal (the histogram is below the signal line). Stochastic shows similar dynamics but is close to its lows, indicating that the dollar may become oversold in the nearest time intervals.

Resistance levels: 146.00, 147.00, 148.27, 149.00.
Support levels: 145.00, 144.00, 143.51, 142.54.

usdjpy-09112022-55.png


usdjpy-09112022-66.png


Trading tips

Short positions may be opened after the breakdown of 145.00 with the target at 143.51. Stop loss – 145.80. Implementation period: 1–2 days.

Long positions may be opened after a rebound from 145.00 and the breakout of 146.00 with the target at 148.00. Stop loss – 145.00.

Use more opportunities of the NPBFX analytical portal: weekly FOREX forecast

You can learn more about the current situation on Apple Inc. and get acquainted with the weekly analytical forecast in the "Video reviews" section on the NPBFX portal. Weekly video reviews contain trends, key levels, trading recommendations for such popular instruments as GBP/USD, EUR/USD, USD/CHF, AUD/USD. In order to get free and unlimited access to video forecast and other useful instruments on the portal, you need to register on the NPBFX website.

If you have any questions about trading instruments, you can always ask an analyst in the online chat on the portal and get a free consultation of an experienced specialist.

Use the current recommendations of analysts on USD/JPY and trade efficiently with NPBFX.
 
Meta Platforms Inc.: technical analysis 11.11.2022

Good afternoon, dear forum visitors!

NPBFX offers the latest release of analytics on Meta Platforms Inc. for a better understanding of the current market situation and more efficient trading.

The stocks of Meta Platforms Inc., the American multinational holding company that owns the technology conglomerate and the largest social networking site Facebook, continue to trade in a downtrend and are at 111.00.

On the daily chart, a global downtrend is forming, within which the price moves in a downward corridor with the boundaries of 85.00–130.00, reversing upwards after reaching the support line.

On the four-hour chart, it is clear that the prospects for growth will remain, but the instrument needs to work out the recent price gap that started from 122.00. In case of a reversal of quotes and a downward movement, the nearest support is the end of the gap, around 103.00.

Technical indicators confirm the likelihood of an upward correction: fast EMAs on the Alligator indicator are below the signal line, actively approaching it, and the AO oscillator histogram is forming upward bars in the sell zone.

meta-11112022-33.png


Trading tips

Long positions may be opened after the price rises and consolidates above 122.00 with the target at 154.00. Stop loss — 115.00. Implementation period: 7 days or more.

Short positions may be opened after a reversal, reduction, and consolidation of the price below 103.00 with the target at 88.00. Stop loss – 108.00.

Use more opportunities of the NPBFX analytical portal: analytics

You can find more actual analytical reviews on other popular currency pairs, metals and CFDs on the NPBFX online portal. Daily analytics with charts, current market prognoses and trading scenarios in the Feed section are available. Get free and unlimited access to the online portal after registering on the official website of NPBFX Company.

If you have any questions about trading instruments, you can always ask an analyst in the online chat on the portal and get a free consultation of an experienced specialist.

Use the current recommendations of analysts on Meta Platforms Inc. and trade efficiently with NPBFX.
 
AUD/USD: the instrument is showing correctional dynamics 14.11.2022

Good afternoon, dear forum visitors!

NPBFX offers the latest release of analytics on AUD/USD for a better understanding of the current market situation and more efficient trading.

Current trend

The Australian dollar is showing mixed trading dynamics, reversing downwards after a solid "bullish" rally last week. Against the backdrop of the publication of data on inflation in the US on Thursday, November 10, the Australian dollar showed steady growth, updating local highs from September 20. In October, the Consumer Price Index slowed down more than expected from 8.2% to 7.7%, which strengthened investors' confidence in the reduction in the pace of interest rate increases by the US Federal Reserve. At the moment, the vast majority of analysts expect only a 50 basis point correction in December, while before the release of the data this probability was estimated at only 50%.

Investor activity is likely to remain subdued today, as practically none noteworthy macroeconomic publications are planned. Tomorrow, the minutes of the meeting of the Reserve Bank of Australia are expected to be released, as well as a block of statistics from China, where, among other things, October data on the dynamics of Industrial Production and Retail Sales will be published. Current forecasts suggest that production will slow down from 6.3% to 5.2% and sales will decline from 2.5% to 1.0%.

Support and resistance

Bollinger Bands in D1 chart show active growth. The price range is expanding but it fails to conform to the surge of "bullish" sentiments at the moment. MACD grows, preserving a stable buy signal (located above the signal line). Stochastic resumed active growth at the end of last week, but at the moment it is again near its highs, indicating the risks of the Australian dollar being overbought in the ultra-short term.

Resistance levels: 0.6715, 0.6750, 0.6800, 0.6853.
Support levels: 0.6650, 0.6572, 0.6520, 0.6450.

AUDUSD141122-33.png


AUDUSD141122-333.png


Trading tips

Long positions can be opened after a breakout of 0.6715 with the target of 0.6853. Stop-loss — 0.6650. Implementation time: 2-3 days.

A rebound from 0.6715 as from resistance, followed by a breakdown of 0.6650 may become a signal for opening of new short positions with the target at 0.6520. Stop-loss — 0.6715.

Use more opportunities of the NPBFX analytical portal: glossary

Beginning traders certainly face a lot of specialized concepts and lexicon on FOREX, which are often not fully been understood. Swap, tick, hedge, margin calls are often unfamiliar to beginning traders. But the lack of knowledge of these fundamentals make a competent market vision impossible. So glossary on the NPBFX analytical portal could be an excellent helper in this case, which contains all the main definitions with explanations in a compact and accessible form. All concepts are arranged in alphabetical order, so that you can easily and quickly find and explore a new concept for yourself.

If you have any questions about trading instruments, you can always ask an analyst in the online chat on the portal and get a free consultation of an experienced specialist.

Use the current recommendations of analysts on AUD/USD and trade efficiently with NPBFX.
 
Exxon Mobil Corp.: technical analysis 16.11.2022

Good afternoon, dear forum visitors!

NPBFX offers the latest release of analytics on Exxon Mobil Corp. for a better understanding of the current market situation and more efficient trading.

The shares of ExxonMobil Corp., a US oil company, are rising within an uptrend, trading near 114.00.

A global uptrend is forming on the daily chart, which is a consequence of implementing the global Triangle pattern with an upper border around 96.00.

On the four-hour chart, it is clear that the current growth has high prospects for continuation since the main target for the pattern around 120.00 has not yet been worked out. Given the structure of the current wave, it is obvious that after a local correction to 108.00, the quotes reversed and formed a new upward impulse.

Technical indicators strengthen the buy signal: fast EMAs on the Alligator indicator expand the range of fluctuations, and the AO oscillator histogram forms bars in the buy zone.

XOM161122-22.png


Trading tips

Long positions may be opened after the price rises and consolidates above 115.00 with the target at 120.00. Stop loss – 112.00. Implementation period: 7 days or more.

Short positions may be opened after a reversal, reduction, and consolidation of the price below 108.80 with the target at 102.00. Stop loss – 101.00.

Use more opportunities of the NPBFX analytical portal: analytics

You can find more actual analytical reviews on other popular currency pairs, metals and CFDs on the NPBFX online portal. Daily analytics with charts, current market prognoses and trading scenarios in the Feed section are available. Get free and unlimited access to the online portal after registering on the official website of NPBFX Company.

If you have any questions about trading instruments, you can always ask an analyst in the online chat on the portal and get a free consultation of an experienced specialist.

Use the current recommendations of analysts on Exxon Mobil Corp. and trade efficiently with NPBFX.
 
Alibaba Group Holdings Ltd.: technical analysis 18.11.2022

Good afternoon, dear forum visitors!

NPBFX offers the latest release of analytics on Alibaba Group Holdings Ltd. for a better understanding of the current market situation and more efficient trading.

Shares of Alibaba Group Holdings Ltd., one of the world's largest e-commerce companies, correct at 84.00.

On the daily chart, the price has left the narrow downwards channel with dynamic boundaries of 40.00–75.00 and consolidated above the initial correction of 23.6% Fibonacci around 77.00.

The four-hour chart shows that the uptrend has a high potential to continue, and the rate of price growth may increase if it consolidates above the 38.2% Fibonacci base retracement at 86.00, after which the next resistance will be the full retracement level at 61.8% Fibonacci at 101.50. The reverse decline will be capped by the low of the year at 62.00.

Technical indicators keep a buy signal: fast EMAs on the Alligator indicator are actively moving away from the signal line, and the AO oscillator histogram forms upward bars, moving into the buy zone.

BABA-181122-11.png


Trading tips

Long positions may be opened after the price rises and consolidates above 86.00 with the target at 101.50. Stop loss — 80.00. Implementation period: 7 days or more.

Short positions may be opened after a reversal, reduction and consolidation of the price below 77.00 with the target at 62.00. Stop loss — 83.00.

Use more opportunities of the NPBFX analytical portal: glossary

Beginning traders certainly face a lot of specialized concepts and lexicon on FOREX, which are often not fully been understood. Swap, tick, hedge, margin calls are often unfamiliar to beginning traders. But the lack of knowledge of these fundamentals make a competent market vision impossible. So glossary on the NPBFX analytical portal could be an excellent helper in this case, which contains all the main definitions with explanations in a compact and accessible form. All concepts are arranged in alphabetical order, so that you can easily and quickly find and explore a new concept for yourself.

If you have any questions about trading instruments, you can always ask an analyst in the online chat on the portal and get a free consultation of an experienced specialist.

Use the current recommendations of analysts on Alibaba Group Holdings Ltd. and trade efficiently with NPBFX.
 
Starbucks Corp.: technical analysis 21.11.2022

Good afternoon, dear forum visitors!

NPBFX offers the latest release of analytics on Starbucks Corp. for a better understanding of the current market situation and more efficient trading.

Shares of Starbucks Corp., one of the largest companies in the world, which owns the chain of coffee houses of the same name, are moving within a corrective trend around 98.00.

On the daily chart, the price is near the resistance line of the global correctional channel with dynamic boundaries 85.00–100.00, getting ready to break it.

On the four-hour chart, the range resistance line coincides with the Fibonacci 61.8% full retracement level at 99.50, consolidation above, which means the correction will enter the trend stage, indicating a new global target at 106.60. The quotes decline looks unlikely, but it will become possible if the trading instrument consolidates below an intermediate correction of 50.0% Fibonacci around 93.80.

Technical indicators maintain a stable buy signal: fast EMAs on the Alligator indicator expand the range of fluctuations, moving away from the signal line, and the AO oscillator histogram forms upward bars in the buying zone.

SBUX-211122-22.png


Trading tips

Long positions may be opened after the price rises and consolidates above 99.50 with the target at 106.60. Stop loss — 95.00. Implementation period: 7 days or more.

Short positions may be opened after a reversal, reduction, and consolidation of the price below 93.80 with the target at 88.40. Stop loss — 96.00.

Use more opportunities of the NPBFX analytical portal: E-book

If you just recently started to be interested in trading on FOREX and would like to deepen your knowledge, an electronic Beginner's Guide to FOREX Trading will be an excellent helper for you here. The book consists of 5 chapters and reflects fundamental concepts of the foreign exchange market to start successful trading. From the main chapters of the E-book you can learn about the concepts and history of FOREX, currencies and trend lines, technical indicators, types of orders, trading on news, psychology of trading, risk management and much more.

You can read a Beginner's guide to FOREX Trading online or download it free of charge from the NPBFX analytical portal in the "Education" section. In order to get unlimited access to the E-book and other useful instruments on the portal, you need to register on the NPBFX website.

If you have any questions about trading instruments, you can always ask an analyst in the online chat on the portal and get a free consultation of an experienced specialist.

Use the current recommendations of analysts on Starbucks Corp. and trade efficiently with NPBFX.
 
EUR/USD: the euro is trying to reverse into corrective growth 23.11.2022

Good afternoon, dear forum visitors!

NPBFX offers the latest release of analytics on EUR/USD for a better understanding of the current market situation and more efficient trading.

Current trend

The European currency shows flat dynamics, testing the level of 1.0310 for a breakout. Traders are in no hurry to open new positions in anticipation of today's publication of the minutes of the US Federal Reserve meeting, which may clarify the prospects for the regulator's monetary policy.

At the moment, forecasts suggest that the interest rate will be raised by 50 basis points in December, but the Fed is unlikely to stop there. Representatives of the US Federal Reserve generally agree that it is premature to talk about the imminent end of the monetary policy tightening cycle. In particular, Loretta Meister and Mary Daly made "hawkish" comments the day before, also noting that the rate of the rate hike may be reduced in the future. An increase in interest rates by 50 basis points is expected in December from the European Central Bank (ECB), and unlike the US Federal Reserve, the European regulator has to act much more cautiously, due to the proximity of the region's economy to recession.

The focus of investors today will be statistics on business activity from S&P Global for November. Current forecasts suggest that the S&P Global Manufacturing PMI will decline from 47.3 points to 47.0 points, and the Services PMI may decline from 48.6 points to 48.0 points.

Also yesterday it became known that the authorities of the European Union proposed to slightly change the key provisions on limiting prices for the supply of Russian "black gold", as well as provide for a phased 45-day transition to the new rules. According to Bloomberg, it will affect oil loaded before the date of entry into force of sanctions on December 5 and unloaded before January 19. It is expected that the price ceiling will be set in the region of 40.0-60.0 dollars per barrel, but even now the initiative is causing controversy among representatives of the countries of the bloc: in particular, France is in favor of these measures, while Germany is against it. If EU leaders approve the new pricing scheme, it will come into effect from January 1, 2023.

Support and resistance

Bollinger Bands on the daily chart show a steady increase. The price range is narrowing, reflecting the emergence of ambiguous dynamics of trading in the short term. MACD is falling, keeping a relatively strong sell signal (the histogram is below the signal line). Stochastic, which has rebounded from the level of "20", is trying to reverse upwards, signaling in favor of the development of corrective growth in the near future.

Resistance levels: 1.0350, 1.0400, 1.0450, 1.0500.
Support levels: 1.0300, 1.0253, 1.0200, 1.0150.

EURUSD-231122-33.png


EURUSD-231122-333.png


Trading tips

Long positions can be opened after a breakout of 1.0350 with the target of 1.0450. Stop-loss — 1.0300. Implementation time: 2-3 days.

A rebound from 1.0350 as from resistance, followed by a breakdown of 1.0300 may become a signal for opening of new short positions with the target at 1.0200. Stop-loss — 1.0350.

Use more opportunities of the NPBFX analytical portal: analytics

You can find more actual analytical reviews on other popular currency pairs, metals and CFDs on the NPBFX online portal. Daily analytics with charts, current market prognoses and trading scenarios in the Feed section are available. Get free and unlimited access to the online portal after registering on the official website of NPBFX Company.

If you have any questions about trading instruments, you can always ask an analyst in the online chat on the portal and get a free consultation of an experienced specialist.

Use the current recommendations of analysts on EUR/USD and trade efficiently with NPBFX.
 
Bank of America Corp.: technical analysis 25.11.2022

Good afternoon, dear forum visitors!

NPBFX offers the latest release of analytics on Bank of America Corp. for a better understanding of the current market situation and more efficient trading.

Shares of Bank of America Corp., the largest financial conglomerate in the US, are moving within the corrective trend around 37.00.

On the daily chart, the price managed to consolidate above the resistance line of the descending corridor with the boundaries of 28.00–36.00 and is now trying to stay above the 38.2% Fibonacci retracement level of 37.10.

On a four-hour timeframe, it can be seen that overcoming this level will become a catalyst for the movement of the quotes of the trading instrument towards two goals: the level of an intermediate correction of 50.0% at 39.60 and the level of a full correction of 61.8% at 42.00.

Technical indicators maintain a global buy signal, working out the local correction: fast EMAs on the Alligator indicator are above the signal line, and the AO oscillator histogram is forming new bars trading in the buy zone.

BAC-251122-11.png


Trading tips

Long positions should be opened after the price consolidates above the local resistance of 38.50 with the target of 42.00. Stop-loss — 36.00. Implementation time: 7 days and more.

Short positions can be opened after the price consolidates below the support level of 37.00 with the target of 34.20. Stop-loss can be set above the local support at 39.00.

Use more opportunities of the NPBFX analytical portal: E-book

If you just recently started to be interested in trading on FOREX and would like to deepen your knowledge, an electronic Beginner's Guide to FOREX Trading will be an excellent helper for you here. The book consists of 5 chapters and reflects fundamental concepts of the foreign exchange market to start successful trading. From the main chapters of the E-book you can learn about the concepts and history of FOREX, currencies and trend lines, technical indicators, types of orders, trading on news, psychology of trading, risk management and much more.

You can read a Beginner's guide to FOREX Trading online or download it free of charge from the NPBFX analytical portal in the "Education" section. In order to get unlimited access to the E-book and other useful instruments on the portal, you need to register on the NPBFX website.

If you have any questions about trading instruments, you can always ask an analyst in the online chat on the portal and get a free consultation of an experienced specialist.

Use the current recommendations of analysts on Bank of America Corp. and trade efficiently with NPBFX.
 
The Walt Disney Co.: technical analysis 28.11.2022

Good afternoon, dear forum visitors!

NPBFX offers the latest release of analytics on The Walt Disney Co. for a better understanding of the current market situation and more efficient trading.

Shares of The Walt Disney Co., one of the leaders in the global entertainment industry, are moving in a corrective trend around 99.00.

On the daily chart, the price is within the global Triangle pattern with dynamic boundaries 102.00–85.00 and narrows the range of fluctuations, approaching the resistance line at 101.00.

On the four-hour chart, the asset has already entered the last third of the pattern, which is one of the signs of an imminent exit from it. A possible reversal is also indicated by the quotes reaching its upper limit at 100.00, which was accompanied by a significant drop in trading volumes.

Technical indicators have significantly narrowed the fluctuation range: fast EMAs on the Alligator indicator are still below the signal line, and the AO oscillator histogram remains in the sell zone.

DIS281122-11.png


Trading tips

Short positions may be opened after the price drops and consolidates below 95.00 with the target at 86.50. Stop loss – 100.00. Implementation period: 7 days or more.

Long positions may be opened after the price rises and consolidates above 101.50 with the target at 113.00. Stop loss – 96.00.

Use more opportunities of the NPBFX analytical portal: glossary

Beginning traders certainly face a lot of specialized concepts and lexicon on FOREX, which are often not fully been understood. Swap, tick, hedge, margin calls are often unfamiliar to beginning traders. But the lack of knowledge of these fundamentals make a competent market vision impossible. So glossary on the NPBFX analytical portal could be an excellent helper in this case, which contains all the main definitions with explanations in a compact and accessible form. All concepts are arranged in alphabetical order, so that you can easily and quickly find and explore a new concept for yourself.

If you have any questions about trading instruments, you can always ask an analyst in the online chat on the portal and get a free consultation of an experienced specialist.

Use the current recommendations of analysts on The Walt Disney Co. and trade efficiently with NPBFX.
 
Back
Top