NPBFX - making money with us since 1996!

AUD/USD: the instrument is consolidating near 0.6650 27.03.2023

Good afternoon, dear forum visitors!

NPBFX offers the latest release of analytics on AUD/USD for a better understanding of the current market situation and more efficient trading.

Current trend

The AUD/USD pair shows a slight increase, trading around 0.6654. Last Friday, the instrument showed a rather active decline, returning to the previous local lows of March 16, and the reason for the appearance of corrective dynamics in the US currency was the March macroeconomic statistics on business activity in the US manufacturing and services sectors. In addition, the technical factors of fixing long positions in the asset played in favor of the American dollar.

In turn, the macroeconomic statistics on Australian business activity indices turned out to be weak. The Services PMI from Commonwealth Bank in March adjusted from 50.7 points to 48.2 points, while analysts expected a decrease to 49.9 points, the Manufacturing PMI corrected from 50.5 points to 48.7 points with a forecast of deceleration to 50.3 points, and the Composite PMI declined from 50.6 points to 48.1 points. On Tuesday, investors will evaluate the February data on the dynamics of Retail Sales, assuming a possible slowdown in the figure from 1.9% to 0.4%. Also on this day, Luci Ellis, the chief economic advisor to the Governor of the Reserve Bank of Australia (RBA), will make a speech.

Support and resistance

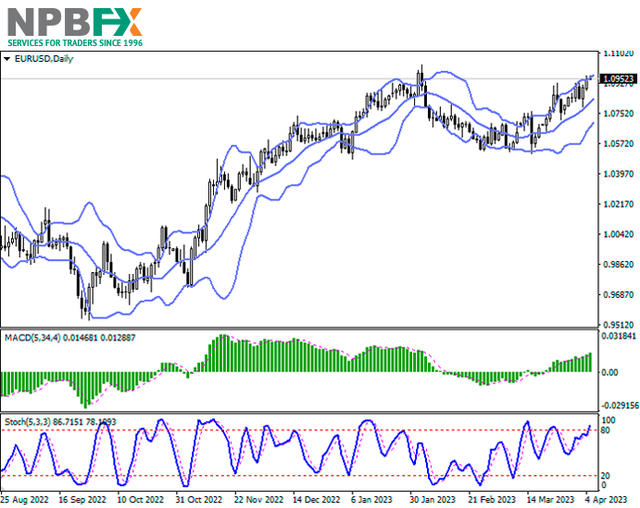
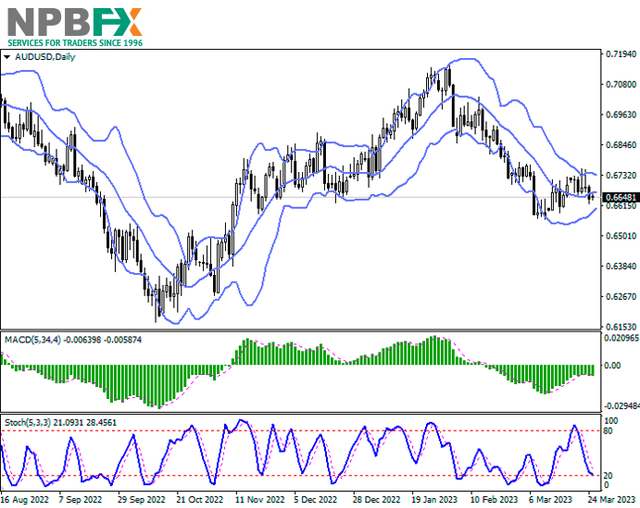
Bollinger Bands on the daily chart show flat dynamics. The price range is narrowing, reflecting mixed trading in the short term. MACD reversed downwards having formed a weak sell signal (located below the signal line). Stochastic shows a more confident decline, but at the moment it is rapidly approaching its lows, indicating risks of the British currency being oversold in the near future.

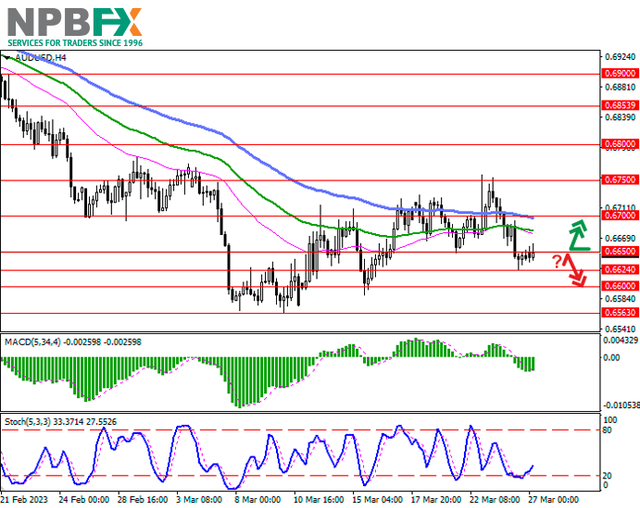
Resistance levels: 0.6650, 0.6700, 0.6750, 0.6800.
Support levels: 0.6624, 0.6600, 0.6563, 0.6500.

AUDUSD270323-33.png


AUDUSD270323-333.png


Trading tips

Long positions can be opened after a breakout of 0.6650 with the target of 0.6750. Stop-loss — 0.6600. Implementation time: 2-3 days.

A rebound from 0.6650 as from resistance, followed by a breakdown of 0.6624 may become a signal for opening of new short positions with the target at 0.6563. Stop-loss — 0.6660.

Use more opportunities of the NPBFX analytical portal: analytics

You can find more actual analytical reviews on other popular currency pairs, metals and CFDs on the NPBFX online portal. Daily analytics with charts, current market prognoses and trading scenarios in the Feed section are available. Get free and unlimited access to the online portal after registering on the official website of NPBFX Company.

If you have any questions about trading instruments, you can always ask an analyst in the online chat on the portal and get a free consultation of an experienced specialist.

Use the current recommendations of analysts on AUD/USD and trade efficiently with NPBFX.
 
Hewlett-Packard Co.: technical analysis 29.03.2023

Good afternoon, dear forum visitors!

NPBFX offers the latest release of analytics on Hewlett-Packard Co. for a better understanding of the current market situation and more efficient trading.

The shares of Hewlett-Packard Co., the US IT giant, are on a corrective trend at 27.60.

On the daily chart, the price is holding within the global Triangle pattern with dynamically narrowing boundaries of 27.00–31.00, reaching its support line.

On the four-hour chart, it can be seen that if the local low of March 13 at 27.00 is broken, the main signal will be received for further decline along the resistance line of the global downtrend on the weekly chart. If kept, the quotes may return to the middle of the formation at 29.00.

Technical indicators keep a sell signal: fast EMAs on the Alligator indicator move away from the signal line, and the AO histogram forms new bars, falling in the sell zone.

HPQ290323-11.png


Trading tips

Short positions may be opened after the price drops and consolidates below 27.00 with the target at 25.00. Stop loss — 28.00. Implementation period: 7 days or more.

Long positions may be opened after a reversal, growth, and consolidation of the price above 29.00 with the target at 31.00. Stop loss — 28.00.

Use more opportunities of the NPBFX analytical portal: E-book

If you just recently started to be interested in trading on FOREX and would like to deepen your knowledge, an electronic Beginner's Guide to FOREX Trading will be an excellent helper for you here. The book consists of 5 chapters and reflects fundamental concepts of the foreign exchange market to start successful trading. From the main chapters of the E-book you can learn about the concepts and history of FOREX, currencies and trend lines, technical indicators, types of orders, trading on news, psychology of trading, risk management and much more.

You can read a Beginner's guide to FOREX Trading online or download it free of charge from the NPBFX analytical portal in the "Education" section. In order to get unlimited access to the E-book and other useful instruments on the portal, you need to register on the NPBFX website.

If you have any questions about trading instruments, you can always ask an analyst in the online chat on the portal and get a free consultation of an experienced specialist.

Use the current recommendations of analysts on Hewlett-Packard Co. and trade efficiently with NPBFX.
 
General Electric Co.: technical analysis 31.03.2023

Good afternoon, dear forum visitors!

NPBFX offers the latest release of analytics on General Electric Co. for a better understanding of the current market situation and more efficient trading.

The shares of General Electric Co., an American diversified corporation, added value, trading at 94.00.

On the daily chart, the price is moving within the global ascending channel with dynamic boundaries of 96.00–73.00, holding near the resistance line.

On the four-hour chart, the upward movement has almost exhausted, as evidenced by the numerous unsuccessful attempts by the price to consolidate above the resistance line of 95.00, if it is broken, there will be practically no doubts about the subsequent reaching of 101.00.

Technical indicators signal a decrease in the trend's strength: fast EMAs on the Alligator indicator began to approach the signal line, narrowing the fluctuation range, and the AO histogram forms corrective bars in the buying zone.

GE-310323-11.png


Trading tips

Short positions may be opened after a reversal, reduction, and consolidation of the price below 90.00 with the target at 81.00. Stop loss – 94.00. Implementation period: 7 days or more.

Long positions may be opened after the price rises and consolidates above 95.00 with the target at 101.00. Stop loss – 92.00.

Use more opportunities of the NPBFX analytical portal: weekly FOREX forecast

You can learn more about the current situation and get acquainted with the weekly analytical forecast in the "Video reviews" section on the NPBFX portal. Weekly video reviews contain trends, key levels, trading recommendations for such popular instruments as GBP/USD, EUR/USD, USD/CHF, AUD/USD. In order to get free and unlimited access to video forecast and other useful instruments on the portal, you need to register on the NPBFX website.

If you have any questions about trading instruments, you can always ask an analyst in the online chat on the portal and get a free consultation of an experienced specialist.

Use the current recommendations of analysts on General Electric Co. and trade efficiently with NPBFX.
 
The Walt Disney Co.: technical analysis 03.04.2023

Good afternoon, dear forum visitors!

NPBFX offers the latest release of analytics on The Walt Disney Co. for a better understanding of the current market situation and more efficient trading.

Shares of The Walt Disney Co., one of the leaders in the global entertainment industry, are moving in a corrective trend at 100.00.

On the daily chart, the price is holding in the global downward corridor with dynamic boundaries 113.00–76.00, and at the moment the downward wave is reaching the middle of the range.

On the four-hour chart, the upward correction is growing, which is signaled by the Head and shoulders pattern that started to materialize, the Neckline of which was passed around 97.00. The target of the movement is 109.00, after reaching which a reversal and further decline is possible.

Technical indicators are preparing for a reversal: fast EMAs on the Alligator indicator are narrowing their range of fluctuations and are actively approaching the signal line, while the AO histogram is forming rising bars.

DIS-030423-11.png


Trading tips

Long positions may be opened after a reversal, growth, and price consolidation above 102.50 with the target at 109.00. Stop loss – 100.00. Implementation period: 7 days or more.

Short positions may be opened after the price drops and consolidates below 97.00 with the target at 90.40. Stop loss – 100.00.

Use more opportunities of the NPBFX analytical portal: analytics

You can find more actual analytical reviews on other popular currency pairs, metals and CFDs on the NPBFX online portal. Daily analytics with charts, current market prognoses and trading scenarios in the Feed section are available. Get free and unlimited access to the online portal after registering on the official website of NPBFX Company.

If you have any questions about trading instruments, you can always ask an analyst in the online chat on the portal and get a free consultation of an experienced specialist.

Use the current recommendations of analysts on The Walt Disney Co. and trade efficiently with NPBFX.
 
EUR/USD: the uptrend against the background of positive statistics 05.04.2023

Good afternoon, dear forum visitors!

NPBFX offers the latest release of analytics on EUR/USD for a better understanding of the current market situation and more efficient trading.

Current trend

The EUR/USD pair shows a slight increase, consolidating near 1.0950. "Bullish" dynamics is weakening in the middle of the week, but the euro is still held near the local highs of February 2.

Support for quotes, in addition to technical factors, is provided by macroeconomic statistics from Europe, which allows investors to hope that fears of a protracted recession in the region will not come true. The day before in Germany the February data on the balance of foreign trade were published: Exports accelerated from 2.5% to 4.0%, while analysts expected a slowdown to 1.4%, and Imports added 4.6% after -1.4 % in the previous month with a forecast of growth of 1.3%. The Trade Surplus remained unchanged at 16.0 billion euros, which was slightly lower than the expected increase to 17.0 billion euros. In turn, the Producer Price Index in the euro area in February fell by 0.5% after falling by 2.8% a month earlier, while analysts had expected a decline of 0.3%, and in annual terms, the figure slowed down from 15.1% to 13.2% with the forecast of 13.5%.

The focus of investors is the February statistics from Germany on the dynamics of Factory Orders. In addition, during the day there will be data from S&P Global on the level of business activity in the eurozone services sector for March.

Support and resistance

Bollinger Bands on the daily chart show a steady increase. The price range is narrowing, limiting the development of "bullish" trend in the short term. MACD grows, preserving a stable buy signal (located above the signal line). Stochastic retains an uptrend, but is located in close proximity to its highs, which points to the risk of overbought euro in the ultra-short term.

Resistance levels: 1.0957, 1.1000, 1.1051, 1.1100.
Support levels: 1.0900, 1.0850, 1.0800, 1.0758.

EURUSD050423-33.png


EURUSD050423-333.png


Trading tips

Long positions can be opened after a breakout of 1.1000 with the target of 1.1100. Stop-loss — 1.0957. Implementation time: 2-3 days.

A rebound from 1.0957 as from resistance, followed by a breakdown of 1.0900 may become a signal for opening of new short positions with the target at 1.0800. Stop-loss — 1.0957.

Use more opportunities of the NPBFX analytical portal: E-book

If you just recently started to be interested in trading on FOREX and would like to deepen your knowledge, an electronic Beginner's Guide to FOREX Trading will be an excellent helper for you here. The book consists of 5 chapters and reflects fundamental concepts of the foreign exchange market to start successful trading. From the main chapters of the E-book you can learn about the concepts and history of FOREX, currencies and trend lines, technical indicators, types of orders, trading on news, psychology of trading, risk management and much more.

You can read a Beginner's guide to FOREX Trading online or download it free of charge from the NPBFX analytical portal in the "Education" section. In order to get unlimited access to the E-book and other useful instruments on the portal, you need to register on the NPBFX website.

If you have any questions about trading instruments, you can always ask an analyst in the online chat on the portal and get a free consultation of an experienced specialist.

Use the current recommendations of analysts on EUR/USD and trade efficiently with NPBFX.
 
Cisco Systems Inc.: technical analysis 07.04.2023

Good afternoon, dear forum visitors!

NPBFX offers the latest release of analytics on Cisco Systems Inc. for a better understanding of the current market situation and more efficient trading.

Shares of Cisco Systems Inc., an American manufacturer and supplier of network equipment for large holdings and telecommunications companies, are correcting at 51.26.

On the daily chart, the formation of the second Shoulder of the global Head and shoulders pattern with the Neckline near 52.50 is nearing completion.

On the four-hour chart, it is clear that the quotes have reached the Neck level three times but could not cross it. Now, there is another attempt, and if successful, the price may rise to 55.00. The situation is unclear for the "bears," and even if the trading instrument consolidates below the low of 50.00, a long decline is not guaranteed.

Technical indicators keep a local buy signal: fast EMAs on the Alligator indicator are above the signal line, and the AO histogram forms corrective bars in the buying zone.

CSCO070423-11.png


Trading tips

Long positions may be opened after the price rises and consolidates above 52.30, with the target at 55.00. Stop loss – 51.50. Implementation period: 7 days or more.

Short positions may be opened after a reversal, reduction, and consolidation of the price below 50.50, with the target at 48.10. Stop loss – 51.50.

Use more opportunities of the NPBFX analytical portal: weekly FOREX forecast

You can learn more about the current situation and get acquainted with the weekly analytical forecast in the "Video reviews" section on the NPBFX portal. Weekly video reviews contain trends, key levels, trading recommendations for such popular instruments as GBP/USD, EUR/USD, USD/CHF, AUD/USD. In order to get free and unlimited access to video forecast and other useful instruments on the portal, you need to register on the NPBFX website.

If you have any questions about trading instruments, you can always ask an analyst in the online chat on the portal and get a free consultation of an experienced specialist.

Use the current recommendations of analysts on Cisco Systems Inc. and trade efficiently with NPBFX.
 
Hewlett-Packard Co.: technical analysis 10.04.2023

Good afternoon, dear forum visitors!

NPBFX offers the latest release of analytics on Hewlett-Packard Co. for a better understanding of the current market situation and more efficient trading.

Shares of Hewlett-Packard Co., the American information technology giant, are trading within a corrective trend at 29.30.

On the daily chart, the price is moving within the Triangle pattern with dynamically narrowing boundaries of 27.00–31.00, approaching its resistance line.

On the four-hour chart, it is clear that the breakout of the local high of April 4 at 30.00 allows the opening of long positions with the target at 32.00. Otherwise, the quotes will retreat to the lower border of the formation around 27.00.

Technical indicators keep a buy signal: fast EMAs on the Alligator indicator move away from the signal line, and the AO histogram forms new bars, rising in the buying zone.

HPQ-100423-11.png


Trading tips

Long positions may be opened after the price rises and consolidates above 30.00, with the target at 32.00. Stop loss — 29.00. Implementation period: 7 days or more.

Short positions may be opened after a reversal, reduction, and consolidation of the price below 28.50, with the target at 26.80. Stop loss – 29.30.

Use more opportunities of the NPBFX analytical portal: analytics

You can find more actual analytical reviews on other popular currency pairs, metals and CFDs on the NPBFX online portal. Daily analytics with charts, current market prognoses and trading scenarios in the Feed section are available. Get free and unlimited access to the online portal after registering on the official website of NPBFX Company.

If you have any questions about trading instruments, you can always ask an analyst in the online chat on the portal and get a free consultation of an experienced specialist.

Use the current recommendations of analysts on Hewlett-Packard Co. and trade efficiently with NPBFX.
 
Starbucks Corp.: technical analysis 12.04.2023

Good afternoon, dear forum visitors!

NPBFX offers the latest release of analytics on Starbucks Corp. for a better understanding of the current market situation and more efficient trading.

Shares of Starbucks Corp., one of the largest companies in the world, which owns the chain of coffee houses of the same name, are moving in a corrective trend at 105.00.

On the daily chart, the price moved away from the support line of the global rising channel with dynamic boundaries 98.00–117.00.

On the four-hour chart, it can be seen that the potential for a downward movement prevails, which confirms the formation of a global reversal pattern Head and shoulders with the Neckline at 98.00, the formation of the second Shoulder of which should begin in the coming days.

Technical indicators maintain a stable sell signal: fast EMAs on the Alligator indicator are above the signal line, maintaining a stable range width, and the AO histogram is forming corrective bars in the buy zone.

SBUX-120423-11.png


Trading tips

Short positions may be opened after a reversal, reduction, and consolidation of the price below 103.60 with the target at 98.00. Stop loss — 105.00. Implementation period: 7 days or more.

Long positions may be opened after the price rises and consolidates above 107.00 with the target at 111.00. Stop loss — 105.00.

Use more opportunities of the NPBFX analytical portal: E-book

If you just recently started to be interested in trading on FOREX and would like to deepen your knowledge, an electronic Beginner's Guide to FOREX Trading will be an excellent helper for you here. The book consists of 5 chapters and reflects fundamental concepts of the foreign exchange market to start successful trading. From the main chapters of the E-book you can learn about the concepts and history of FOREX, currencies and trend lines, technical indicators, types of orders, trading on news, psychology of trading, risk management and much more.

You can read a Beginner's guide to FOREX Trading online or download it free of charge from the NPBFX analytical portal in the "Education" section. In order to get unlimited access to the E-book and other useful instruments on the portal, you need to register on the NPBFX website.

If you have any questions about trading instruments, you can always ask an analyst in the online chat on the portal and get a free consultation of an experienced specialist.

Use the current recommendations of analysts on Starbucks Corp. and trade efficiently with NPBFX.
 
Pfizer Inc.: technical analysis 14.04.2023

Good afternoon, dear forum visitors!

NPBFX offers the latest release of analytics on Pfizer Inc. for a better understanding of the current market situation and more efficient trading.

Shares of Pfizer Inc., the largest US pharmaceutical company, are trading at 41.00.

On the daily chart, the price is moving within a global downtrend with dynamic boundaries at 51.00–39.00 and reached the support level of the trend yesterday.

On the four-hour chart, despite the formation of a local reversal, the potential for further decline remains high, confirmed by the formation of a local Flag pattern with a support level of 40.50, the implementation of which will return the price to the year’s low of 39.20.

Technical indicators weaken the buy signal: fast EMAs on the Alligator indicator approach the signal line, and the AO histogram forms downward bars in the buying zone.

PFE140423-11.png


Trading tips

Short positions may be opened after the price drops and consolidates below 40.80 with the target at 39.20. Stop loss – 41.30. Implementation period: 7 days or more.

Long positions may be opened after a reversal, growth, and consolidation of the price above 42.10 with the target at 43.90. Stop loss – 41.50.

Use more opportunities of the NPBFX analytical portal: weekly FOREX forecast

You can learn more about the current situation and get acquainted with the weekly analytical forecast in the "Video reviews" section on the NPBFX portal. Weekly video reviews contain trends, key levels, trading recommendations for such popular instruments as GBP/USD, EUR/USD, USD/CHF, AUD/USD. In order to get free and unlimited access to video forecast and other useful instruments on the portal, you need to register on the NPBFX website.

If you have any questions about trading instruments, you can always ask an analyst in the online chat on the portal and get a free consultation of an experienced specialist.

Use the current recommendations of analysts on Pfizer Inc. and trade efficiently with NPBFX.
 
General Electric Co.: technical analysis 17.04.2023

Good afternoon, dear forum visitors!

NPBFX offers the latest release of analytics on General Electric Co. for a better understanding of the current market situation and more efficient trading.

Shares of General Electric Co., an American diversified corporation, are correcting at 95.00.

On the daily chart, the price is within the ascending channel with dynamic boundaries 98.00–76.00, holding near the resistance line.

On the four-hour chart, the upward movement is hampered by numerous attempts to consolidate above the channel resistance line around 97.00. After it is broken, the subsequent movement to 101.00 is possible.

Technical indicators reflect a slowdown in growth, signaling an impending reversal: fast EMAs on the Alligator indicator began to approach the signal line, narrowing the swing range, and the AO histogram is forming corrective bars in the buying zone.

GE-170423-11.png


Trading tips

Short positions may be opened after a reversal, reduction, and consolidation of the price below 93.60 with the target at 88.00. Stop loss – 95.00. Implementation period: 7 days or more.

Long positions may be opened after the price rises and consolidates above 97.00 with the target at 101.00. Stop loss – 95.00.

Use more opportunities of the NPBFX analytical portal: analytics

You can find more actual analytical reviews on other popular currency pairs, metals and CFDs on the NPBFX online portal. Daily analytics with charts, current market prognoses and trading scenarios in the Feed section are available. Get free and unlimited access to the online portal after registering on the official website of NPBFX Company.

If you have any questions about trading instruments, you can always ask an analyst in the online chat on the portal and get a free consultation of an experienced specialist.

Use the current recommendations of analysts on General Electric Co. and trade efficiently with NPBFX.
 
Back
Top