NPBFX - making money with us since 1996!

Cisco Systems Inc.: technical analysis 19.04.2023

Good afternoon, dear forum visitors!

NPBFX offers the latest release of analytics on Cisco Systems Inc. for a better understanding of the current market situation and more efficient trading.

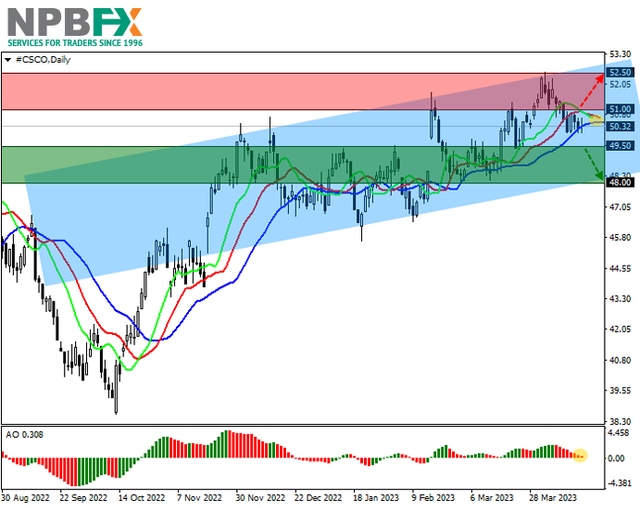
Shares of Cisco Systems Inc., an American manufacturer and supplier of network equipment for large holdings and telecommunications companies, are correcting at 50.32.

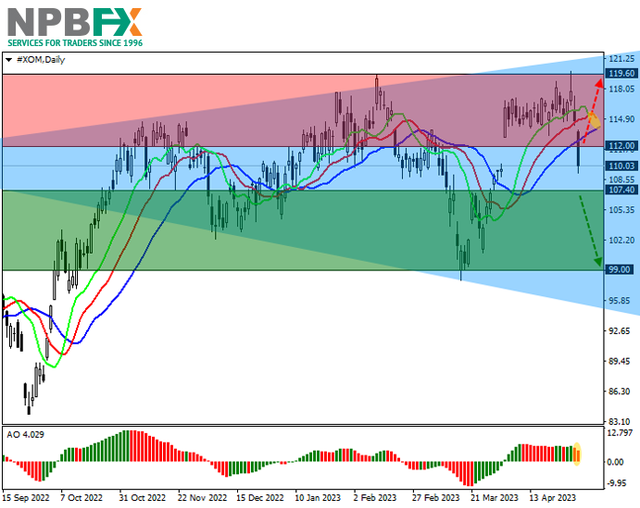
On the daily chart, the price is forming a downward wave within the global ascending channel with dynamic boundaries 48.00–53.00.

On the four-hour chart, it is clear that the downside potential may increase, as the quotes are approaching the local low of 49.50, which is the only obstacle for the “bears”. The probability of growth will increase if the asset consolidates above the local maximum at 52.00.

Technical indicators are ready to give a sell signal: fast EMAs on the Alligator indicator are approaching the signal line, and the AO histogram is forming corrective bars, reaching the transition level.

CSCO-190423-11.png


Trading tips

Short positions may be opened after the price drops and consolidates below 49.50 with the target at 48.00. Stop loss – 50.50. Implementation period: 7 days or more.

Long positions may be opened after a reversal, growth, and consolidation of the price above 51.00 with the target at 52.50. Stop loss – 50.50.

Use more opportunities of the NPBFX analytical portal: E-book

If you just recently started to be interested in trading on FOREX and would like to deepen your knowledge, an electronic Beginner's Guide to FOREX Trading will be an excellent helper for you here. The book consists of 5 chapters and reflects fundamental concepts of the foreign exchange market to start successful trading. From the main chapters of the E-book you can learn about the concepts and history of FOREX, currencies and trend lines, technical indicators, types of orders, trading on news, psychology of trading, risk management and much more.

You can read a Beginner's guide to FOREX Trading online or download it free of charge from the NPBFX analytical portal in the "Education" section. In order to get unlimited access to the E-book and other useful instruments on the portal, you need to register on the NPBFX website.

If you have any questions about trading instruments, you can always ask an analyst in the online chat on the portal and get a free consultation of an experienced specialist.

Use the current recommendations of analysts on Cisco Systems Inc. and trade efficiently with NPBFX.
 
Alcoa Corp.: technical analysis 21.04.2023

Good afternoon, dear forum visitors!

NPBFX offers the latest release of analytics on Alcoa Corp. for a better understanding of the current market situation and more efficient trading.

Shares of Alcoa Corp., one of the world's largest aluminum producers, are trading at 40.00.

On the daily chart, the price is moving within a corrective trend, trying to continue the decline after exiting the ascending corridor with dynamic boundaries 48.00–60.00.

On the four-hour chart, a new local channel at the current levels with the boundaries of 42.50–38.50 is forming, which can work as a Flag pattern. The key "bearish" level is the local low of this range around 38.50, consolidation below which will open the way to the global target.

Technical indicators maintain a sell signal, working out a local correction: the EMA fluctuation range on the Alligator indicator is directed downwards, and the AO histogram forms corrective bars in the sell zone.

AA210423-11.png


Trading tips

Short positions may be opened after the price drops and consolidates below 38.50 with the target at 33.60. Stop loss — 40.00. Implementation period: 7 days or more.

Long positions may be opened after a reversal, growth, and price consolidation above 42.50 with the target at 48.00. Stop loss — 40.00.

Use more opportunities of the NPBFX analytical portal: weekly FOREX forecast

You can learn more about the current situation and get acquainted with the weekly analytical forecast in the "Video reviews" section on the NPBFX portal. Weekly video reviews contain trends, key levels, trading recommendations for such popular instruments as GBP/USD, EUR/USD, USD/CHF, AUD/USD. In order to get free and unlimited access to video forecast and other useful instruments on the portal, you need to register on the NPBFX website.

If you have any questions about trading instruments, you can always ask an analyst in the online chat on the portal and get a free consultation of an experienced specialist.

Use the current recommendations of analysts on Alcoa Corp. and trade efficiently with NPBFX.
 
Johnson & Johnson: technical analysis 24.04.2023

Good afternoon, dear forum visitors!

NPBFX offers the latest release of analytics on Johnson & Johnson for a better understanding of the current market situation and more efficient trading.

Shares of Johnson & Johnson, one of the world's leading retail holdings, are correcting at 162.00.

On the daily chart, the price, trading within a downtrend, reversed upwards after reaching the support level of 150.00.

On the four-hour chart, it is clear that after the start of an upward correction, a formation with dynamic boundaries 163.00–160.00 is developing, which can work as a Flag pattern. To continue corrective growth, the quotes need to break the local high around 166.00.

Technical indicators reinforce the buy signal: the range of fluctuations of the EMA on the Alligator indicator expands upwards, and the AO histogram forms corrective bars high in the buying zone.

jnj-24042023-33.png


Trading tips

Long positions may be opened after the price rises and consolidates above 166.00 with the target at 172.00. Stop loss – 163.00. Implementation period: 7 days or more.

Short positions may be opened after a reversal, reduction, and consolidation of the price below 160.00 with the target at 154.00. Stop loss – 163.00.

Use more opportunities of the NPBFX analytical portal: analytics

You can find more actual analytical reviews on other popular currency pairs, metals and CFDs on the NPBFX online portal. Daily analytics with charts, current market prognoses and trading scenarios in the Feed section are available. Get free and unlimited access to the online portal after registering on the official website of NPBFX Company.

If you have any questions about trading instruments, you can always ask an analyst in the online chat on the portal and get a free consultation of an experienced specialist.

Use the current recommendations of analysts on Johnson & Johnson and trade efficiently with NPBFX.
 
Tesla Inc.: technical analysis 26.04.2023

Good afternoon, dear forum visitors!

NPBFX offers the latest release of analytics on Tesla Inc. for a better understanding of the current market situation and more efficient trading.

Shares of Tesla Inc., the world’s leading manufacturer of electric cars, continue their global correction, trading at 160.00.

On the daily chart, the price moves within the local downward corridor with dynamic boundaries of 201.00–154.00.

On the four-hour chart, it can be seen that the channel’s support line at 156.00 has already been reached, and a reversal may begin soon. The local target for possible growth is working out of the recent price gap of 166.00–180.00.

Technical indicators are holding a sell signal: fast EMAs on the Alligator indicator are below the signal line, and the AO histogram has begun to form rising bars in the sell zone.

TSLA-260423-11.png


Trading tips

Long positions may be opened after a reversal, growth, and consolidation of the price above 166.00 with the target at 180.00. Stop loss – 160.00. Implementation period: 7 days or more.

Short positions may be opened after the price drops and consolidates below 154.50 with the target at 135.00. Stop loss – 160.00.

Use more opportunities of the NPBFX analytical portal: E-book

If you just recently started to be interested in trading on FOREX and would like to deepen your knowledge, an electronic Beginner's Guide to FOREX Trading will be an excellent helper for you here. The book consists of 5 chapters and reflects fundamental concepts of the foreign exchange market to start successful trading. From the main chapters of the E-book you can learn about the concepts and history of FOREX, currencies and trend lines, technical indicators, types of orders, trading on news, psychology of trading, risk management and much more.

You can read a Beginner's guide to FOREX Trading online or download it free of charge from the NPBFX analytical portal in the "Education" section. In order to get unlimited access to the E-book and other useful instruments on the portal, you need to register on the NPBFX website.

If you have any questions about trading instruments, you can always ask an analyst in the online chat on the portal and get a free consultation of an experienced specialist.

Use the current recommendations of analysts on Tesla Inc. and trade efficiently with NPBFX.
 
AUD/USD: Australian dollar returned to decline 28.04.2023

Good afternoon, dear forum visitors!

NPBFX offers the latest release of analytics on AUD/USD for a better understanding of the current market situation and more efficient trading.

Current trend

The AUD/USD pair returned to decline after an attempt at corrective growth the day before and is currently testing 0.6610 for a breakdown, being under pressure from macroeconomic statistics from Australia.

The Producer Price Index in the first quarter in annual terms slowed down from 5.8% to 5.2%, while analysts expected the same dynamics to remain unchanged, and in quarterly terms, the indicator accelerated from 0.7% to 1.0%, which was lower than the predicted 1.5%. Earlier in Australia, data on consumer inflation were published: in the first quarter, the Consumer Price Index corrected from 7.8% to 7.0% in annual terms, slightly falling short of the 6.9% expected by experts, and in the quarter terms the index fell from 1.9% to 1.4% with a forecast of 1.3%.

Further reduction of inflationary pressure in the country is likely to affect the subsequent decisions of the Reserve Bank of Australia (RBA) on the interest rate. In April, the regulator left the figure at 3.60% and analysts expect the same outcome of the RBA's meeting scheduled for May 2. This, in turn, may put significant pressure on the positions of the AUD/USD pair, as the US Federal Reserve is still set to further increase the cost of borrowing.

Support and resistance

Bollinger Bands in D1 chart demonstrate flat dynamics. The price range expands slightly from below, making way for new local lows for the "bears". MACD is falling, keeping a relatively strong sell signal (the histogram is below the signal line). Stochastic, having reached its lows, is trying to reverse in the direction of growth, signaling the risks of the Australian dollar being oversold in the ultra-short term.

Resistance levels: 0.6641, 0.6670, 0.6700, 0.6728.
Support levels: 0.6590, 0.6563, 0.6530, 0.6500.

AUDUSD280423-33.png


AUDUSD280423-333.png


Trading tips

Long positions can be opened after a breakout of 0.6641 with the target of 0.6700. Stop-loss — 0.6600. Implementation time: 2-3 days.

The return of a "bearish" trend with the breakdown of 0.6590 may become a signal for new sales with the target at 0.6530. Stop-loss — 0.6615.

Use more opportunities of the NPBFX analytical portal: analytics

You can find more actual analytical reviews on other popular currency pairs, metals and CFDs on the NPBFX online portal. Daily analytics with charts, current market prognoses and trading scenarios in the Feed section are available. Get free and unlimited access to the online portal after registering on the official website of NPBFX Company.

If you have any questions about trading instruments, you can always ask an analyst in the online chat on the portal and get a free consultation of an experienced specialist.

Use the current recommendations of analysts on AUD/USD and trade efficiently with NPBFX.
 
XAU/USD: gold prices fall ahead of US Federal Reserve meeting 05.01.2023

Good afternoon, dear forum visitors!

NPBFX offers the latest release of analytics on XAU/USD for a better understanding of the current market situation and more efficient trading.

Current trend

The XAU/USD pair is falling, testing 1980.00 for a breakdown. The pressure on quotes increases as the meetings of the US Federal Reserve and the European Central Bank (ECB) approach, which will be held on Wednesday and Thursday, respectively. Experts expect both regulators to raise interest rates by 25 basis points, and it is highly likely that in the case of the Fed, this will be the last tightening in the current cycle. Forecasts suggest that during the June meeting, the US Federal Reserve will keep the rate unchanged with a probability of about 65%.

In turn, gold is supported by expectations of a possible recession in the US economy against the backdrop of new alarming signals regarding the country's banking sector. First Republic Bank shares plunged more than 30% on Friday after corporate reports showed a sharp drop in deposits. At the same time, the financial institution has already received support from creditors; therefore, if the situation worsens further, it may be expected to be taken over by a larger player.

The statistics on the US labor market, which will be released on Friday, May 5, may also have a noticeable impact on the dynamics of the instrument during the week. Forecasts suggest that the number of new jobs created by the US economy outside the agricultural sector will slow down from 236.0 thousand to 181.0 thousand, while the Unemployment Rate may remain unchanged at 3.5%.

Meanwhile, the period of local correction continues on the market of gold contracts. According to the latest report from the US Commodity Futures Trading Commission (CFTC), the number of net speculative positions in gold amounted to 185.3 thousand against 189.9 thousand a week earlier, marking the fourth consecutive week of falling "open interest". The situation with the liquidation of positions is clearly seen in the dynamics of contracts with manufacturers, the number of which amounted to 29.197 thousand for the "bulls" against 73.821 thousand for the "bears". Last week, sellers reduced the number of positions by 2.459 thousand, and buyers reduced them by 1.021 thousand, signaling a smooth liquidation of transactions, more like a partial fixation.

Support and resistance

Bollinger Bands in D1 chart demonstrate a moderate decrease. The price range is narrowing insignificantly, reflecting the ambiguous nature of trading of recent days. MACD is falling, keeping a relatively strong sell signal (the histogram is below the signal line). Stochastic reversed downwards last week, reacting to a slight overbalance of "bearish" sentiment in the ultra-short term.

Resistance levels: 2000.00, 2015.30, 2030.00, 2050.00.
Support levels: 1974.22, 1952.53, 1930.00, 1915.00.

xauusd-01052023-55.png


xauusd-01052023-66.png


Trading tips

Short positions may be opened after a breakdown of 1974.22 with the target at 1930.00. Stop-loss — 2000.00. Implementation time: 2-3 days.

A rebound from 1974.22 as from support followed by a breakout of 2000.00 may become a signal for opening new long positions with the target at 2030.00. Stop-loss — 1985.00.

Use more opportunities of the NPBFX analytical portal: weekly FOREX forecast

You can learn more about the current situation and get acquainted with the weekly analytical forecast in the "Video reviews" section on the NPBFX portal. Weekly video reviews contain trends, key levels, trading recommendations for such popular instruments as GBP/USD, EUR/USD, USD/CHF, AUD/USD. In order to get free and unlimited access to video forecast and other useful instruments on the portal, you need to register on the NPBFX website.

If you have any questions about trading instruments, you can always ask an analyst in the online chat on the portal and get a free consultation of an experienced specialist.

Use the current recommendations of analysts on XAU/USD and trade efficiently with NPBFX.
 
ExxonMobil Corp.: technical analysis 03.05.2023

Good afternoon, dear forum visitors!

NPBFX offers the latest release of analytics on ExxonMobil Corp. for a better understanding of the current market situation and more efficient trading.

Shares of ExxonMobil Corp., a US oil company, are trading at 110.00.

On the daily chart, there is a global corrective trend, and at the moment, the price is falling within the Expanding formation pattern with dynamic boundaries of 122.00–95.00, which has been forming for a long time.

On the four-hour chart, after reaching the resistance line of 120.00, the quotes reversed and began to form the fifth wave, which is mandatory for the formation: the probability of the asset falling will increase if it consolidates below the support level of 107.00.

Technical indicators point to continued negative dynamics: fast EMAs on the Alligator indicator are approaching the signal line, and the AO histogram is forming downward bars in the buying zone, preparing to move into the negative zone.

XOM030523-11.png


Trading tips

Short positions may be opened after the price drops and consolidates below 107.40 with the target at 99.00. Stop loss – 110.00. Implementation period: 7 days or more.

Long positions may be opened after a reversal, growth, and consolidation of the price above 112.00 with the target at 119.60. Stop loss – 110.00.

Use more opportunities of the NPBFX analytical portal: E-book

If you just recently started to be interested in trading on FOREX and would like to deepen your knowledge, an electronic Beginner's Guide to FOREX Trading will be an excellent helper for you here. The book consists of 5 chapters and reflects fundamental concepts of the foreign exchange market to start successful trading. From the main chapters of the E-book you can learn about the concepts and history of FOREX, currencies and trend lines, technical indicators, types of orders, trading on news, psychology of trading, risk management and much more.

You can read a Beginner's guide to FOREX Trading online or download it free of charge from the NPBFX analytical portal in the "Education" section. In order to get unlimited access to the E-book and other useful instruments on the portal, you need to register on the NPBFX website.

If you have any questions about trading instruments, you can always ask an analyst in the online chat on the portal and get a free consultation of an experienced specialist.

Use the current recommendations of analysts on ExxonMobil Corp. and trade efficiently with NPBFX.
 
Alcoa Corp.: technical analysis 05.05.2023

Good afternoon, dear forum visitors!

NPBFX offers the latest release of analytics on Alcoa Corp. for a better understanding of the current market situation and more efficient trading.

Shares of Alcoa Corp., one of the world’s largest aluminum producers, are trading at 34.00.

On the daily chart, the price is moving within a corrective trend, falling within the corridor with dynamic boundaries 28.00–42.00.

On a four-hour chart, quotes are close to a historical low of 33.00, coinciding with the range support line, consolidation below which will become a catalyst for moving to 30.00 and beyond.

Technical indicators maintain a sell signal: the range of EMA fluctuations on the Alligator indicator is directed downwards, and the AO histogram forms downward bars in the sell zone.

AA-050523-22.png


Trading tips

Short positions may be opened after falling and consolidation below 33.40 with the target at 29.00. Stop loss — 35.00. Implementation period: 7 days or more.

Long positions may be opened after a reversal, growth, and price consolidation above 36.00 with the target at 41.00. Stop loss — 34.00.

Use more opportunities of the NPBFX analytical portal: weekly FOREX forecast

You can learn more about the current situation and get acquainted with the weekly analytical forecast in the "Video reviews" section on the NPBFX portal. Weekly video reviews contain trends, key levels, trading recommendations for such popular instruments as GBP/USD, EUR/USD, USD/CHF, AUD/USD. In order to get free and unlimited access to video forecast and other useful instruments on the portal, you need to register on the NPBFX website.

If you have any questions about trading instruments, you can always ask an analyst in the online chat on the portal and get a free consultation of an experienced specialist.

Use the current recommendations of analysts on Alcoa Corp. and trade efficiently with NPBFX.
 
EUR/USD: European currency in correction after Friday's decline 08.05.2023

Good afternoon, dear forum visitors!

NPBFX offers the latest release of analytics on EUR/USD for a better understanding of the current market situation and more efficient trading.

Current trend

The EUR/USD pair shows an upward trend, recovering from a moderate decline at the end of last week and testing 1.1040 for a breakout, and investors continue to analyze a block of macroeconomic statistics released in the US and Europe on Friday, May 5.

After the meeting of the US Federal Reserve, markets are evaluating the performance of the US labor market, which remains quite strong, despite a significant increase in the cost of borrowing, which supported the buying sentiment on the American currency. The number of Initial Jobless Claims reached 242.0 thousand, exceeding the projected 240.0 thousand and the previous value at the level of 229.0 thousand. However, the number of Continuing Jobless Claims has adjusted from 1.843 million to 1.805 million. In turn, the number of new jobs created by the US economy outside the agricultural sector increased by 253.0 thousand in April after an increase of 165.0 thousand in the previous month, while analysts expected 179.0 thousand. At the same time, the Average Hourly Earnings accelerated from 4.3% to 4.4%, while experts expected a slowdown in dynamics to 4.2%, and the Unemployment Rate fell again from 3.5% to 3.4%, which turned out to be better than neutral forecasts. Strong data on the labor market strengthened investors' confidence in the expediency of the course chosen by the US Federal Reserve, aimed at further tightening of monetary policy. Recall that last week the regulator once again decided to raise interest rates by 25 basis points.

Data from Europe disappointed market participants with a sharp drop in Retail Sales in the eurozone: in March, the indicator fell by 1.2% after a decrease of 0.2% a month earlier, and in annual terms, the decline in sales accelerated from -2.4% to -3.8%, which turned out to be worse than analysts' forecasts at the level of -3.1%.

Support and resistance

Bollinger Bands in D1 chart show moderate growth. The price range is narrowing from below, reflecting the emergence of ambiguous dynamics of trading in the short term. MACD is reversing upwards preserving a sell signal (located below the signal line). Stochastic interrupted its growth and returned to its decline, being approximately in the center of its area.

Resistance levels: 1.1050, 1.1100, 1.1150, 1.1200.
Support levels: 1.1000, 1.0965, 1.0928, 1.0850.

eurusd-08052023-55.png


eurusd-08052023-66.png


Trading tips

Long positions can be opened after a breakout of 1.1050 with the target of 1.1150. Stop-loss — 1.1000. Implementation time: 2-3 days.

A rebound from 1.1050 as from resistance, followed by a breakdown of 1.1000 may become a signal for opening of new short positions with the target at 1.0900. Stop-loss — 1.1050.

Use more opportunities of the NPBFX analytical portal: analytics

You can find more actual analytical reviews on other popular currency pairs, metals and CFDs on the NPBFX online portal. Daily analytics with charts, current market prognoses and trading scenarios in the Feed section are available. Get free and unlimited access to the online portal after registering on the official website of NPBFX Company.

If you have any questions about trading instruments, you can always ask an analyst in the online chat on the portal and get a free consultation of an experienced specialist.

Use the current recommendations of analysts on EUR/USD and trade efficiently with NPBFX.
 
Starbucks Corp.: technical analysis 10.05.2023

Good afternoon, dear forum visitors!

NPBFX offers the latest release of analytics on Starbucks Corp. for a better understanding of the current market situation and more efficient trading.

Shares of Starbucks Corp., one of the largest companies in the world that owns the coffee chain of the same name, are trading at 107.00.

On the daily chart, the price is correcting within the Expanding formation pattern with dynamic boundaries of 116.00–97.00, forming a downward wave.

On the four-hour chart, after reaching the pattern’s resistance line at 116.00, the quotes reversed and started building a downward wave, which is the fifth in a row, mandatory for the pattern. The target for working out the movement is around 97.00, and the probability of its achievement has increased after the formation of a price gap of 114.00–108.00.

Technical indicators almost reversed downwards: fast EMAs on the Alligator indicator are approaching the signal line, narrowing the oscillation range, and the AO histogram is forming downward bars in the buying zone.

SBUX-100523-11.png


Trading tips

Short positions may be opened after the price drops and consolidates below 103.80 with the target at 97.20. Stop loss – 106.00. Implementation period: 7 days or more.

Long positions may be opened after a reversal, growth, and price consolidation above 109.70 with the target at 115.50. Stop loss – 107.00.

Use more opportunities of the NPBFX analytical portal: E-book

If you just recently started to be interested in trading on FOREX and would like to deepen your knowledge, an electronic Beginner's Guide to FOREX Trading will be an excellent helper for you here. The book consists of 5 chapters and reflects fundamental concepts of the foreign exchange market to start successful trading. From the main chapters of the E-book you can learn about the concepts and history of FOREX, currencies and trend lines, technical indicators, types of orders, trading on news, psychology of trading, risk management and much more.

You can read a Beginner's guide to FOREX Trading online or download it free of charge from the NPBFX analytical portal in the "Education" section. In order to get unlimited access to the E-book and other useful instruments on the portal, you need to register on the NPBFX website.

If you have any questions about trading instruments, you can always ask an analyst in the online chat on the portal and get a free consultation of an experienced specialist.

Use the current recommendations of analysts on Starbucks Corp. and trade efficiently with NPBFX.
 
Back
Top