NPBFX - making money with us since 1996!

Tesla Inc.: technical analysis 05.06.2023

Good afternoon, dear forum visitors!

NPBFX offers the latest release of analytics on Tesla Inc. for a better understanding of the current market situation and more efficient trading.

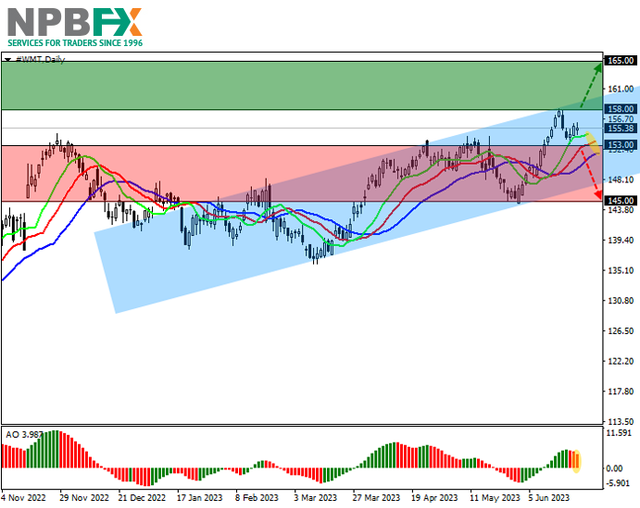
Shares of Tesla Inc., the world’s leading manufacturer of electric cars, continue their global correction, trading at 214.00.

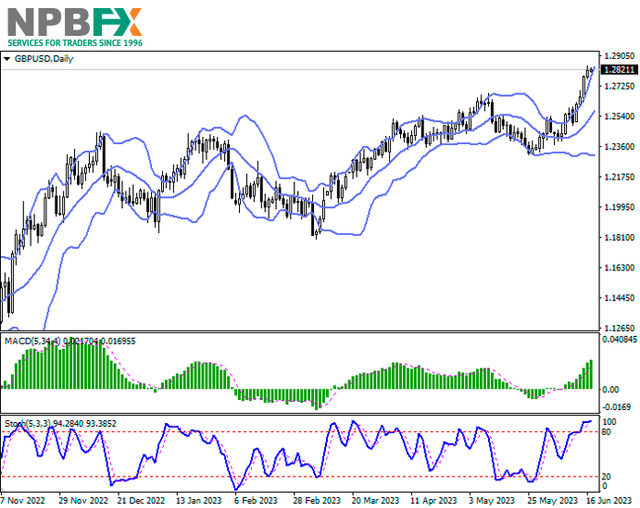
On the daily chart, the price is growing, consolidated above the resistance line of the downwards corridor with dynamic boundaries of 190.00–143.00.

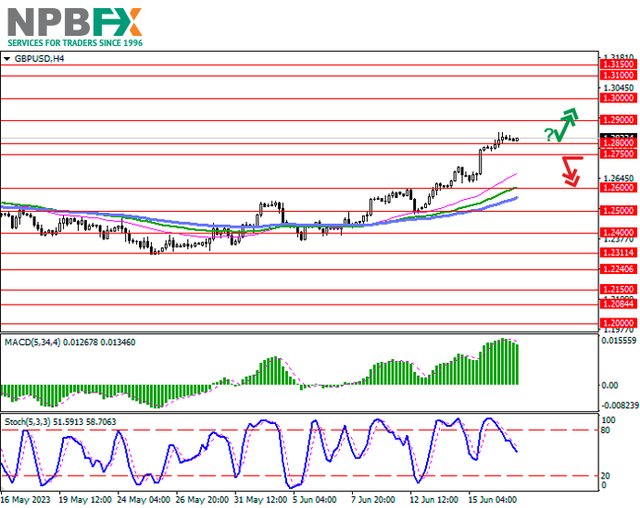
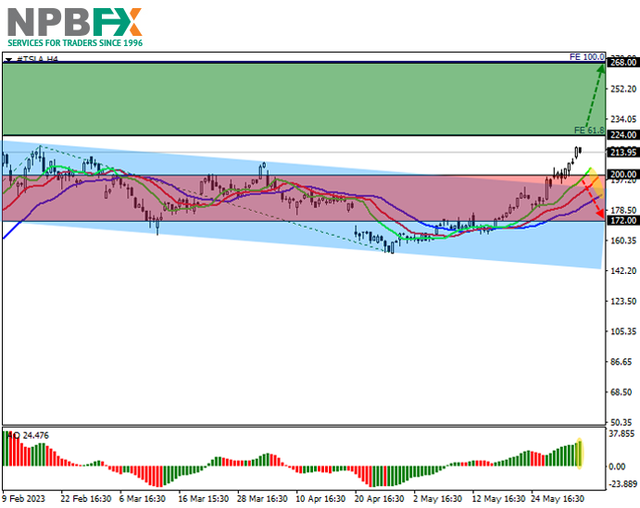
On the 4-hour chart, if the initial Fibonacci extension 61.8% trend level of 224.00 is broken, the upside momentum will become a full trend, and the next resistance will be the 100.0% Fibonacci extension core trend level of 268.00.

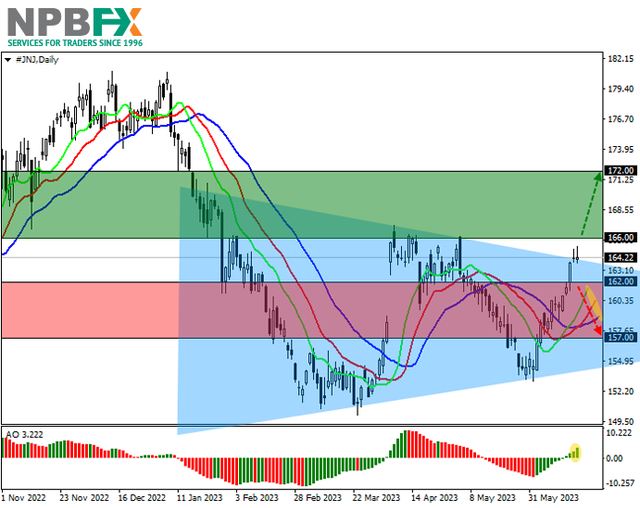
Technical indicators are signaling growth: fast EMAs on the Alligator indicator are moving away from the signal line, expanding the range of fluctuations, and the AO histogram is forming rising bars in the buying zone.

TSLA-050623-22.png


Trading tips

Long positions may be opened after the price rises and consolidates above 224.00 with the target at 268.00. Stop loss — 215.00. Implementation period: 7 days or more.

Short positions may be opened after the price drops and consolidates below 200.00 with the target at 172.00. Stop loss — 210.00.

Use more opportunities of the NPBFX analytical portal: E-book

If you just recently started to be interested in trading on FOREX and would like to deepen your knowledge, an electronic Beginner's Guide to FOREX Trading will be an excellent helper for you here. The book consists of 5 chapters and reflects fundamental concepts of the foreign exchange market to start successful trading. From the main chapters of the E-book you can learn about the concepts and history of FOREX, currencies and trend lines, technical indicators, types of orders, trading on news, psychology of trading, risk management and much more.

You can read a Beginner's guide to FOREX Trading online or download it free of charge from the NPBFX analytical portal in the "Education" section. In order to get unlimited access to the E-book and other useful instruments on the portal, you need to register on the NPBFX website.

If you have any questions about trading instruments, you can always ask an analyst in the online chat on the portal and get a free consultation of an experienced specialist.

Use the current recommendations of analysts on Tesla Inc. and trade efficiently with NPBFX.
 
Alcoa Corp.: technical analysis 07.06.2023

Good afternoon, dear forum visitors!

NPBFX offers the latest release of analytics on Alcoa Corp. for a better understanding of the current market situation and more efficient trading.

Shares of Alcoa Corp., one of the world’s largest aluminum producers, are trading at 34.00.

On the daily chart, the price is moving within a corrective trend, retreating from the support line of the global downward corridor with dynamic boundaries of 36.00–31.00.

On the four-hour chart, it can be seen that after the breakdown of the low of 33.50, the quotes reversed and returned above it. After reaching the upper limit of the local channel at 35.00, another change in the direction of movement is likely, and an increase in the global momentum with an attempt to reach the year’s low of 31.10.

Technical indicators keep a sell signal: the EMA fluctuation range on the Alligator indicator remains wide, and the AO histogram forms corrective bars in the sell zone.

AA-070623-22.png


Trading tips

Short positions may be opened after the price drops and consolidates below 33.50 with the aim of 31.10. Stop loss – 34.50. Implementation period: 7 days or more.

Long positions may be opened after a reversal, growth, and price consolidation above 36.00 with the target at 40.00. Stop loss — 35.00.

Use more opportunities of the NPBFX analytical portal: analytics

You can find more actual analytical reviews on other popular currency pairs, metals and CFDs on the NPBFX online portal. Daily analytics with charts, current market prognoses and trading scenarios in the Feed section are available. Get free and unlimited access to the online portal after registering on the official website of NPBFX Company.

If you have any questions about trading instruments, you can always ask an analyst in the online chat on the portal and get a free consultation of an experienced specialist.

Use the current recommendations of analysts on Alcoa Corp. and trade efficiently with NPBFX.
 
Alphabet Inc.: technical analysis 09.06.2023

Good afternoon, dear forum visitors!

NPBFX offers the latest release of analytics on Alphabet Inc. for a better understanding of the current market situation and more efficient trading.

Shares of the American holding company Alphabet Inc. are moving in the global corrective trend at 122.00.

On the daily chart, an ascending channel with dynamic boundaries of 115.00–133.00 is forming, within which the price, having reversed from the resistance line, continues its local decline.

On the four-hour chart, a breakdown of the key low of 120.70 will open the possibility of a full-fledged decline to the global channel support line at 115.00. At the moment, there are practically no prospects for correction but they may appear in case of re-consolidation of quotes above 126.00.

Technical indicators are preparing to give a sell signal: fast EMAs on the Alligator indicator are approaching the signal line, actively narrowing the range of fluctuations, and the AO histogram is forming downward bars close to the transition level.

GOOG-090623-22.png


Trading tips

Short positions may be opened after a reversal, reduction, and consolidation of the price below 120.70 with the target at 115.00. Stop loss – 123.00. Implementation period: 7 days or more.

Long positions may be opened after the price rises and consolidates above 126.00 with the target at 133.00. Stop loss – 123.00.

Use more opportunities of the NPBFX analytical portal: E-book

If you just recently started to be interested in trading on FOREX and would like to deepen your knowledge, an electronic Beginner's Guide to FOREX Trading will be an excellent helper for you here. The book consists of 5 chapters and reflects fundamental concepts of the foreign exchange market to start successful trading. From the main chapters of the E-book you can learn about the concepts and history of FOREX, currencies and trend lines, technical indicators, types of orders, trading on news, psychology of trading, risk management and much more.

You can read a Beginner's guide to FOREX Trading online or download it free of charge from the NPBFX analytical portal in the "Education" section. In order to get unlimited access to the E-book and other useful instruments on the portal, you need to register on the NPBFX website.

If you have any questions about trading instruments, you can always ask an analyst in the online chat on the portal and get a free consultation of an experienced specialist.

Use the current recommendations of analysts on Alphabet Inc. and trade efficiently with NPBFX.
 
Netflix Inc.: technical analysis 12.06.2023

Good afternoon, dear forum visitors!

NPBFX offers the latest release of analytics on Netflix Inc. for a better understanding of the current market situation and more efficient trading.

Shares of Netflix Inc., an American entertainment company and movie and series streaming service, are trending correctively at 420.00.

On the daily chart, the price is forming a wave of growth within the global ascending corridor with dynamic boundaries of 350.00–460.00.

On the four-hour chart, upside potential remains high as the stock consolidated above the initial 61.8% Fibonacci extension trend at 418.00, which allows the stocks hit a global high of 470.00.

Technical indicators keep a stable buy signal: fast EMAs on the Alligator indicator are moving away from the signal line, and the AO histogram is forming rising bars in the buying zone.

NFLX-120623-22.png


Trading tips

Long positions may be opened after the price rises and consolidates above 430.00 with the target at 470.00. Stop loss – 415.00. Implementation period: 7 days or more.

Short positions may be opened after a reversal, reduction, and consolidation of the price below 416.00 with the target at 379.00. Stop loss – 425.00.

Use more opportunities of the NPBFX analytical portal: analytics

You can find more actual analytical reviews on other popular currency pairs, metals and CFDs on the NPBFX online portal. Daily analytics with charts, current market prognoses and trading scenarios in the Feed section are available. Get free and unlimited access to the online portal after registering on the official website of NPBFX Company.

If you have any questions about trading instruments, you can always ask an analyst in the online chat on the portal and get a free consultation of an experienced specialist.

Use the current recommendations of analysts on Netflix Inc. and trade efficiently with NPBFX.
 
Cisco Systems Inc.: technical analysis 14.06.2023

Good afternoon, dear forum visitors!

NPBFX offers the latest release of analytics on Cisco Systems Inc. for a better understanding of the current market situation and more efficient trading.

Shares of Cisco Systems Inc., an American manufacturer and supplier of network equipment for large holdings and telecommunications companies, are correcting at 50.80.

On the daily chart, the price is growing towards the resistance line of the rising channel with dynamic boundaries 46.00–53.00.

On the four-hour chart, the growth potential is quite high, as evidenced by the recent consolidation of quotes above the local high of 50.00. The key “bullish” level is the year’s high at 53.00, and in case of a reversal, the key “bearish” level will be the channel support level at 47.00.

Technical indicators keep a stable buy signal: fast EMAs on the Alligator indicator are significantly above the signal line, and the AO histogram forms rising bars deep in the positive zone.

CSCO-140623-22.png


Trading tips

Long positions may be opened after the price rises and consolidates above 51.70 with the target at 54.00. Stop loss — 51.00. Implementation period: 7 days or more.

Short positions may be opened after a reversal, reduction, and consolidation of the price below 49.50 with the target at 47.40. Stop loss – 50.50.

Use more opportunities of the NPBFX analytical portal: weekly FOREX forecast

You can learn more about the current situation and get acquainted with the weekly analytical forecast in the "Video reviews" section on the NPBFX portal. Weekly video reviews contain trends, key levels, trading recommendations for such popular instruments as GBP/USD, EUR/USD, USD/CHF, AUD/USD. In order to get free and unlimited access to video forecast and other useful instruments on the portal, you need to register on the NPBFX website.

If you have any questions about trading instruments, you can always ask an analyst in the online chat on the portal and get a free consultation of an experienced specialist.

Use the current recommendations of analysts on Cisco Systems Inc. and trade efficiently with NPBFX.
 
Apple Inc.: technical analysis 16.06.2023

Good afternoon, dear forum visitors!

NPBFX offers the latest release of analytics on Apple Inc. for a better understanding of the current market situation and more efficient trading.

Shares of Apple Inc., the global giant in the development and sale of personal and tablet computers, are moving within a corrective trend at 186.00.

On the daily chart, the price remains within the global ascending corridor with dynamic boundaries of 180.00–205.00, forming another ascending wave.

On the four-hour chart, the upward movement has high prospects for continuation, as evidenced by the breakout of the previous global high of June 5 around 185.00, after which there is practically no resistance left, and the instrument can continue moving up to the channel resistance line around 205.00.

Technical indicators confirm the high probability of growth: fast EMAs on the Alligator indicator are above the signal line, and the AO histogram forms corrective bars above the transition level.

AAPL-160623-11.png


Trading tips

Long positions may be opened after the price rises and consolidates above 188.00 with the target at 196.00 and stop loss 184.00. Implementation period: 7 days or more.

Short positions may be opened after the price drops and consolidates below 182.00 with the target at 174.00. Stop loss – 186.00.

Use more opportunities of the NPBFX analytical portal: analytics

You can find more actual analytical reviews on other popular currency pairs, metals and CFDs on the NPBFX online portal. Daily analytics with charts, current market prognoses and trading scenarios in the Feed section are available. Get free and unlimited access to the online portal after registering on the official website of NPBFX Company.

If you have any questions about trading instruments, you can always ask an analyst in the online chat on the portal and get a free consultation of an experienced specialist.

Use the current recommendations of analysts on Apple Inc. and trade efficiently with NPBFX.
 
GBP/USD: analysts expect interest rate hike by the Bank of England 19.06.2023

Good afternoon, dear forum visitors!

NPBFX offers the latest release of analytics on GBP/USD for a better understanding of the current market situation and more efficient trading.

Current trend

The GBP/USD pair is trading with mixed dynamics, trying to reverse downwards after a rather strong growth last week, as a result of which the record highs from April 22 were updated. The instrument is testing the level of 1.2800 for a breakdown; however, investors are in no hurry to open new positions, preferring to wait for the drivers.

On Wednesday, June 21, May statistics on the Consumer Price Index will be published in the UK, which may slow down from 8.7% to 8.5% in annual terms and from 1.2% to 0.4% in monthly terms. The Core CPI is assumed to remain at the previous level of 6.8%, while the Core Producer Price Index may be adjusted from 6.0% to 4.7%.

On Thursday, June 22, there will be a meeting of the Bank of England, which is preparing for another increase in interest rates by 25 basis points to 4.75%. It is expected that seven members of the regulator's board will vote for the decision to tighten monetary policy, and only two will vote for maintaining the value at current levels. Analysts at Bloomberg believe that a long "hawkish" course, as well as an increase in the cost of borrowing by the British financial authorities to 6.00%, could lead to negative consequences for the national economy. In particular, households are once again under pressure from soaring mortgage costs, while corporate insolvency suggests that particularly small market participants, which account for the bulk of employment, will optimize spending by laying off employees. Experts suggest that Bank of England officials will continue to adjust interest rates this week further, up to 5.75% or possibly even 6.00% next year. If the forecast is realized, mortgages will rise in price by an average of 250.0 pounds, a maximum in 22 years.

During the week in the US, investors will be watching data on the jobless claims, as well as the speech of US Federal Reserve Chairman Jerome Powell in Congress, where, among other things, issues of further tightening of monetary policy may be raised.

Support and resistance

Bollinger Bands on the daily chart show a steady increase. The price range is expanding but it fails to conform to the surge of "bullish" activity at the moment. MACD grows, preserving a stable buy signal (located above the signal line). Stochastic, having reached its highs, reversed into a horizontal plane, indicating overbought British currency in the ultra-short term.

Resistance levels: 1.2900, 1.3000, 1.3100, 1.3150.
Support levels: 1.2800, 1.2750, 1.2600, 1.2500.

GBPUSD190623-33.png


GBPUSD190623-333.png


Trading tips

Short positions may be opened after a breakdown of 1.2750 with the target at 1.2600. Stop-loss — 1.2830. Implementation time: 2-3 days.

A rebound from 1.2800 as from support followed by a breakout of 1.2900 may become a signal for opening new long positions with the target at 1.3100. Stop-loss — 1.2800.

Use more opportunities of the NPBFX analytical portal: weekly FOREX forecast

You can learn more about the current situation and get acquainted with the weekly analytical forecast in the "Video reviews" section on the NPBFX portal. Weekly video reviews contain trends, key levels, trading recommendations for such popular instruments as GBP/USD, EUR/USD, USD/CHF, AUD/USD. In order to get free and unlimited access to video forecast and other useful instruments on the portal, you need to register on the NPBFX website.

If you have any questions about trading instruments, you can always ask an analyst in the online chat on the portal and get a free consultation of an experienced specialist.

Use the current recommendations of analysts on GBP/USD and trade efficiently with NPBFX.
 
Johnson & Johnson: technical analysis 21.06.2023

Good afternoon, dear forum visitors!

NPBFX offers the latest release of analytics on Johnson & Johnson for a better understanding of the current market situation and more efficient trading.

Shares of Johnson & Johnson, one of the world’s leading retail holdings, are trading at 164.00.

On the daily chart, the price is holding within a corrective trend, trying to consolidate above 165.00.

On the four-hour chart, the quotes are locked within a local Triangle pattern with dynamic boundaries of 164.00–154.00, within which the asset is testing the resistance line of 164.00, preparing to start the pattern implementation, the first target for working out of which is the local resistance level of 172.00.

Technical indicators keep a buy signal: the EMA fluctuation range on the Alligator indicator is actively expanding, and the AO histogram is forming rising bars in the buy zone.

JNJ-210623-22.png


Trading tips

Long positions may be opened after the price rises and consolidates above 166.00 with the target at 172.00. Stop loss – 163.00. Implementation period: 7 days or more.

Short positions may be opened after the price drops and consolidates below 162.00 with the target at 157.00. Stop loss – 164.00.

Use more opportunities of the NPBFX analytical portal: analytics

You can find more actual analytical reviews on other popular currency pairs, metals and CFDs on the NPBFX online portal. Daily analytics with charts, current market prognoses and trading scenarios in the Feed section are available. Get free and unlimited access to the online portal after registering on the official website of NPBFX Company.

If you have any questions about trading instruments, you can always ask an analyst in the online chat on the portal and get a free consultation of an experienced specialist.

Use the current recommendations of analysts on Johnson & Johnson and trade efficiently with NPBFX.
 
The Walt Disney Co.: technical analysis 23.06.2023

Good afternoon, dear forum visitors!

NPBFX offers the latest release of analytics on The Walt Disney Co. for a better understanding of the current market situation and more efficient trading.

Shares of The Walt Disney Co., one of the leaders in the global entertainment industry, are trading in a corrective trend at 88.40.

On the daily chart, the price is holding in a global downtrend, trying to reach the lows of the year at 88.00.

On the four-hour chart, the movement is developing within the Triangle pattern with dynamically narrowing boundaries of 91.00–85.00, and the presence of quotes in the last third of the formation indicates its imminent implementation. After consolidating below the May low of 87.00, the decline could extend to the initial 61.8% Fibonacci extension trend level at 84.00.

Technical indicators keep a stable sell signal: fast EMAs on the Alligator indicator are moving away from the signal line, and the AO histogram is forming downward bars, falling in the sell zone.

DIS-230623-22.png


Trading tips

Short positions may be opened after the price drops and consolidates below 87.00 with the target at 84.10. Stop loss — 88.00. Implementation period: 7 days or more.

Long positions may be opened after a reversal, growth, and consolidation of the price above 90.50 with the target at 94.50. Stop loss – 89.50.

Use more opportunities of the NPBFX analytical portal: E-book

If you just recently started to be interested in trading on FOREX and would like to deepen your knowledge, an electronic Beginner's Guide to FOREX Trading will be an excellent helper for you here. The book consists of 5 chapters and reflects fundamental concepts of the foreign exchange market to start successful trading. From the main chapters of the E-book you can learn about the concepts and history of FOREX, currencies and trend lines, technical indicators, types of orders, trading on news, psychology of trading, risk management and much more.

You can read a Beginner's guide to FOREX Trading online or download it free of charge from the NPBFX analytical portal in the "Education" section. In order to get unlimited access to the E-book and other useful instruments on the portal, you need to register on the NPBFX website.

If you have any questions about trading instruments, you can always ask an analyst in the online chat on the portal and get a free consultation of an experienced specialist.

Use the current recommendations of analysts on The Walt Disney Co. and trade efficiently with NPBFX.
 
Walmart Inc.: technical analysis 26.06.2023

Good afternoon, dear forum visitors!

NPBFX offers the latest release of analytics on Walmart Inc. for a better understanding of the current market situation and more efficient trading.

Shares of Walmart Inc., the US company that operates the world’s largest wholesale and retail chain, are trading at 155.00.

On the daily chart, the price is correcting within the global ascending corridor with dynamic boundaries 161.00–148.00.

On the four-hour chart after the implementation of the local reversal Head and shoulders pattern, the quotes consolidated above the Head of the formation around 154.00, denoting a new upward impulse. Now, the reverse testing of this level is ending, and after the asset consolidates above the local high of 158.00, the positive dynamics may continue.

Technical indicators reinforce the upward signal: fast EMAs on the Alligator indicator are in the buying zone, keeping at a sufficient distance from the signal line, and the AO histogram forms corrective bars above the transition level.

WMT-260623-22.png


Trading tips

Long positions may be opened after the price rises and consolidates at 158.00 with the target at 165.00. Stop loss – 154.00. Implementation period: 7 days or more.

Short positions may be opened after a reversal, reduction, and consolidation of the price below 153.00 with the target at 145.00. Stop loss – 156.00.

Use more opportunities of the NPBFX analytical portal: analytics

You can find more actual analytical reviews on other popular currency pairs, metals and CFDs on the NPBFX online portal. Daily analytics with charts, current market prognoses and trading scenarios in the Feed section are available. Get free and unlimited access to the online portal after registering on the official website of NPBFX Company.

If you have any questions about trading instruments, you can always ask an analyst in the online chat on the portal and get a free consultation of an experienced specialist.

Use the current recommendations of analysts on Walmart Inc. and trade efficiently with NPBFX.
 
Back
Top