NPBFX - making money with us since 1996!

Pfizer Inc.: technical analysis 28.06.2023

Good afternoon, dear forum visitors!

NPBFX offers the latest release of analytics on Pfizer Inc. for a better understanding of the current market situation and more efficient trading.

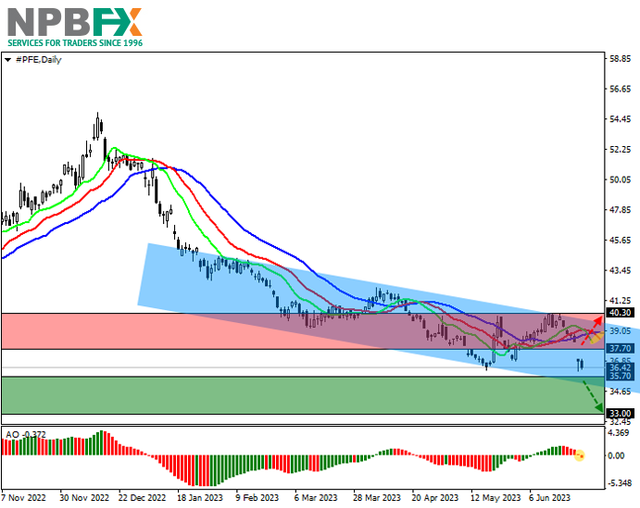
Shares of Pfizer Inc., the largest US pharmaceutical company, are correcting at 36.50.

On the daily chart, the price is moving within a global downward channel with dynamic boundaries of 40.00–34.60.

On the four-hour chart, the downside potential remains high, as evidenced by the recent sharp decline with the price gap of 38.25–37.00. The downward dynamics are confirmed as the asset is close to the year’s low of 36.50, which, most likely, will be broken soon.

Technical indicators reinforce the sell signal: fast EMAs on the Alligator indicator have crossed the signal line downwards, and the AO histogram is forming downward bars in the sell zone.

PFE-280623-2.png


Trading tips

Short positions may be opened after the price drops and consolidates below 35.70 with the target at 33.00. Stop loss – 36.70. Implementation period: 7 days or more.

Long positions may be opened after a reversal, growth, and consolidation of the price above 37.70 with the target at 40.30. Stop loss — 37.00.

Use more opportunities of the NPBFX analytical portal: E-book

If you just recently started to be interested in trading on FOREX and would like to deepen your knowledge, an electronic Beginner's Guide to FOREX Trading will be an excellent helper for you here. The book consists of 5 chapters and reflects fundamental concepts of the foreign exchange market to start successful trading. From the main chapters of the E-book you can learn about the concepts and history of FOREX, currencies and trend lines, technical indicators, types of orders, trading on news, psychology of trading, risk management and much more.

You can read a Beginner's guide to FOREX Trading online or download it free of charge from the NPBFX analytical portal in the "Education" section. In order to get unlimited access to the E-book and other useful instruments on the portal, you need to register on the NPBFX website.

If you have any questions about trading instruments, you can always ask an analyst in the online chat on the portal and get a free consultation of an experienced specialist.

Use the current recommendations of analysts on Pfizer Inc. and trade efficiently with NPBFX.
 
EUR/USD: President the ECB believes that the peak interest rate has not yet been set 30.06.2023

Good afternoon, dear forum visitors!

NPBFX offers the latest release of analytics on EUR/USD for a better understanding of the current market situation and more efficient trading.

Current trend

The EUR/USD pair shows a slight increase, recovering from an active decline for two trading sessions in a row, as a result of which the local lows of June 23 were updated. The instrument is testing the level of 1.0870 for a breakout, waiting for new drivers for the upward dynamics.

May statistics from Germany is in the focus of investors' attention today. In annual terms, Retail Sales decreased by 3.6%, while analysts assumed that the indicator would remain at the same level of -4.3%, and on a monthly basis it added 0.4% after 0.8% a month earlier, while experts expected zero dynamics. At the same time, the Unemployment Change in Germany may increase from 9.0 thousand to 13.0 thousand, and the Unemployment Rate may remain at the same level of 5.6%.

In addition, in the euro area today at 11:00 (GMT+2) June data on inflation will be published. Forecasts suggest that the Consumer Price Index will slow down from 6.1% to 5.6% in annual terms and show zero dynamics in monthly terms. The Core CPI for the same period, on the contrary, may rise from 0.2% to 0.7% in monthly terms and from 5.3% to 5.5% in annual terms. The day before, Germany reported on the acceleration of the Consumer Price Index in June from 6.1% to 6.4%, which was worse than market expectations at 6.3%.

Earlier, the President of the European Central Bank (ECB), Christine Lagarde, noted that inflation in the region is still kept well above the target level of 2.0%, increasing the likelihood of a 0.25% adjustment in the cost of borrowing at the regulator's July 27 meeting. The official stressed that the economy continues to experience the effects of inflationary shocks since the end of the pandemic and the rapid correction in energy prices. By gradually raising the interest rate from -0.50% last year to 3.50% this month, the regulator has made significant progress, she said, but cannot yet declare a victory over inflation.

In turn, pressure on the positions of the single currency is exerted by macroeconomic statistics from the US, presented yesterday. Revised data on the dynamics of Gross Domestic Product (GDP) for the first quarter revised upward from 1.3% to 2.0%, while analysts did not expect any changes at all.

Support and resistance

On the D1 chart Bollinger Bands are trying to reverse horisontally. the price range is narrowing, reflecting the mixed nature of trading in the short term, the MACD is decreasing, maintaining a relatively strong sell signal (the histogram is below the signal line). Stochastic is showing similar dynamics, rapidly approaching its lows, pointing to the risks of the single currency being oversold in the ultra-short term.

Resistance levels: 1.0891, 1.0930, 1.0969, 1.1000.
Support levels: 1.0850, 1.0800, 1.0765, 1.0700.

EURUSD300623-33.png


EURUSD300623-333.png


Trading tips

Short positions may be opened after a breakdown of 1.0850 with the target at 1.0765. Stop-loss — 1.0891. Implementation time: 1-2 days.

A rebound from 1.0850 as from support followed by a breakout of 1.0891 may become a signal for opening new long positions with the target at 1.0969. Stop-loss — 1.0850.

Use more opportunities of the NPBFX analytical portal: analytics

You can find more actual analytical reviews on other popular currency pairs, metals and CFDs on the NPBFX online portal. Daily analytics with charts, current market prognoses and trading scenarios in the Feed section are available. Get free and unlimited access to the online portal after registering on the official website of NPBFX Company.

If you have any questions about trading instruments, you can always ask an analyst in the online chat on the portal and get a free consultation of an experienced specialist.

Use the current recommendations of analysts on EUR/USD and trade efficiently with NPBFX.
 
USD/CAD: flat trading dynamics in the asset 03.07.2023

Good afternoon, dear forum visitors!

NPBFX offers the latest release of analytics on USD/CAD for a better understanding of the current market situation and more efficient trading.

Current trend

During the Asian session, the USD/CAD pair shows ambiguous dynamics, consolidating near 1.3245.

Market activity at the beginning of the new week remains quite low, as Canadian trading floors are closed on Monday for national celebrations. Key statistics will appear only at the end of the week when the June reports on labor markets will be published: forecasts suggest a drop in the number of new jobs created by the American economy outside the agricultural sector in June, from 339.0K to 200.0K, and the unemployment rate is expected at the previous level of 3.7%. The Canadian report may reflect a poor increase in the number of employed, as in May the figure fell by 17.3K, and the unemployment rate is expected to remain unchanged at 5.2%.

While investors are considering Friday’s statistics from the US and Canada, which, however, did not provide any significant support for currencies. The core price index of spending in May, which has a significant impact on the monetary policy of the US Federal Reserve, slowed down from 4.7% to 4.6% YoY and from 0.4% to 0.3% MoM, which was slightly below the neutral forecasts of analysts. Canada reported a slowdown in gross domestic product (GDP) in April from 0.1% to 0.0%, while markets expected an acceleration of dynamics to 0.2%.

Support and resistance

On the daily chart, Bollinger bands reverse horizontally: the price range is narrowing, reflecting the ambiguous nature of trading in the short and medium term. The MACD indicator is growing, keeping a relatively strong buy signal (the histogram is above the signal line). Stochastic, having reached “80,” tries to reverse into a downward plane, indicating that the US may become overbought in the ultra-short term.

Resistance levels: 1.3250, 1.3300, 1.3350, 1.3400.
Support levels: 1.3200, 1.3150, 1.3100, 1.3050.

usdcad-03072023-5.png


usdcad-03072023-6.png


Trading tips

Short positions may be opened after a breakdown of 1.3200 with the target at 1.3100. Stop loss – 1.3250. Implementation period: 2–3 days.

Long positions may be opened after growth and a breakout of 1.3300 with the target at 1.3400. Stop loss – 1.3250.

Use more opportunities of the NPBFX analytical portal: weekly FOREX forecast

You can learn more about the current situation and get acquainted with the weekly analytical forecast in the "Video reviews" section on the NPBFX portal. Weekly video reviews contain trends, key levels, trading recommendations for such popular instruments as GBP/USD, EUR/USD, USD/CHF, AUD/USD. In order to get free and unlimited access to video forecast and other useful instruments on the portal, you need to register on the NPBFX website.

If you have any questions about trading instruments, you can always ask an analyst in the online chat on the portal and get a free consultation of an experienced specialist.

Use the current recommendations of analysts on USD/CAD and trade efficiently with NPBFX.
 
EUR/USD: inflation in the eurozone fell to the January lows of last year 05.07.2023

Good afternoon, dear forum visitors!

NPBFX offers the latest release of analytics on EUR/USD for a better understanding of the current market situation and more efficient trading.

Current trend

The EUR/USD pair shows near-zero dynamics, holding near 1.0875 and waiting for new drivers to appear on the market.

Investors continue to evaluate the preliminary June data on inflation in the euro area. The Consumer Price Index on a monthly basis rose from 0.0% to 0.3%, and on an annual basis it fell to the lows of January 2022 from 6.1% to 5.5%, while experts expected 5.6%. In turn, the Core CPI on a monthly basis corrected from 0.2% to 0.3% instead of the projected 0.7%, and on an annual basis it went up from 5.3% to 5.4%, falling short of the expected 5.5%. In general, inflationary pressures in the euro area remain stable, while the pace of growth in prices for essential goods is even accelerating.

The day before, the single currency showed a moderate decline, reacting to the emergence of data from Germany, which reflected a decrease in Exports by 0.1% in May after the index added 1.2% in April, while analysts expected -0.5%, and Imports rose by 1.7% after falling by 1.7% a month earlier, while an increase of 3.1% was expected. Against this backdrop, Germany's Trade Surplus in May fell from 18.4 billion euros to 14.4 billion euros, while analysts had expected a figure of 17.0 billion euros.

The focus of investors today will be statistics on S&P Global Services PMI: forecasts suggest that the indicator will remain at 52.4 points in June. Also during the day May data on the dynamics of producer prices are expected to be released.

In addition, investors today will evaluate the minutes of the US Federal Reserve, from which they expect more evidence in favor of further tightening of monetary policy. Currently, more than 87.0% of analysts expect that in July the interest rate will be increased by 25 basis points to 5.50%.

Support and resistance

On the D1 chart, the Bollinger Bands are gradually reversing into a descending plane. The price range expands from below, making way for new local lows for the "bears". MACD is falling, keeping a relatively strong sell signal (the histogram is below the signal line). Stochastic shows oscillatory dynamics in the middle of its area, indicating a mixed nature of trading in the ultra-short term.

Resistance levels: 1.0891, 1.0930, 1.0969, 1.1000.
Support levels: 1.0850, 1.0800, 1.0765, 1.0700.

EURUSD050723-33.png


EURUSD050723-333.png


Trading tips

Short positions may be opened after a breakdown of 1.0850 with the target at 1.0765. Stop-loss — 1.0891. Implementation time: 2-3 days.

A rebound from 1.0850 as from support followed by a breakout of 1.0891 may become a signal for opening new long positions with the target at 1.0969. Stop-loss — 1.0850.

Use more opportunities of the NPBFX analytical portal: analytics

You can find more actual analytical reviews on other popular currency pairs, metals and CFDs on the NPBFX online portal. Daily analytics with charts, current market prognoses and trading scenarios in the Feed section are available. Get free and unlimited access to the online portal after registering on the official website of NPBFX Company.

If you have any questions about trading instruments, you can always ask an analyst in the online chat on the portal and get a free consultation of an experienced specialist.

Use the current recommendations of analysts on EUR/USD and trade efficiently with NPBFX.
 
AUD/USD: analysts are confident that the RBA will continue to raise interest rates at the next meeting 07.07.2023

Good afternoon, dear forum visitors!

NPBFX offers the latest release of analytics on AUD/USD for a better understanding of the current market situation and more efficient trading.

Current trend

The AUD/USD pair is correcting around 0.6623, recovering from an active two-day decline, which led to a short-term update of local lows from June 29.

The development of "bearish" dynamics yesterday was facilitated by data from Automatic Data Processing (ADP) on employment in the US private sector: in June, the indicator added 497.0 thousand after rising by 267.0 thousand in the previous month, while analysts expected only 228.0 thousand new jobs. In turn, today's report on the US labor market may also be better than forecasts. The US Federal Reserve plans to once again raise the interest rate by 25 basis points during the July meeting, and also considers it appropriate to adjust the value one more time before the end of this year.

The Australian dollar was supported the day before by data on Exports, which grew by 4.0% in May after -5.0%, while Imports amounted to 2.0%, as in the previous month, which led to an increase in the trade surplus from 11158.0 million Australian dollars to 11791.0 million Australian dollars, while analysts had expected a decline to 10500.0 million Australian dollars.

Earlier, the Reserve Bank of Australia (RBA) kept the cost of borrowing at 4.10%, the highest level since 2012, although analysts predicted an increase in the rate. Officials said the regulator needed more time to assess the impact of previous rate adjustments on the economy, adding that domestic inflation had peaked to 5.6% in May. Now, leading economists polled by Reuters are confident that the pause in the "hawkish" cycle will end in August, when the RBA raises interest rates by 25 basis points.

Support and resistance

Bollinger Bands on the daily chart show a steady decline: the price range is narrowing from above, reflecting the emergence of flat trading dynamics in the short term. MACD is falling, keeping a relatively strong sell signal (the histogram is below the signal line). Stochastic shows a more confident decline, having reversed downwards a few days ago. The indicator readings signal in favor of the development of "bearish" dynamics in the near future.

Resistance levels: 0.6661, 0.6700, 0.6750, 0.6800.
Support levels: 0.6628, 0.6583, 0.6520, 0.6450.

AUDUSD070723-33.png


AUDUSD070723-333.png


Trading tips

Long positions can be opened after a confident breakout of the level of 0.6661 with the target at 0.6750. Stop-loss — 0.6620. Implementation time: 2-3 days.

A rebound from the level of 0.6661 as from resistance, followed by a breakdown of 0.6628, may be a signal to open new short positions with the target at 0.6520. Stop-loss — 0.6680.

Use more opportunities of the NPBFX analytical portal: analytics

You can find more actual analytical reviews on other popular currency pairs, metals and CFDs on the NPBFX online portal. Daily analytics with charts, current market prognoses and trading scenarios in the Feed section are available. Get free and unlimited access to the online portal after registering on the official website of NPBFX Company.

If you have any questions about trading instruments, you can always ask an analyst in the online chat on the portal and get a free consultation of an experienced specialist.

Use the current recommendations of analysts on AUD/USD and trade efficiently with NPBFX.
 
XAU/USD: statistics on the US labor market supported the position of gold 10.07.2023

Good afternoon, dear forum visitors!

NPBFX offers the latest release of analytics on XAU/USD for a better understanding of the current market situation and more efficient trading.

Current trend

The XAU/USD pair is declining, correcting around 1919.58 after Friday's growth caused by the publication of the June report on the US labor market. Nonfarm Payrolls did not live up to analysts' expectations and increased only by 209.0 thousand after 306.0 thousand in the previous month, while analysts had expected an increase of 225.0 thousand. At the same time, the Unemployment Rate fell from 3.7% to 3.6%, coinciding with the average estimate of analysts, and the Average Hourly Earnings was 4.4% against the previous figure of 4.3%, which was then revised to 4.4%.

Uncertain statistics on the US labor market led experts to revise their forecasts regarding further tightening of monetary policy by the US Federal Reserve. It should be noted, however, that this forecast concerns only the second expected increase in borrowing costs this year. At the July meeting, analysts still expect an interest rate adjustment of 25 basis points with a 90.0% probability. The ongoing uncertainty in the market, expressed in the decline of stock indices on fears about the state of the global economy, is forcing investors to keep protective assets in their portfolios.

On Wednesday, June data on consumer inflation will be published, which may also affect the future decision of the US regulator. In the previous month, the indicator slowed to 4.0%, which is still well above the target levels of 2.0%. In addition, the publication of the so-called "Beige Book", a monthly economic review from the US Federal Reserve, is expected on this day.

Support and resistance

On the D1 chart, Bollinger Bands are gradually reversing horizontally. The price range is narrowing, reflecting ambiguous dynamics of trading in the short term. MACD indicator is growing, while preserving a rather stable buy signal (located above the signal line). Stochastic reversed into a horizontal plane again after a short decline last week. To open new positions, it is necessary to wait for the trade signals to become clear.

Resistance levels: 1930.00, 1940.00, 1952.53, 1960.00.
Support levels: 1915.00, 1907.55, 1900.00, 1892.75.

XAUUSD100723-33.png


XAUUSD100723-333.png


Trading tips

Short positions may be opened after a breakdown of 1915.00 with the target at 1900.00. Stop-loss — 1923.00. Implementation time: 1-2 days.

The return of the "bullish" trend with the breakout of 1930.00 may become a signal for new long positions with the target of 1945.00. Stop-loss — 1920.00.

Use more opportunities of the NPBFX analytical portal: weekly FOREX forecast

You can learn more about the current situation and get acquainted with the weekly analytical forecast in the "Video reviews" section on the NPBFX portal. Weekly video reviews contain trends, key levels, trading recommendations for such popular instruments as GBP/USD, EUR/USD, USD/CHF, AUD/USD. In order to get free and unlimited access to video forecast and other useful instruments on the portal, you need to register on the NPBFX website.

If you have any questions about trading instruments, you can always ask an analyst in the online chat on the portal and get a free consultation of an experienced specialist.

Use the current recommendations of analysts on XAU/USD and trade efficiently with NPBFX.
 
USD/JPY: the American currency is falling ahead of the publication of inflation data 12.07.2023

Good afternoon, dear forum visitors!

NPBFX offers the latest release of analytics on USD/JPY for a better understanding of the current market situation and more efficient trading.

Current trend

The USD/JPY pair continues its steady decline, developing a strong "bearish" trend formed at the beginning of the month. The instrument is testing the level of 139.50 for a breakdown, updating local lows from June 14. At the same time, investors are in no hurry to open new positions in anticipation of today's publication of June statistics on consumer inflation in the US. Forecasts suggest that on an annualized basis, the Consumer Price Index will slow down from 4.0% to 3.1%, approaching the US Fed's target levels, and on a monthly basis, the index could add 0.3% after 0.1% in the previous month. Core CPI excluding Food and Energy may correct from 5.3% to 5.0%.

A more confident decline in the instrument is hampered by macroeconomic statistics from Japan. Machinery Orders fell in May by 7.6% after rising by 5.5% a month earlier, while analysts had expected the figure to add 1.0%. In annual terms, the decline in the indicator accelerated from -5.9% to -8.7%, while the market expected only -0.2%. The Producer Price Index in June was -0.2% after -0.7% in the previous month, while experts expected 0.1%, and the domestic Price index for Corporate Goods adjusted from 5.1% to 4.1%, which turned out to be worse than forecasts at the level of 4.3%.

In a recent interview, Bank of Japan Deputy Governor Shinichi Uchida said that uncertainty about the outlook for inflation remains as it remains above the 2.0% target set by the regulator, and stressed the need for continued monetary easing to support the economy. Higher import prices were the driving force behind the negative dynamics of the Consumer Price Index; however, according to forecasts by the monetary authorities, cost drivers will be leveled in the coming months. Uchida stressed the need for a wage adjustment after a 3.58% increase, the highest level in 30 years, to achieve economic stability.

Support and resistance

Bollinger Bands on the daily chart show a steady decline. The price range is expanding, but it fails to keep pace with the "bearish" activity of recent days. MACD is going down preserving a stable sell signal (located below the signal line). The indicator is trying to consolidate below the zero level. Stochastic, having reached its lows, reversed into the horizontal plane, indicating risks of oversold US dollar in the ultra-short term.

Resistance levels: 140.50, 141.50, 142.54, 143.28.
Support levels: 139.35, 138.50, 137.50, 136.50.

USDJPY120723-33.png


USDJPY120723-333.png


Trading tips

Short positions may be opened after a breakdown of 139.35 with the target at 137.50. Stop-loss — 140.50. Implementation time: 2-3 days.

A rebound from 139.35 as from support followed by a breakout of 140.50 may become a signal for opening new long positions with the target at 142.54. Stop-loss — 139.35.

Use more opportunities of the NPBFX analytical portal: analytics

You can find more actual analytical reviews on other popular currency pairs, metals and CFDs on the NPBFX online portal. Daily analytics with charts, current market prognoses and trading scenarios in the Feed section are available. Get free and unlimited access to the online portal after registering on the official website of NPBFX Company.

If you have any questions about trading instruments, you can always ask an analyst in the online chat on the portal and get a free consultation of an experienced specialist.

Use the current recommendations of analysts on USD/JPY and trade efficiently with NPBFX.
 
AUD/USD: the instrument is preparing to end the week with a strong growth 14.07.2023

Good afternoon, dear forum visitors!

NPBFX offers the latest release of analytics on AUD/USD for a better understanding of the current market situation and more efficient trading.

Current trend

The AUD/USD pair is holding near local highs from June 16, trading at 0.6884. The instrument showed steady growth in the last two sessions, which was the market's reaction to the publication of US statistics.

The annual Consumer Price Index slowed down from 4.0% to 3.0%, while analysts expected 3.1%. Against this background, investors have revised their forecasts for further tightening of the US Federal Reserve's monetary policy and now expect only one interest rate increase during the July meeting, while a scenario with another adjustment of the rate before the end of this year was previously considered. Moreover, traders are returning to the discussion of monetary easing, predicting that the regulator will switch to "dovish" rhetoric in early 2024.

At the same time, the Australian dollar reacted negatively to data on Exports from China, which continue to indicate problems in the recovery of the national economy after the coronavirus pandemic. Against the backdrop of reduced global trading activity and growing geopolitical tensions, the indicator was -12.4% in June after -7.5% in the previous month, declining at the fastest pace in the last three years, while analysts expected -9.5%. In turn, expectations for consumer inflation in Australia have not changed compared to the previous estimate of 5.2%, so the Reserve Bank of Australia (RBA) is still expected to take steps towards tightening monetary policy in the future. Experts estimate the probability of an increase in the cost of borrowing by the regulator at the August meeting below 50.0%, and futures markets estimate this only with a 37.0% probability.

Support and resistance

On the D1 chart Bollinger Bands are rapidly reversing into the ascending plane. The price range is actively expanding, but at the moment it is not keeping up with the development of the "bullish" dynamics. MACD grows, preserving a stable buy signal (located above the signal line). Stochastic, having reached its highs, reversed into a horizontal plane, indicating overbought Australian dollar in the ultra-short term.

Resistance levels: 0.6900, 0.6950, 0.7000, 0.7050.
Support levels: 0.6850, 0.6800, 0.6750, 0.6700.

AUDUSD140723-33.png


AUDUSD140723-333.png


Trading tips

Long positions can be opened after a breakout of 0.6900 with the target of 0.7000. Stop-loss — 0.6850. Implementation time: 1-2 days.

A rebound from 0.6900 as from resistance, followed by a breakdown of 0.6850 may become a signal for opening of new short positions with the target at 0.6750. Stop-loss — 0.6900.

Use more opportunities of the NPBFX analytical portal: weekly FOREX forecast

You can learn more about the current situation and get acquainted with the weekly analytical forecast in the "Video reviews" section on the NPBFX portal. Weekly video reviews contain trends, key levels, trading recommendations for such popular instruments as GBP/USD, EUR/USD, USD/CHF, AUD/USD. In order to get free and unlimited access to video forecast and other useful instruments on the portal, you need to register on the NPBFX website.

If you have any questions about trading instruments, you can always ask an analyst in the online chat on the portal and get a free consultation of an experienced specialist.

Use the current recommendations of analysts on AUD/USD and trade efficiently with NPBFX.
 
General Electric Co.: technical analysis 17.07.2023

Good afternoon, dear forum visitors!

NPBFX offers the latest release of analytics on General Electric Co. for a better understanding of the current market situation and more efficient trading.

Shares of General Electric Co., an American diversified corporation, strengthen the correction, trading at 110.00.

On the daily chart, the price is moving within a narrow ascending channel with dynamic boundaries of 116.00–106.00, approaching its upper limit.

The four-hour chart shows that the upward movement may continue, as the quotes are close to the historical high of 116.00, formed on November 9, 2021.

Technical indicators keep a stable buy signal: fast EMAs on the Alligator indicator are above the signal line, keeping the oscillation range wide, and the AO histogram is forming corrective bars in the buying zone.

GE170723-22.png


Trading tips

Long positions may be opened after the price rises and consolidates above 112.00 with the target at 116.00. Stop loss is 100.00. Implementation period: 7 days or more.

Short positions may be opened after a reversal, reduction, and consolidation of the price below 107.00 with the target at 102.50. Stop loss is 110.00.

Use more opportunities of the NPBFX analytical portal: E-book

If you just recently started to be interested in trading on FOREX and would like to deepen your knowledge, an electronic Beginner's Guide to FOREX Trading will be an excellent helper for you here. The book consists of 5 chapters and reflects fundamental concepts of the foreign exchange market to start successful trading. From the main chapters of the E-book you can learn about the concepts and history of FOREX, currencies and trend lines, technical indicators, types of orders, trading on news, psychology of trading, risk management and much more.

You can read a Beginner's guide to FOREX Trading online or download it free of charge from the NPBFX analytical portal in the "Education" section. In order to get unlimited access to the E-book and other useful instruments on the portal, you need to register on the NPBFX website.

If you have any questions about trading instruments, you can always ask an analyst in the online chat on the portal and get a free consultation of an experienced specialist.

Use the current recommendations of analysts on General Electric Co. and trade efficiently with NPBFX.
 
ExxonMobil Corp.: technical analysis 19.07.2023

Good afternoon, dear forum visitors!

NPBFX offers the latest release of analytics on ExxonMobil Corp. for a better understanding of the current market situation and more efficient trading.

Shares of ExxonMobil Corp., an American oil company, are trading near the level of 100.00 within a local corrective trend.

On the daily chart, the price is moving within a downward corridor with dynamic boundaries of 114.00–93.00.

A downward wave is developing on the four-hour chart, and consolidation below the local low of 100.00 will significantly increase the possibility of further decline, confirmed by the proximity of the asset to 99.00, the low of March 16, which may be broken soon.

Technical indicators reflect a possible continuation of a downward correction: fast EMAs on the Alligator indicator move away from the signal line, and the AO histogram forms correctional bars, falling below the transition level.

XOM190723-11.png


Trading tips

Short positions may be opened after the price drops and consolidates below 99.00 with the target at 93.00. Stop loss – 102.00. Implementation period: 7 days or more.

Long positions may be opened after a reversal, growth, and consolidation of the price above 103.00 with the target at 108.00. Stop loss – 100.00.

Use more opportunities of the NPBFX analytical portal: analytics

You can find more actual analytical reviews on other popular currency pairs, metals and CFDs on the NPBFX online portal. Daily analytics with charts, current market prognoses and trading scenarios in the Feed section are available. Get free and unlimited access to the online portal after registering on the official website of NPBFX Company.

If you have any questions about trading instruments, you can always ask an analyst in the online chat on the portal and get a free consultation of an experienced specialist.

Use the current recommendations of analysts on ExxonMobil Corp. and trade efficiently with NPBFX.
 
Back
Top