• Please try to select the correct prefix when making a new thread in this folder.

    Discuss is for general discussions of a financial company or issues related to companies.

    Info is for things like "Has anyone heard of Company X?" or "Is Company X legit or not?"

    Compare is for things like "Which of these 2 (or more) companies is best?"

    Searching is for things like "Help me pick a broker" or "What's the best VPS out there for trading?"

    Problem is for reporting an issue with a company. Please don't just scream "CompanyX is a scam!" It is much more useful to say "I can't withdraw my money from Company X" or "Company Y is not honoring their refund guarantee" in the subject line.
    Keep Problem discussions civil and lay out the facts of your case. Your goal should be to get your problem resolved or reported to the regulators, not to see how many insults you can put into the thread.

    More info coming soon.

Discuss SolidECN.com

General discussions of a financial company
728x90.png


Bitcoin is Fighting for 24,000 USD Level

Cryptocurrencies gained on the wave of Jerome Powell's comments and the double-dip of the previous 25bp US rate hike. Although the Fed is far from declaring victory over inflation, and Powell hinted at a possible return of inflation if the central bank does 'too little,' markets particularly liked the comments regarding the 'global disinflation' process that has begun. As a result, the largest cryptocurrency is struggling to rise near its summer 2022 highs.​
  • Bitcoin soared above $24,000 but was quickly knocked off these levels by supply and is now struggling to return to levels near the summer 2022 peaks. The strongest gainers are again altcoins including Binancecoin, Algorand, Sushi and Avalanche;​
  • The volume of the cryptocurrency market rose by nearly 30% yesterday on a daily basis, to about $61 billion. The capitalization of the entire market is now around $1.1 trillion;​
  • Meta Platforms' successful report supported sentiment on U.S. index contracts primarily the NASDAQ, with which Bitcoin correlates;​
  • Wall Street is approaching a key day of earnings season, with today's post-session shows from Apple, Alphabet and Amazon likely to affect volatility and investor activity in the evening hours in the cryptocurrency market as well;​
  • If positive sentiment continues traders may increase speculative exposure around Elon Musk's 'favorite cryptocurrency,' Dogecoin in view of recent comments by Tesla's CEO, who suggested integrating Twitter with both traditional finance and cryptocurrencies.​
btc-1.png


The sudden surge of interest in Bitcoin in 2023 caused a massive increase in the average daily number of transactions on the network. Their number has grown exponentially from less than 200,000 to nearly 350,000 in a month, the largest increase in the history of a major cryptocurrency.

btc-2.png


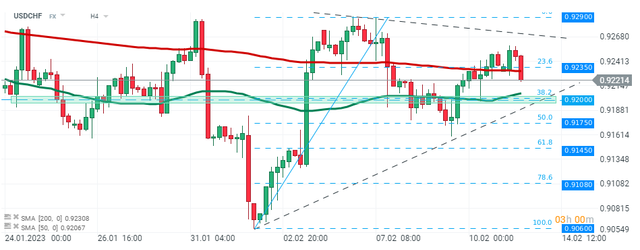
Bitcoin chart, H4 interval. The largest cryptocurrency remains above the SMA200 (red band) and SMA100 (black band), which is also the lower limit of the upward formation. Bitcoin has also reached the vicinity of the summer 2022 maxima, although this is the second time it has been pushed back by supply from levels above $24,000. The 50 SMA average (blue band) is approaching the cross with the SMA200, which in the past has most often heralded a prolonged price rebound, and has also crossed the SMA100 for the first time in nearly 10 months, which was a resistance even during summer of 2022.​

Visit solidecn.com
 
728x90.png


Morning Wrap
  • US indices finished yesterday's trading higher. S&P 500 gained 1.47%, Russell 2000 added 2.06% and Nasdaq rallied over 3%. Dow Jones was a laggard with 0.11% drop​
  • US index futures dropped in the after-hours trading following earnings releases from Apple, Amazon and Alphabet​
  • Apple dropped 3.2% in the after-hours trading. Company reported a 5% sales drop to $117.15 billion (exp. $121.10 billion) and almost 11% YoY drop in EPS, to $1.88 (exp. $1.94). CEO Tim Cook said that strong dollar, production problems in China as well as the overall macroeconomic environment were to blame for poor results​
  • Amazon traded 5% lower in the after-hours trading. Company reported Q4 revenue at $149.2 billion (exp. $145.4 billion) and EPS at $0.03 per share. Sales growth in cloud business slowed from 27.5 to 20% YoY in Q4 2022. Company provided a rather light guidance pointing to a 4-8% sales growth in Q1 2023​
  • Alphabet dropped 4.6% in the after-hours trading. Company missed sales and earnings expectations with revenue coming in at $76.05 billion (exp. $76.5 billion) and EPS reaching $1.05 (exp. $1.18). Alphabet's sales grew at a pace of just 1% YoY in Q4 2022, marking the slowest growth since Q2 2020​
  • Indices from Asia Pacific traded mixed. Nikkei, S&P/ASX 200, Kospi and Nifty 50 gained while indices from China and Vietnam traded lower​
  • DAX futures point to a slightly higher opening of the European cash session today​
  • US and Canadian militaries are monitoring a Chinese spy balloon that is currently flying above continental United States. It was decided not to shoot it down to prevent collateral damage from falling debris​
  • Chinese Caixin services PMI came in at 52.9 in January (exp. 51.6)​
  • BoJ Governor Kuroda said that Bank of Japan has a 8.8 trillion JPY unrealized loss from bonds it bought as part of yield curve control mechanism​
  • Cryptocurrencies are trading mixed today. Dogecoin gains 0.2%, BitcoinCash adds 0.8%, Bitcoin drops 0.1% and Ethereum trades 0.8% down​
  • Energy commodities trade lower - oil drops 0.2% while US natural gas prices traded 0.9% lower​
  • Precious metals trade higher - gold gains 0.2%, silver trades 0.3% higher and platinum adds 0.5%​
  • NZD and JPY are the best performing major currencies while EUR and CAD lag the most.​

morning-wrap.png


Nasdaq-100 (US100) had another solid session yesterday. However, things turned sour after the close of the Wall Street cash session as Apple, Amazon and Alphabet disappointed with earnings reports. US100 took a hit and pulled back around 2.5% off yesterday's highs.​


Visit solidecn.com
 
728x90.png


EURJPY Technical Analysis

The EURJPY pair started to form new correctional bullish wave to surpass the additional barrier 141.75 and notice recording some gains by touching 142.85 level.

eurjpy_1.png


Continuing to consolidate above the breached barrier reinforces the chances of renewing the correctional attempts for now, to expect targeting 143.60 and 144.00 levels, while gathering the additional negative momentum and crawling below 141.75 will activate the bearish track again, to increase the chances of crawling towards 141.10 followed by repeating the pressure on 140.25 obstacle.

The expected trading range for today is between 141.75 and 143.60.​


Visit solidecn.com
 
728x90.png


Platform

The popular trading platforms are narrowed to a few. We chose the newest and the most advanced platform that is available in the market, the MetaTrader 5!

Why MetaTrader 5?

Contrary to commune belief, MetaTrader 5 is not an upgrade of MT4. The MT4 platform was developed for trading in the Forex environment, whereas MT5 was coded for CFDs, Stocks, and futures access. To be short, MetaTrader 5 is for more experienced and advanced traders, but before we go with the MT5, at Solid ECN we ran a survey of the traders we know, and found out that most rookies and novice users are already with the MT5 platform, and for the first time the MT5 users have surpassed the MT4’s!

Major differences
  • MT4 has 9-time frames, whereas MT5 offers 21-time frames. More time frames assist technical analyzers to have a better conception of the market movement.​
  • MT 4 has 4 pending orders, whereas MT5 provides 6 types of pending orders.​
  • MT 4 doesn’t have the market depth, but MT5 market depth is accessed within the chart.​
  • MT5 has the Economic calendar on default.​
  • MT4 has 4 types of pending orders, whereas MT5 holds 6 types.​
  • MT4 allows hedging only, whereas MT5 allows both hedging and netting on request.​
  • MT5 has 38 technical indicators, 44 analytical objects and unlimited charts​
  • Partial order filling policies (fill/kill or cancel return) is another advantage of the MT5 for advanced traders.​
  • The strategy tester of the MT5 platform is multi-threaded but MT4 is single-threaded.​
MetaQuote corporation has been sending announcements about stopping MT4 updates. Therefore, we believe it was in the best interest of all parties to go with the MT5 platform!

 
728x90.png


Chart of the Day - USDCAD

USDCAD has been trading in a descending triangle pattern since October 2022. The pair failed to break above the resistance zone ranging below the 1.3500 area yesterday and can be seen pulling back today. USDCAD is expected to get more volatile later today as traders will be offered comments from both - Fed Chair Powell (5:40 pm GMT) and BoC Governor Macklem (5:45pm GMT).

Solid jobs data led some to believe that the Fed may switch back to a 50 bp rate hike at its next meeting and Powell's comments will be key in shaping expectations further. Macklem will deliver a speech titled "How monetary policy works" at CFA Society Quebec. Speech will surely touch on the topic of monetary policy as the title implies. More importantly, Macklem will answer reporters' questions afterwards at 7:00 pm GMT and it could be a chance for more details on the current policy outlook.

usdcad_1.png


USDCAD is trading around 1% below upper limit of the triangle pattern and around 1.2% above the lower limit. While today's speeches from BoC and Fed heads may not lead to an immediate breakout, they could set the tone for the coming days, which may lead to a breakout. A textbook range of the breakout from the pattern in either direction is 720 pips.​


Visit solidecn.com
 
728x90.png


Chart of the Day - USDDIX

The dollar index fell below 103 on Wednesday, extending yesterday's losses sparked by Powell’s latest comments. Head of the Fed said that more rate hikes will likely be needed and that the terminal rate could peak higher if the jobs market remains strong, however underlined that disinflation has begun. Traders now look ahead to more Fed commentary on Wednesday for further guidance.

usddix.png


From a technical point of view, USDIDX bounced off key resistance at 103.40, which is marked with upper limit of the local 1:1 structure, previous price reactions,50 SMA (green line) and upper limit of the descending channel. As long as price sits below the aforementioned level, the main sentiment remains bearish. Nearest major support to watch is located around recent lows at 100.60. On the other hand, if buyers manage to regain control, upward correction may be launched towards resistance at 105.30, which coincides with 38.2% Fibonacci retracement of the upward move launched in January 2021.​


Trust Pilot Score 4.8
 
728x90.png


Bitcoin is Trying to Maintain Momentum Above $23,000

Bitcoin is trading near $23,000 today. After Powell's speech yesterday, cryptocurrencies were unable to continue their rally despite the initial euphoria. The mood among cryptocurrencies is mixed, with the biggest loser being Graph which gained nearly 50% yesterday on the AI trend. Let's take a look at some key 'on-chain' indicators like NUPL and SOPR, and see how the balance of short (STH) and long-term (LTH) BTC addresses:

btc-1_1.png


NUPL (Net Unrealized Profit/ Loss Ratio) indicator tracks the ratio of unrealized profit/loss and shows that the rally has lifted Bitcoin above the average purchase price of the broad market, making the 'average' BTC holder back in profit. Compiling the duration of the negative NUPL in all the bull markets, we observe a historical similarity between the current cycle (166 days) and the bear markets of 2011-12 (157 days) and 2018-19 (134 days). However, the 2015-2016 bear market stood out under this, experiencing a dominance of unrealized losses twice as long as the current one. This could serve as a potential warning signal should BTC return below $20,000.

btc-2_1.png


The ratio between the total unrealized gain held by the market and its annual average could be another indicator of momentum. The momentum metric is currently approaching the equilibrium point and shows similarities to the recent phases of the 2015 and 2018 bull markets. Confirmed breakouts above the equilibrium point (1 - the horizontal red line) coincided with a change in the market's profit structure in the past foreshadowed a longer recovery in sentiment. The length of time elapsed below the equilibrium point was similar in all major bear markets, but reaching a key on-chain level may foreshadow supply resistance - the index is struggling to climb above resistance on a sustained basis, which underscores how important it is to overcome $24,000 on a sustained basis.

btc-3.png


The SOPR (Spent Output Profit Ratio) indicator can be used to check the profit aggregated by different groups of BTC holders. For short-term traders (STH, in red), we see that the STH-SOPR is currently trading above the 1.0 value, showing the first sharp increase in profitability since March 2022. This reflects the large amount of BTC purchased at lower prices in recent months, which can be sold at a profit if sentiment weakens further.

btc4.png


It is positive that not only short-term investors but the broader market also gained after a very deep and prolonged period of losses. However, assessing the LTH (Long Term Holder) group of long-term investors, we can see that the stressful situation has continued nd since the LUNY implosion. Although the group is still, on average, in a loss, there are the first signs of recovery, including the potential formation of an upward LTH-SOPR trend. During the 2018 bull market, long-term investors averaged 291 days in losses; today it's about 265 days.

btc-4.png


Bitcoin, W1 interval. The major cryptocurrency is still struggling to climb above the 200-week average, which has turned into resistance from its historic, very strong support in 2022.​


Visit solidecn.com
 
728x90.png


Chart of the Day - USDCHF

Swiss franc strengthened on Monday after the annual inflation rate in Switzerland jumped to 3.3% YoY in January, the highest reading since September 2022, from 2.8% in the prior month and above analysts' estimates of 2.9%, which should support the case for further SNB policy tightening. Pair may experience increased volatility ahead of tomorrow’s US inflation data that could reinforce the case for more Federal Reserve interest rate hikes.

usdchf.png


From technical point of view, the pair broke below the local support at 0.9235, which is marked with previous price reactions, 23.6% Fibonacci retracement of the latest upward wave and 200 SMA (red line). As long as price sits below, downward move may deepen towards next major support at 0.9200, which coincides with the lower limit of the triangle formation, 50 SMA (green line) and 38.2% retracement.​


Visit solidecn.com
 
728x90.png


EURUSD Attempts to Rebound

Fed's Bowman pointed out today that the US central bank still has a lot of work to do in order to achieve financial stability. Bowman emphasizes that further tightening of monetary policy is needed in order to achieve the desired level of inflation. Bowman also points out that interest rates need to reach restrictive levels and will stay there for a long time.

eurusd-n.png


Volatility is rather limited today as the market awaits tomorrow’s US CPI report. EURUSD rebounds despite the fact that yields are rather muted, which is attributed to good market sentiment.​


Visit solidecn.com
 
728x90.png


Chart of the Day - GBPUSD

The GBPUSD pair erased most of the early gains as investors digested latest figures from the UK labour market. The UK Office for National Statistics Office for National Statistics reported that the unemployment rate remained unchanged at 3.7% in December as widely expected, while the number of people claiming unemployment-related benefits fell by 12.9K in January. Moreover, December reading was also revised down sharply to -3.2K as compared to the 19.7k rise estimated originally. The number of people in work grew by 74k in Q4 of 2022, easily topping analysts’ projections of a 40k increase. The number of part-time employees jumped to the highest level since the September-November period of 2021, however the number of full-time employees decreased but still above pre-pandemic levels. On self-employment, part-time self-employed increased, while full-time self-employed remained low.

gbpusd_4.png


On the other hand, in November 2022 to January 2023, job vacancies fell by 76K to 1,134K, the seventh consecutive quarterly fall, reflecting uncertainty across industries, as survey respondents continue to cite economic pressures as a factor in holding back on recruitment.

Meanwhile US dollar trades slightly lower, extending yesterday's decline, however further downside move may be capped as traders might refrain from placing aggressive bets ahead of the crucial US consumer inflation figures, which will be released at 1:30 pm BST.

From a technical point of view, GBPUSD rose sharply in the morning after the release of UK data, however the pair pulled back after buyers failed to break above the 100 EMA (purple line). If sellers manage to regain full control, then declines may deepen towards local support at 1.2075. On the other hand, if bulls manage to regain control, next key resistance to watch can be found around 1.2215.​


Visit solidecn.com
 
Back
Top