• Please try to select the correct prefix when making a new thread in this folder.

    Discuss is for general discussions of a financial company or issues related to companies.

    Info is for things like "Has anyone heard of Company X?" or "Is Company X legit or not?"

    Compare is for things like "Which of these 2 (or more) companies is best?"

    Searching is for things like "Help me pick a broker" or "What's the best VPS out there for trading?"

    Problem is for reporting an issue with a company. Please don't just scream "CompanyX is a scam!" It is much more useful to say "I can't withdraw my money from Company X" or "Company Y is not honoring their refund guarantee" in the subject line.
    Keep Problem discussions civil and lay out the facts of your case. Your goal should be to get your problem resolved or reported to the regulators, not to see how many insults you can put into the thread.

    More info coming soon.

Discuss SolidECN.com

General discussions of a financial company
Trade with True ECN Broker
www.solidecn.com

> 1:1000 Leverage
> Spread from Zero
> %40 Deposit Bonus
> Fast Withdrawal
> Lightening Execution
> Scalp > Hedge > News Trading Allowed
> Negative Balance Protection​

NZDUSD
The market is updating November highs​

Current trend
The pound is trading upward against the US currency during the morning session, renewing new local highs from November 4 and testing 1.3645 for a breakout.

Significant support for the instrument is still provided by the expectations of a further increase in interest rates from the Bank of England, which is still ahead of the US Fed, having adjusted its monetary policy in December. In addition, investors are positive about the success of the British government in overcoming the next wave of coronavirus. The country has managed to avoid the return of large-scale restrictions, while, despite high incidence rates, the UK has not faced an overload of the health care system due to high herd immunity and low fatality of the Omicron strain.

But the macroeconomic statistics from the UK published yesterday left much to be desired. BRC Like-For-Like Retail Sales fell sharply from 1.8% to 0.6%, which turned out to be worse than analysts' average forecasts. At the end of the week, investors expect the publication of a large block of macroeconomic statistics from the UK on the dynamics of GDP and industrial production in November.

Support and resistance
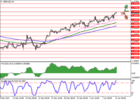
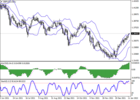
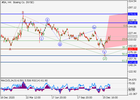
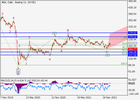
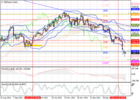
Bollinger Bands in D1 chart show stable growth. The price range is expanding but it fails to conform to the surge of "bullish" sentiments at the moment. MACD grows, preserving a stable buy signal (located above the signal line). Stochastic, having reached its highs, reversed into a horizontal plane, indicating strongly overbought GBP in the ultra-short term.

Resistance levels: 1.3650, 1.37, 1.375, 1.38.
Support levels: 1.36, 1.355, 1.35, 1.346.​

nzdusd_analysis_1212022_1.pngnzdusd_analysis_1212022_2.png
 
XRP/USD Technical Analysis

www.solidecn.com
True ECN Broker​

> 1:1000 Leverage
> Spread from Zero
> %40 Deposit Bonus

Current trend
XRP/USD continues to trade within the long-term descending channel. This week the price reached monthly lows around 0.6940, after which it made an attempt to growth, the target of which may be the level of 0.8230 (the center line of Bollinger Bands); however, in general, the upside potential is limited, as the general downtrend continues.

The continuation of the decline seems more probable. In case of a breakdown of 0.7500 (Fibonacci retracement 61.8%), the price can reach the levels of 0.6836 (Murray [-1/8]) and 0.5860 (Murray [-2/8]). The downward reversal of Bollinger Bands and an increase in the MACD histogram in the negative zone confirm the continued downtrend; however, an upward reversal of Stochastic does not exclude the continuation of short-term growth.

Support and resistance
Resistance levels: 0.8230, 0.9100, 0.9766.
Support levels: 0.7500, 0.6836, 0.5860.​

xrpusd_technical analysis.png
 
Nasdaq 100: the market is preparing for the start of the reporting season
www.solidecn.com
True ECN Broker​

> Leverage 1:1000
> Spread from Zero
> %40 Deposit Bonus
> Fast Withdrawal

Current trend
Nasdaq 100 quotes are correcting in an uptrend, regaining some of the losses of the previous week, and are trading at 15851.0. The main reason for the change in the trend in the asset was the correction in the domestic bond market.

The yield on 10-year US Treasuries fell to 1.732% from 1.765%. Conservative 20-year bonds, on the other hand, are trading at 2.119%, down 2.153% at the start of the week. In addition, the lack of a clear plan for changes in current monetary policy by the US Fed gives the tech sector hope that interest rates will remain low for a while.

Corporate reporting for 2021 kicks off next week, and analysts predict that most US tech companies will report significant earnings. For example, Procter & Gamble Co. earnings per share are expected to rise to 1.66 dollars from 1.61 dollars a quarter earlier, and Bank of America Corp. is projected to post revenues above 22.0B dollars.

Support and resistance
The index quotes are traded within the global uptrend, correcting within the local Expanding Formation pattern. Technical indicators are in the state of a sell signal, but they do not exclude a correction: the range of EMA fluctuations on the Alligator indicator started narrowing, and the histogram of the AO oscillator is trading in the sale zone and ready to form ascending bars.

Support levels: 15565, 15175.
Resistance levels: 16000, 16600.

nasdaq_analysis.png
 
Solid ECN Securities | True ECN Broker
www.solidecn.com


USDCAD Wave Analysis

The pair is in a correction and may grow.

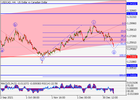
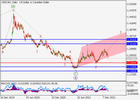
On the daily chart, a downward correction developed as the wave of the higher level 4, and the development of the fifth wave 5 started, within which the wave (1) of 5 forms. Now, the third wave of the lower level 3 of (1) is developing, within which the wave i of 3 has formed, and a local correction is ending as the wave ii of 3. If the assumption is correct, after the end of the correction, the pair will grow to the levels of 1.3200–1.3410. In this scenario, critical stop loss level is 1.2285.​

usdcad_wave analysis_1.pngusdcad_wave analysis_2.png
 
Trade Boeing with Solid ECN Securities
True ECN Broker
www.solidecn.com

> 1:1000 Leverage
> Spread from Zero
> %40 Deposit Bonus
> Fast Withdrawal
> Lightening Execution
> Scalp > Hedge > News Trading Allowed
> Negative Balance Protection​

Wave Analysis

The price may grow.

On the daily chart, the first wave of the higher level (1) of C formed, and a local correction developed as the second wave (2) of C, which took a shape of an irregular flat. Now, the wave C of (2) has formed, and the development of the third wave (3) of C has started. If the assumption is correct, the price will grow to the levels of 255.00–278.82. In this scenario, critical stop loss level is 183.77.

ba_analysis_1.pngba_analysis_2.png
 
Trade Exxon Mobil with Solid ECN Securities
True ECN Broker
www.solidecn.com

> 1:1000 Leverage
> Spread from Zero
> %40 Deposit Bonus
> Fast Withdrawal
> Lightening Execution
> Scalp > Hedge > News Trading Allowed
> Negative Balance Protection


Exxon Mobil, a steady uptrend

Current trend

The stocks of Exxon Mobil Corp. ended last week at a new 52-week high. From a December 3-month low, the issuer grew by more than 18.5%, up 12.57% over the past week, while the S&P 500 fell by 2.12%.

Since the beginning of 2022, macroeconomic news has supported the instrument. The Food and Drug Administration (FDA) has issued a statement that the Omicron variant causes less severe disease, and the epidemic wave will quickly peak and subside by February. A strong December report on employment in the private sector, with the number of new jobs in 807K people, was twice as high as market expectations. At the same time, an increase in daily oil production by 400K barrels since February as part of the recent OPEC+ meeting increased investor confidence in market stability.

Also, last week Exxon Mobil Corp.'s biggest skeptic, Truist Financial Corp. analyst Neal Dingmann, upgraded its stock rating to Neutral, raising its price target from $50 to $65. The raise was based on his more favorable forecast for a dividend increase and share repurchases in 2022.

Support and resistance
Stocks are showing a steady uptrend, renewing the key extremes. Currently, the quotes are consolidating within the range of 68.00–71.50. There is potential for further growth. Indicators indicate the strength of buyers: the price has consolidated above MA (50) and MA (200), the MACD histogram is in the positive zone. It is better to open the positions from the key levels.

Comparative analysis of the company's multipliers and companies-competitors in the industry indicates the neutrality of the asset.

Resistance levels: 71.50, 75.00, 78.00.
Support levels: 68.00, 66.00, 63.50.​

xom.png
 
Trade Pfizer Inc with Solid ECN Securities
True ECN Broker
www.solidecn.com

> 1:1000 Leverage
> Spread from Zero
> %40 Deposit Bonus
> Fast Withdrawal
> Lightening Execution
> Scalp > Hedge > News Trading Allowed
> Negative Balance Protection


Current trend
Pfizer Inc. stocks show an upward trend in trading, being above the 56.00 level.

The issuer's quotes continue to trade with strong volatility, as the asset is one of the most popular on exchanges in the USA. The recent announcement of a reduction in the number of employees in the field of direct sales caused the correction of the trading instrument, but the company reassured investors, saying that this would affect only a small group of 100-150 employees, half of whom would be offered new jobs in other areas.

Pfizer Inc. will publish its report for Q4 2021 on February 8, and according to analysts' forecasts, quarterly revenue will be about 24.2B dollars, and total annual revenue may exceed 80B dollars. As for the dividend policy, the register of shareholders closes on January 27 for the next quarterly payment on ordinary shares of 0.40 dollars, scheduled for March 4, 2022. The yield may be about 2.82% per annum.

Support and resistance
The company's quotes continue to trade in a global uptrend, correcting downwards within the framework of a local movement. Technical indicators are in the state of a global buy signal, and are working out a local correction: the fast EMAS of the alligator indicator are still above the signal line, and the histogram of the AO oscillator is trading at the transition level, forming alternating bars.

Resistance levels: 58.90, 63.00.
Support levels: 54.90, 50.80.
pfe.png
 
Trade Cryptocurrencies with True ECN Broker
Solid ECN Securities
www.solidecn.com

> 1000 Leverage
> Fast Withdrawal
> %40 Deposit Bonus
> Negative Balance Protection


ETH/USD, Technical Analysis

Current trend

Last week, the ETH/USD pair actively corrected downwards as part of the general market trend.

The price dropped to the lows since July last year (2155.95), and after a slight recovery of positions, it stabilized around 2400.00. Quotes have consolidated below 2500.00 (Murrey [0/8], Fibonacci retracement 50.0%), which opens the way for them to further decline to the levels of 1875.00 (Murrey [–2/8], Fibonacci retracement 61.8%) and 1710.00 (lows of June last year).

In general, the current downtrend remains in force, which is confirmed by a downward reversal of Bollinger bands and an increase in the MACD histogram in the negative zone. Stochastic is preparing to leave the oversold zone, which does not exclude growth up to the level of 3000.00 , but it is unlikely to lead to a break in the current trend.

Support and resistance
Resistance levels: 2500, 3000, 3437.
Support levels: 1875, 1710.​

ethusd.png
 
Free Market Analysis Subscription
www.solidecn.com
forum_1.png


Solid ECN team delivers professional market analysis with the both fundamental and technical aspects on daily basis on 6 platforms.

> Website
> Email
> Linkedin
> Twitter
> Instagram
> Facebook

Feel free to sign up for a demo account to receive the latest market update to your inbox, or follow us on social networks.

Our analysis helps our clients to trade more efficient, cut loses, and find the entry and exit points easier.
 
Back
Top