Forex Sentiment Analysis

Forex sentiment refers to the overall feeling the market participants have about the performance of a currency pair. It is a useful way of gauging the feeling or tone of the market and then making appropriate trade decisions.
Every trader participating in the forex market has his or her own opinion about the direction the market is likely to take. And, the decisions they make—whether to place buy or sell orders—is based on these views.
Ultimately, the predominant direction the market is going to take is based on the combination of the opinions of all the market participants.
For example, if the dominating sentiment is bullish for a currency pair, it will rise in value. Note that using sentiment analysis will not provide you with specific entry and exit places for every trade—but it will assist you to know whether to ride with the flow or not.
Certainly, you can use sentiment analysis with technical analysis and fundamental analysis to siphon your signals and improve entry and exit decisions.
Importance of Sentiment Analysis
Knowing how to use sentiment analysis can be a vital tool in your toolbox. Sentiment forms a significant component of what drives movements in the forex market.
For example, if 90 traders have placed buy orders on the GBP/USD and 10 traders have placed sell orders on the currency pair, it shows the sentiment to be 90% overall in favor of buy positions.
In the forex market, if traders have a positive attitude on a currency pair, the sentiment can also be positive. On the other hand, if the attitude is poor, then the sentiment is likely to be negative.
As a trader, it should be your responsibility to determine the predominant emotions in the market. Are investors bullish about the economic situation of a country? Are the indicators suggesting positivity for the currency?
Remember that you cannot dictate to the market what it should do. However, what you can do is make a calculated response to what is taking place in the market.
Including sentiment analysis in your trader’s toolbox will assist you to decide whether to ride on the same bandwagon with everybody or wait for your turn.
If you decide to ignore sentiment analysis, you may make losses. It is what you need to become profitable in your trading.
Forex Sentiment Tools
Forex sentiment analysis entails identifying traders’ positions so that you can try to know how they are thinking and make appropriate trade decisions.
In other financial markets, like the stocks market, participants can assess the volume traded to gauge the prevailing sentiment.
If a stock price has been on an uptrend, but volume is decreasing, it could indicate overbought market conditions.
Likewise, if a plummeting stock abruptly reversed its move because of increased volume, it could point to shifting market sentiment, from bearish to bullish.
However, because forex trading takes place over-the-counter, the absence of a centralized market complicates knowing the volume of every currency traded.
Nonetheless, here are two common tools that forex traders can use to measure market sentiment.
- Contrarian indicators
- Commitment of Traders report
1. Contrarian indicators
The contrarian trading strategy involves placing orders that are against the present market sentiment. Contrarian traders mostly place long orders when a currency is weak and short orders when it’s strong.
These traders take advantage of situations when the market has attained a level of saturation. If traders are propelling prices higher, it could result in overpriced assets. Similarly, if the market is enjoying a selling spree, it could present opportunities to buy at a lower price.
Essentially, the contrarian approach posits that whenever market sentiment reaches extreme levels—such as when the number of long positions overwhelmingly exceed short positions and vice versa—then the trend is regarded as exhausted and thus a price reversal is imminent.
For instance, a trader can place a buy order on a currency pair when growing pessimism has made its price to plummet to extremely low levels.
On the other hand, when the price has increased to unsustainable levels because of diminishing bullish pressure, the trader can place a sell order.
Contrarian traders usually go against the basic rule of trading: always trade according to the predominant trend. If the market has been strongly trending in a particular direction, contrarians believe that it is now time to reverse its move—and therefore will not place trades according to the trend.
However, when trading using this strategy, you should remember that sometimes the market shows extreme conditions but continues with the primary trend, without any reversal in sight.
Therefore, you need to be disciplined and carry out a comprehensive analysis of the market before using this approach for trading.
Several technical contrarian indicators are available for gauging the market sentiment. For example, a typical technical indicator that can identify overbought and oversold market conditions is the Relative Strength Index (RSI).
The RSI comprises of a single line, which fluctuates within a scale of 0 to 100. The scale is usually categorized as follows:
- 0 to 30: Oversold territory
- 30 to 70: Neutral territory
- 70 to 100: Overbought territory
As the RSI fluctuates between these regions, it assists traders to identify tops and bottoms in the market.
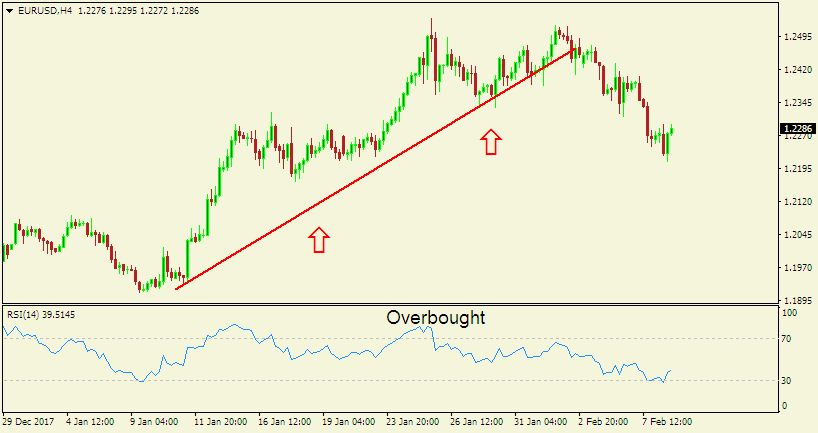
For example, here is a 4-hour chart of EUR/USD.
As seen on the chart above, EUR/USD was strongly trading upwards and the RSI reading was mostly above the 70 mark.
Therefore, it signaled the diminishing buying pressure in the market. Consequently, the pair then reversed its upward move and started trading downwards.
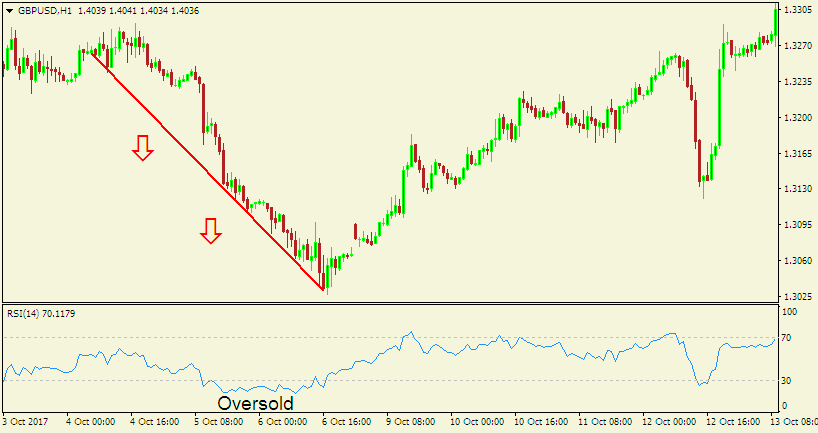
Here is another example of a 1-hour chart of GBP/USD.
As seen on the chart above, the currency pair was trading downwards, and the RSI dropped below the 30 mark, indicating the reducing selling pressure and an imminent reversal.
Afterward, the price of the GBP/USD reversed upwards.
2. Commitment of Traders report
The Commitment of Traders (COT) report is provided by the Commodity Futures Trading Commission (CFTC) every Friday. It is based on the net long and short positions held by traders in the Chicago IMM exchange as of the previous Tuesday.
Although the report is not real-time, the data is still very valuable to assist forex traders who want to use it for gauging the prevailing market sentiment and taking intermediate and long-term positions.
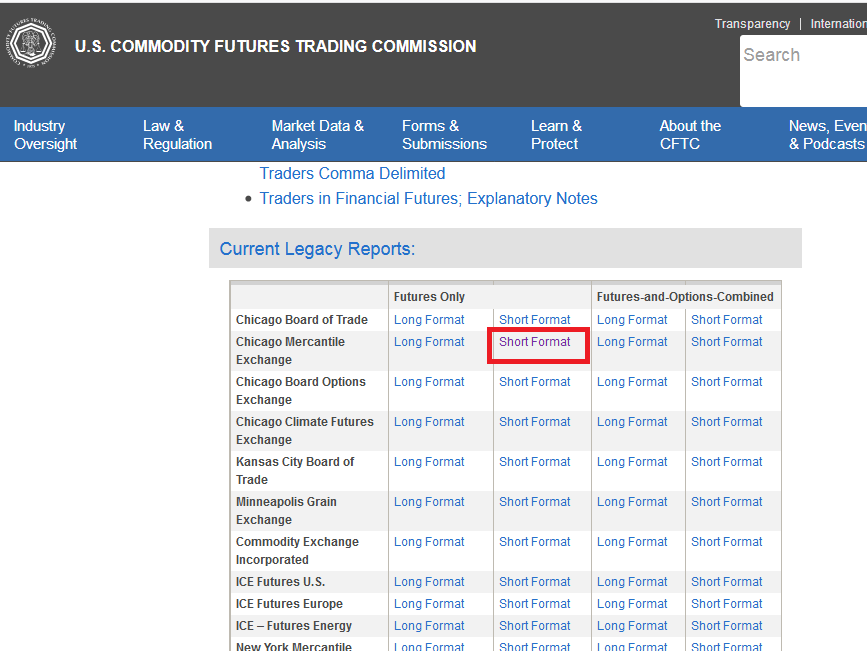
To access the report, click this link to CFTC’s website.
Then, scroll down to the “Current Legacy Reports” section, and click on “Short Format”, as highlighted below.
You will then be directed to a report with a lot of information. To retrieve the specific data you want, just do a search on the report.
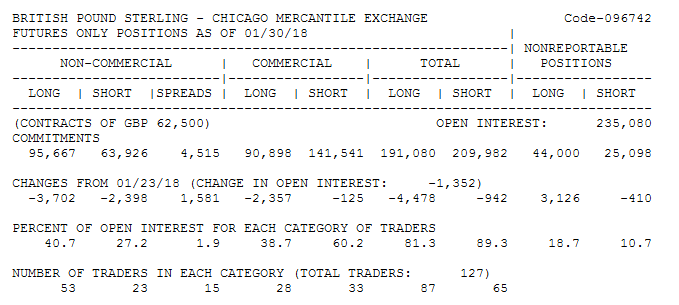
For example, here is the data for the British pound.
Let’s explain the meaning of the essential categories in the report.
- Non-commercial: This category refers to a combination of the positions held by individual traders, hedge funds, and financial corporations. They are mainly interested in speculative gains.
- Commercial: This refers to large entities that rely on the futures market for hedging against investment uncertainties.
- Nonreportable positions: This refers to the number of positions that are below the reporting standards stipulated by the CFTC.
- Long: This is the number of positions CFTC reports to be buying futures contracts.
- Short: This is the number of positions CFTC reports to be selling futures contracts.
- Open interest: This refers to the number of unexercised or undelivered contracts.
- Number of traders: This shows the number of traders required to inform the CTFC about their trades.
Understanding the COT report
The COT report gives positions taken by three types of traders: the commercial traders, the non-commercial traders, and the small traders.
The commercial traders are hedgers who are mainly interested in protecting their investments from market uncertainties. For example, financial institutions that intend to safeguard themselves from the unexpected rise or fall of currency prices are regarded as commercial traders.
A vital attribute of commercial traders is that they tend to embrace a bullish stance at market bottoms and a bearish stance at market tops.
The non-commercial traders are the big speculators who are interested in making profits from the market. These traders can hold large accounts that can make the futures market to move swiftly.
An essential characteristic of the non-commercial traders is that they are strong trend followers. Thus, they tend to place buy orders when the market is trending upwards and sell orders when it is moving downwards. The big speculators will continue placing more trades until the market reverses.
Lastly, the small traders are the hedge funds and individual traders operating smaller retail trading accounts. The small speculators are usually trading without considering the prevailing market trend.
Since retail traders often place anti-trend trades, they get fewer returns as compared to non-commercial or commercial traders. Nonetheless, when these small players want to enter trades according to the trend, they often look for market tops or bottoms.
How to use the COT report for trading
Because the COT report is released weekly, its ability to gauge the market sentiment is essential for making intermediate and long-term trade decisions.
One technique for using the report for trading is to identify extreme net long positions or extreme net short positions.
Spotting these positions could indicate the weakening of the prevailing trend, and an imminent market reversal.
To assist you easily interpret the COT report and identify market sentiment extremes, you can use an indicator.
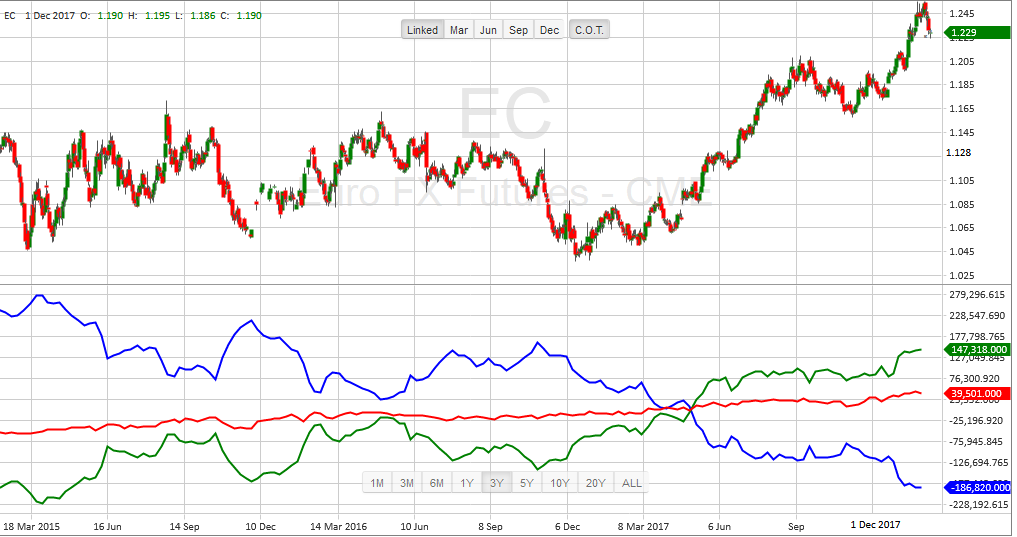
For example, here is a 3-year chart from TimingCharts.com of Euro FX futures with a COT indicator applied.
The COT indicator has three lines: blue (commercial traders), green (non-commercial traders), and red (retail traders).
Now, let’s ignore the other lines and focus on the green one. As earlier mentioned, the non-commercial traders are the big speculators who place positions according to the dominant market trend.
Even though these large speculators have big account sizes, they cannot withstand experiencing losses for a long time. Therefore, if an overwhelming number of speculators are on the same side, it is highly likely that a reversal will take place.
Let’s look at what happened around 6th December 2016 when the market was trending downwards. The net short positions of the big speculators were at extreme levels, so did the value of the currency.
Afterward, the market reversed and started trending upwards. If you could have used the COT indicator to spot the reversal, you could have booked hundreds of pips in the subsequent months.
Besides, you can also use the COT indicator to spot market tops and bottoms—since entering trades when the sentiment is extreme is usually more profitable.
As you can see on the chart above, the green line (non-commercial traders) and the blue line (commercial traders) usually move oppositely.
Whereas the commercial traders are bearish whenever the market is trending upwards, the non-commercial traders are bullish.
As such, the speculative positioning of non-commercial traders can be used to identify the prevailing market trend. Likewise, the hedging positioning of commercial traders can be used to detect market reversals.
If commercial traders continue placing buy orders whereas non-commercial traders continue placing sell orders, a market bottom could ensue.
On the other hand, if commercial traders keep placing sell orders whereas non-commercial traders continue placing buy orders, a market top could ensue.
It’s not easy to identify the specific location where extremes in market sentiment will take place. Thus, it’s prudent to wait for confirmations of the reversals before placing trades.
Conclusion
Sentiment analysis is a powerful technique you can combine with other types of analysis, such as fundamental analysis or technical analysis, to assist you to identify profitable trading opportunities.
It allows you to know other traders’ positions so that you can take advantage of the information and make appropriate trade decisions.
If you can appropriately decipher the current market sentiment, you can use the information to your advantage—such as confirming the prevailing trend or looking for a potential market reversal.
If used correctly, sentiment analysis can make the difference between success and failure in the forex market.
Author Profile

Fat Finger
My name is Phat Fin Ge, but most people just call me Fat Finger or Mr. Finger.
Many years ago, I was a trader on the Hong Kong Stock Exchange. I became so successful that my company moved me to their offices on Wall Street. The bull market was strong, but my trading gains always outperformed market averages, until that fateful day.
On October 28th, 1929, I tried to take some profits after Charles Whitney had propped up the prices of US Steel. I was trying to sell 10,000 shares, but my fat finger pressed an extra key twice. My sell order ended up being for 1,290,000 shares. Before I could tell anyone it was an error, everyone panicked and the whole market starting heading down. The next day was the biggest stock market crash ever. In early 1930, I was banned from trading for 85 years.
I went back to Hong Kong to work at my family's goldfish store. Please come and visit us at Phat Goldfish in Kowloon, only a 3 minute walk from the C2 MTR entrance.
I thought everyone would forget about me and planned to quietly return to trading in 2015. To my horror, any error in quantity or price which cause a problem kept getting blamed on Fat Finger, even when it was a mix up and not an extra key being pressed. For example, an error by a seller on the Tokyo Stock Exchange was to sell 610,000 shares at ¥6 instead of 6 shares at ¥610,000. That had nothing to do with me or with how fat the trader's finger was, but everyone kept yelling, "Fat Finger! Fat Finger!" In 2016, people blamed a fat finger for a 6% drop in the GBP. It really was a combination of many things, none to do with me or anyone else who had a wider than average finger.
Now that I can trade again, I'm finding forex more interesting than stocks. I've been doing some research on trading forex and other instruments and I'll be sharing it here.
If you see any typing errors, you can blame those on my fat finmgert. If you see any strange changes in price, it's not my fault.
Info
32338 Views 1 CommentsComments
Yup, early on in my trading years, my fingers kept pressing the wrong key like buy for sell, 0.10 for 0.01 etc.
Never tray to trade inside a moving vehicle because any bumps along the road can potentially be an account killer due to missing and pressing the wrong key.
Table of Contents
Recent
-
Bitcoin Fundamental Briefing, April 2024 Bitcoin Fundamental Briefing, March 2024 Demystifying Cryptocurrency Nodes: Deep Dive into Polygon Node Ecosystem Strategies for Trading Forex on a Budget Bitcoin Fundamental Briefing, February 2024 Bitcoin Fundamental Briefing, January 2024 Strategic Asset Allocation Techniques for Currency Traders Bitcoin Fundamental Briefing, December 2023
