Forex trading with 3 moving averages. Simple moving averages forex strategy

Looking for a simple forex trading strategy?
Believe it or not, forex strategies don’t have to be insanely complicated to make money. With this simple 3 moving averages forex strategy, we’ll help you keep things simple and put you on the path to becoming a consistently profitable forex trader.
There’s no need to fill your charts with lines or insanely complicated indicators that make your screens look like a finger painting rather than a trading terminal. By keeping things simple on your charts, you can make enough pips to become consistently profitable and not drive yourself insane in the process!
With this 3 moving average forex strategy, we’ve found that simple is best. With just the pre-set SMA and EMA moving average indicators on your MetaTrader 4 (MT4) platform, you can use a crossover strategy to trade forex like a pro.
Moving average crossovers
A crossover strategy uses multiple moving averages to enter trades when the two lines intersect or “crossover”.
In this 3 moving average crossover strategy, trade entries are triggered when faster moving averages cross over with slower-moving averages. and use It then uses a third MA to ensure you’re trading in the direction of the overall trend. Crossover trading strategies are both simple and effective.
But before we dive into the 3 moving averages trading strategy, let’s first go over a few moving average basics.
Introduction to moving averages
Moving average definition
Moving averages are a common indicator used in technical analysis. They come standard on all MT4 trading platforms and can be easily customised to suit each trading strategy.
A moving average helps traders to identify trends, by smoothing out spikes in price. Because moving averages are displayed as smooth lines, they take away the market noise and allow you to view price in terms of overriding trends.
While your trading platform will do the math for you, a moving average is determined by taking the average closing price of a currency pair over a pre-determined period, plotting the points on your chart and then connecting the plots with a line.
Moving averages use past prices, to help traders predict future prices.
Types of moving averages
There are two common types of moving averages:
- Simple Moving Average (SMA)
- Exponential Moving Average (EMA)
Simple moving average (SMA)
A simple moving average is calculated by adding up the last predetermined period of closing prices and then dividing that number by how many there are.
For example:
A 5 period, simple moving average on an hourly EUR/USD chart, would look something like this:
First add up the last 5 hours worth of closing prices: 1.1000 + 1.1100 + 1.1200 + 1.1300 + 1.1200 = 5.5800
Then divide that number by how many there are: 5.5800 / 5 = 1.1160
Exponential moving average (EMA)
An exponential moving average on the other hand simply gives more weight to current data.
This means that the most recent prices will have a higher weighting on the average than those prices from the start of your pre-determined period.
For example:
If there was a huge price spike caused by a data release or fat finger trade, then the exponential moving average’s weighting would ensure that the line isn’t skewed by an irrelevant outlier.
It’s for this reason that many moving average strategies prefer to use the EMA rather than SMA.
Don’t worry, your trading terminal will do the math for you!
Lengths of moving averages
When referring to the pre-determined period of closing prices above, we’re referring to the length of the moving average.
The length of the moving average can also be described as the number of reporting periods used to determine the average. This length affects how the moving average line is displayed on your chart.
Shorter length moving averages
Fewer closing prices are included in the calculation of the moving average.
The moving average line will, therefore, stay closer to the current price and make sharper moves that can be used by traders.
If used alone, however, they may be less useful in determining meaningful, long term trends as a result.
Longer length moving averages
A higher number of closing prices are included in the calculation of the moving average.
The moving average line will, therefore, be a lot smoother and slower to react to price moves. This is more useful when determining overall trends because one price doesn’t have a monumental effect on the overall average.
Again, if used alone however, the moving average line might become too smooth and trends might not even be able to be identified.
As you can see, both shorter and longer length moving averages have their pros and cons when using them alone. But by using them in conjunction with one another in a 3 moving average forex strategy, you can get the best of both worlds.
Let’s move onto the trading strategy itself and see how we can effectively combine 3 different moving averages into our system.
The 3 moving averages forex strategy
In this particular 3 moving average forex strategy, we use crossovers to determine when and where to enter trades. That is, when a longer length moving average, crosses over a shorter length moving average.
For our strategy, we’ve selected to use simple moving averages (SMAs), rather than exponential moving averages (EMAs). As we’ve discussed above, however, there is no right or wrong type of moving average when it comes to incorporating them into your trading strategy. Before choosing between using SMAs or EMAs, we implore you to test both and see how each mold to your personality as a trader.
Many moving average forex strategies use only the 2 moving averages to give entry signals for trades. But if you’ve traded these before, you’d know that they’re susceptible to giving a lot of signals, with a high number of them bad.
The 3 moving averages to use in this 3 moving average strategy
Trading with 3 moving averages, however, helps alleviate some of the fake-out issues that traders have with using a 2 moving average strategy.
In this trading strategy, we’ll be using the following 3 moving averages:
- 15 SMA – Red
- 30 SMA – Blue
- 100 SMA – Green
The 15 SMA is the shortest length moving average. It’s the fast-moving average used for crossovers within the strategy.
The 30 SMA is the longer length moving average. It’s the slow-moving average used for crossovers within the strategy.
The 100 SMA on the other hand, is there to ensure we’re trading in the direction of the overriding trend. This moving average ensures that we aren’t unnecessarily fighting against the tide.
One important aspect of this trading strategy is that while you want them to maintain something close to the 15/30/100 ratio, the periods of these moving averages are not set in stone. Have a play with the numbers when you’re doing your next lot of back-testing and try to find the sweet spots for each particular currency pair you’re applying the strategy to.
For example, it may be more profitable to use a 10/25/100 on AUD/USD, while 13/24/110 might be the most profitable backtest on USD/JPY. You just have to both back and forward-test to determine which set of moving averages are best for each market, using your trading style.
When to go long – The 3 moving average strategy
Here are the rules that need to be met, for a long trade to be triggered:
- Price is above the 100 SMA
- Both the 15 SMA and the 30 SMA are above the 100 SMA
- The 15 SMA then must cross above the 30 SMA
When all of these rules have been met, then a buy signal has been triggered and you should go long.
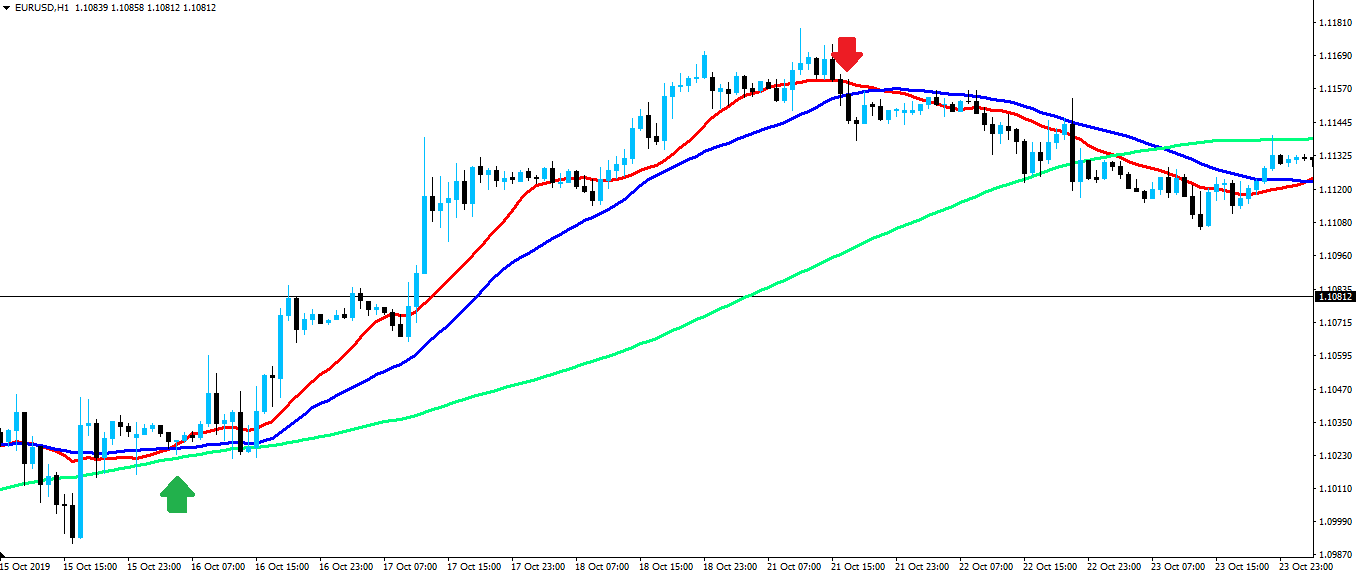
You should see each of the 3 moving averages, layered on top of one another, in order. That is the 15 SMA on top, the 30 SMA in the middle and the 100 SMA on the bottom.
As you can see on the chart, this ensures that price is in a clear bullish trend. The 100 SMA giving that 3rd level of confirmation that a 3 moving average trading strategy provides.
Risk Management
In terms of stop losses and profit targets, don’t set hard levels for either. The idea is to ride the trend that the 3 moving averages have identified and to only get off when they indicate that it’s likely to have come to a natural conclusion.
One indication for this would be when price dips down and closes below the 30 SMA.
When to go short – The 3 moving average strategy
Here are the rules that need to be met, for a short trade to be triggered:
- Price is below the 100 SMA
- Both the 15 SMA and the 30 SMA are below the 100 SMA
- The 15 SMA then must cross below the 30 SMA
When all of these rules have been met, a sell signal has been triggered and you should go short.
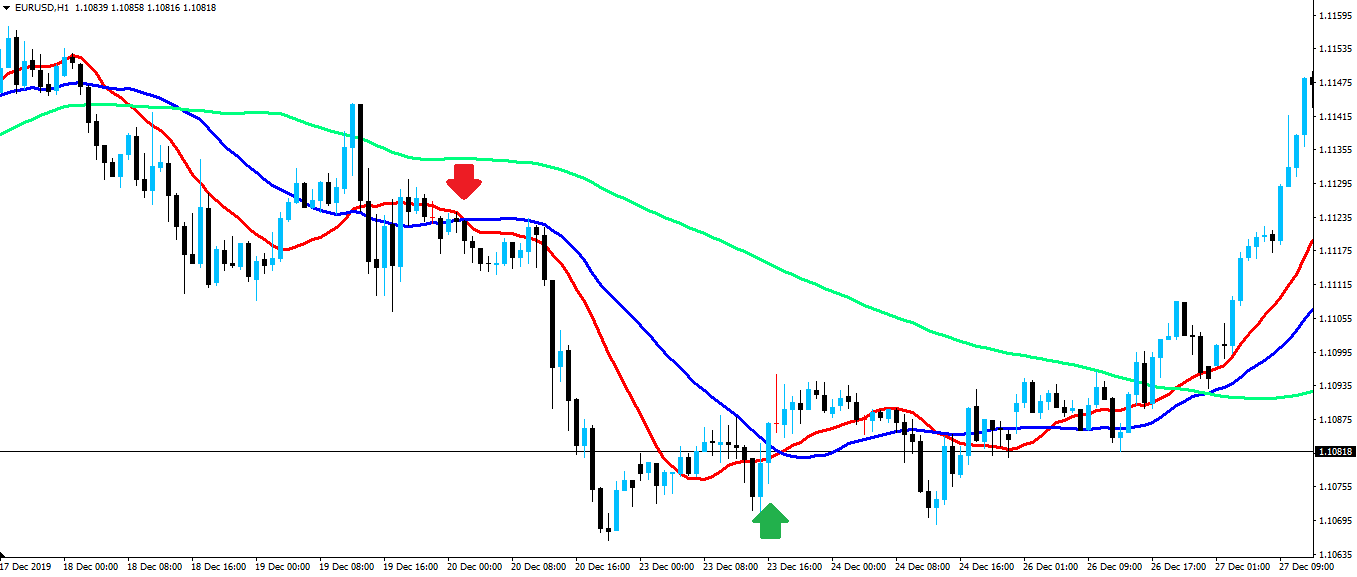
This time you’ll see that each of the 3 moving averages are once again layered, but this time in reverse order. So the 15 SMA is on the bottom, the 30 SMA is also in the middle, while the 100 SMA is now on top.
This shows on the chart as price now being in a clear bearish trend. The 100 SMA once again ensuring that confirmation is received and that you’re not fighting against the tide as soon as you go short.
Risk Management
Once more, this trading strategy is about riding trends so don’t set hard stop loss and take profit levels.
Wait until price shoots up above the 30 SMA and only then close out your short trade.
The risk of being faked-out
The third, longer length 100 SMA is used to ensure you’re not fighting against the overriding trend, but all moving average crossover strategies experience some degree of fake-outs. That is, it looked like the moving averages were crossing over, but instead, they never quite got there.
If you’re choosing to trade a moving average crossover strategy, then this is just something that you’re going to have to learn to deal with.
While the rules of this 3 moving average strategy say to not use a hard stop loss, there will be some instances where you enter a trade as per the rules, but it turns out to be a fake-out signal. With your trade never in profit, you’re going to have to decide on where to close your trade for a loss.
Here are some stop-loss choices:
- Risk 2% of your account balance
- Risk a hard 100 pips per trade
- Use support/resistance levels to determine your stop position
Final thoughts on forex trading with 3 moving averages
As you can see, this 3 moving averages strategy, ensures that forex trading doesn’t have to be complicated to make money. You’re able to keep things relatively simple and by following the strategy’s mechanical rules, you’re able to take the stress out of making the right or wrong trade entry/exit decisions.
While the 15/30/100 SMAs used in the strategy here is a little on the conservative side, you’re able to tinker with the periods and types of moving averages as you see fit. Profitable trading is all about testing and finding out what works best for your individual trading style and currency pairs of choice.
The fact that we use the 100 SMA to determine the overriding trend, means that it takes a long time to confirm entries and exits. There could be a ton of 15/30 SMA crossovers in the meantime, but without confirmation, they aren’t entry signals. This is problematic for traders with an aggressive mindset, but can once again be overcome by altering the length of that particular moving average.
There is however one true advantage of this 3 moving averages forex trading strategy – The fact you’re able to ride proven, strong trends to their absolute completion.
Author Profile

Fat Finger
My name is Phat Fin Ge, but most people just call me Fat Finger or Mr. Finger.
Many years ago, I was a trader on the Hong Kong Stock Exchange. I became so successful that my company moved me to their offices on Wall Street. The bull market was strong, but my trading gains always outperformed market averages, until that fateful day.
On October 28th, 1929, I tried to take some profits after Charles Whitney had propped up the prices of US Steel. I was trying to sell 10,000 shares, but my fat finger pressed an extra key twice. My sell order ended up being for 1,290,000 shares. Before I could tell anyone it was an error, everyone panicked and the whole market starting heading down. The next day was the biggest stock market crash ever. In early 1930, I was banned from trading for 85 years.
I went back to Hong Kong to work at my family's goldfish store. Please come and visit us at Phat Goldfish in Kowloon, only a 3 minute walk from the C2 MTR entrance.
I thought everyone would forget about me and planned to quietly return to trading in 2015. To my horror, any error in quantity or price which cause a problem kept getting blamed on Fat Finger, even when it was a mix up and not an extra key being pressed. For example, an error by a seller on the Tokyo Stock Exchange was to sell 610,000 shares at ¥6 instead of 6 shares at ¥610,000. That had nothing to do with me or with how fat the trader's finger was, but everyone kept yelling, "Fat Finger! Fat Finger!" In 2016, people blamed a fat finger for a 6% drop in the GBP. It really was a combination of many things, none to do with me or anyone else who had a wider than average finger.
Now that I can trade again, I'm finding forex more interesting than stocks. I've been doing some research on trading forex and other instruments and I'll be sharing it here.
If you see any typing errors, you can blame those on my fat finmgert. If you see any strange changes in price, it's not my fault.
Info
3407 Views 0 CommentsTags
forex strategyComments
Table of Contents
Recent
-
Bitcoin Fundamental Briefing, April 2024 Bitcoin Fundamental Briefing, March 2024 Demystifying Cryptocurrency Nodes: Deep Dive into Polygon Node Ecosystem Strategies for Trading Forex on a Budget Bitcoin Fundamental Briefing, February 2024 Bitcoin Fundamental Briefing, January 2024 Strategic Asset Allocation Techniques for Currency Traders Bitcoin Fundamental Briefing, December 2023