Brent Seymour
Recruit
- Messages
- 10
Sive, I am still new to this but cannot express enough gratitude for your posts. They are interesting and I feel so much more confident in looking at the market by having them at my side. Thank you so much!
Hi Sive and thank you for your daily analysis.
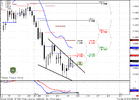
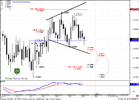
On daily chart we have a potential close above the 3x3 DMA. Can we treat this as DRPO "buy" LAL? (or the first penetration was too deep? And/or the difference between bottoms is too big?).
Thank you in advance
Hi Sive,
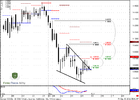
I'm not so sure but for me, we have a probability of B&B sell on daily timeframe.
Thanks and Best Regards.
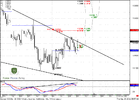
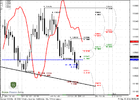
Hey sive, hope your well, i have included, screen shots of four hour chart, with a bearish hidden divergence on the 4 hour chart, and the price is just finding support at the 25x5 MA. The trend has turned bearish.
However, i have also included the daily chart, which shows that the trend is bullish and also there is a possibility for DRPO "Sell" Look-alike.
Im thinking of shorting at the break of 25x5 MA on the 4 hour chart.
Hi Papao,
probably it is safer to not treat it like DRPO at all, because thrust at minimum required bars, consolidation is too large between the bottoms, copmare to thrust and during first penetration market has reached significant resistance level. Even we will take in consideration that market has created the new low on second bottom - still this is poor DRPO, even LAL.
 )
) Morning Sive
BTW Nice work, I like your interpretation of joe's systems
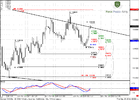
Thought I might obtain your opinion of my chart (if you have time)
as I found the pivots were a tad lower than yours I'm more than a little curious as to your starting positions
Kind regards
Craig
PS: Keep up the good work.....there are a lot of sharks in this pool & very few lifeguards
Sive
I have a question re the starting points of your fib retracements on the daily chart. The larger retracements on your chart starts around the 4277candle. Why not choose the top candle that began the bearish move for the retracement starting point--that is, around the 4500 level?