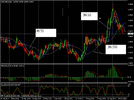
FOREX PRO Weekly October 24-28, 2011

I also don't have DiNapoli indicator. If you have Moving Average indicator, just add it and set your MA to 3 with 3 displacement and 25 MA with 5 displacement. This will be good enough for scalp.

I don't understand this, are you saying you are using a moving average with period 3 and the other with period 25 ? There are 2 MA in your chart in total ?
 
MA, Bollinger bands, and statistical significance

I don't understand this, are you saying you are using a moving average with period 3 and the other with period 25 ? There are 2 MA in your chart in total ?

thanks rashidin, i'll try that. however, i can't help but be reminded of benoit mandelbrot's statement in his book 'the (mis)behavior of financial markets' that technical analysis is akin to financial astrology. the reason i am thinking about this again is that when you consider what a MA is from a mathematical standpoint, well, it's a statistical computation on a past time series of prices. there is no future information whatsoever in there.

and thus the problem i have--again, from a mathematical standpoint--is this: how could displacing a MA by x periods make it suddenly become in any way or shape a predictor of future price action? it's just the same past info but graphically shifted to the right on the chart. how is this even remotely significant? i don't understand what diNapoli was thinking here.

nonetheless, try i shall and see what comes out of it.

in this regards, i think john bollinger's bands is a much more powerful tool and mathematically sound to give enough confidence in trend direction probabilities as established by all other technical tools one might use.

could somebody with more knowledge on this shine the light of truth on this foggy swamp?
IMO you should use whatever your comfortable with and if better, whatever is profitable aswell. 3x3 Displayed moving average (DMA) is used for thrust identification mainly. It is for example the only one I use on daily time frame. 7x5 and 25x5 are good for long trem delineation. Weekly and Montlhy time frames suit better with these ones. the MA's are very popular..you don't wanna use it for trend delineation on Dinapoli style. only for Directional Indicators such as Double Repo, BB. For Trend is MACDP and MACD and Preffered Stochastics. if MACD is up, MACDP line will be below price action. Fading the stocastichs is a good technique to improve you winning ratio.
But yes , it's crazy how matematic works. Fib ratios are even crazier in my opinion.
Trianthus, have you gone through the FPA military school? you0ve got the best info there...I've printed all and made a book. It's very helpfull.
 
thanks rashidin, i'll try that. however, i can't help but be reminded of benoit mandelbrot's statement in his book 'the (mis)behavior of financial markets' that technical analysis is akin to financial astrology. the reason i am thinking about this again is that when you consider what a MA is from a mathematical standpoint, well, it's a statistical computation on a past time series of prices. there is no future information whatsoever in there.

and thus the problem i have--again, from a mathematical standpoint--is this: how could displacing a MA by x periods make it suddenly become in any way or shape a predictor of future price action? it's just the same past info but graphically shifted to the right on the chart. how is this even remotely significant? i don't understand what diNapoli was thinking here.

nonetheless, try i shall and see what comes out of it.

in this regards, i think john bollinger's bands is a much more powerful tool and mathematically sound to give enough confidence in trend direction probabilities as established by all other technical tools one might use.

could somebody with more knowledge on this shine the light of truth on this foggy swamp?
IMO you should use whatever your comfortable with and if better, whatever is profitable aswell. 3x3 Displayed moving average (DMA) is used for thrust identification mainly. It is for example the only one I use on daily time frame. 7x5 and 25x5 are good for long trem delineation. Weekly and Montlhy time frames suit better with these ones. the MA's are very popular..you don't wanna use it for trend delineation on Dinapoli style. only for Directional Indicators such as Double Repo, BB. For Trend is MACDP and MACD and Preffered Stochastics. if MACD is up, MACDP line will be below price action. Fading the stocastichs is a good technique to improve you winning ratio.
But yes , it's crazy how matematic works. Fib ratios are even crazier in my opinion.
Trianthus, have you gone through the FPA military school? you0ve got the best info there...I've printed all and made a book. It's very helpfull.

Hi Guys,
well, I suggests that this some kind of co-working of market breath and indicators. DiNapoli has spent a lot of time to come with particular parpameters of DMA. He has technical education, how he coudn't understand how MA's work?
I suppose, that this is some kind of tuning some indicator to fundamentals that lays inside of some market's breath. They are relatively stable. For example, why harmonic numbers work? Why on EUR is one harmonic number but on S&P quite other? In fact we treat some fundamentals technically - this is just the top of the iceberg. I suppose that under this surface stuff some solid foundation lays, but we do not dig too deep. We just don't need it.

Well, this is the same as building a regression model, based on some fundamental factors - for Gold it will be different than for S&P - but fundamental stats are the same. This is just difference in markets' natures.
I understand it so...
 
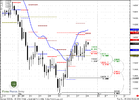
EUR/USD Daily Update, Tue 25, October 2011

Good morning,
Well, our Monday trading plan has been accomplished - market almost has reached 1.3960 and did not move below pivot.

What we gonna do now?
On daily time frame trend is bullish, market has not shown W&R - closed above 1.3905. As we've said 1.4050-1.4120 is our strong area of resistance where we could start to search possibility to short-term sell.

Our major indicator currently on daily is pivot. Since market has hit some targets on intraday charts, it could show some retracement down, but if it really intends to continue upward - it should not close below pivot.

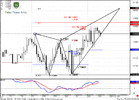
4-hour trend is bullish, market has hit 1.618 target from most recent AB-CD pattern, very close to pivot resistance1. Now it could show retracement down. Now is major focus on butterfly pattern. Market has not quite reach even 1.27 extension. From that perspective retracement should not be too deep. If it will - this is negative moment for upward continuation. To have confidence of further upward move, we need to see some upward acceleration, prefferably above upper border of bearish wedge of right wing of butterfly. If market will start deep retracement - that is not good for butterfly.
1.618 target stands precisely at the same area of our daily resistance.

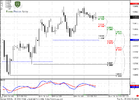
On hourly time frame trend is bearish, but I do not see any clear patterns to judge about fiurther move in nearest hours. I suppose that we need to watch for clear patterns on hourly time frame. Butterfly is possible, if market will hold above 1.3815 during retracement.
Second - watch over pivot.

If you're bearish, you better to wait either reaching of 1.4050-1.4120 area or close below pivot.

If you're bullish - wait for clear patterns on hourly chart.
Currently it looks so that the upward continuation is more probable - daily and 4 hour trends are bullish, market stands above pivot, 4-hour Butterfly...
 

Attachments

  • EUR_D_25_10_11.PNG
    EUR_D_25_10_11.PNG
    45.5 KB · Views: 135
  • EUR_4H_25_10_11.PNG
    EUR_4H_25_10_11.PNG
    47 KB · Views: 130
  • EUR_1H_25_10_11.PNG
    EUR_1H_25_10_11.PNG
    44.3 KB · Views: 136
Allias608

Triantus Shango
thanks for the tip rashidin. unfortunately i don't have the dinapoli indicators. MBTrading doesn't provide them on their proprietary platform or MT4. and if i may ask--and let me extend the question to all who read sive's analysis here--coud you guys tell me a little about your experience with your broker? broker name? how is the execution? requotes?

Check on the Templates and see if there is a DiNapoli. I was just going through my MT4 and found it. The default MA's are 3 x 3, 7 x 5 and 25 x 5 on the chart i have attached - USDCAD - Daily. You can change them of-course. He has a MACD (8,17,9), Stoch (8,3,3)

I follow Sive's Analysis very closely. I must say the FPA Academy is more practical and real. Thanks Sive for the education.
 

Attachments

  • dinapoli mt4 chart - template.2.gif
    dinapoli mt4 chart - template.2.gif
    23.5 KB · Views: 117
Check on the Templates and see if there is a DiNapoli. I was just going through my MT4 and found it. The default MA's are 3 x 3, 7 x 5 and 25 x 5 on the chart i have attached - USDCAD - Daily. You can change them of-course. He has a MACD (8,17,9), Stoch (8,3,3)

I follow Sive's Analysis very closely. I must say the FPA Academy is more practical and real. Thanks Sive for the education.

Hi Anthony, guys,
MT 4 has 100% correct built-in DMA. Use simple SMA and just add shift...

Default MACD is unacceptable from DiNapoli framework, since it uses simple averaging of signal line instead of exp. and does not allow to use fractional periods.
Stoch is also not quite correct - it usues exp. averaging while we need smooth or modified.
 
I don't understand this, are you saying you are using a moving average with period 3 and the other with period 25 ? There are 2 MA in your chart in total ?

Hi nicolebobbin,

Yes, I just use simple moving average 3 and 25 with 3 and 5 displacement respectively. I often don't use 7x5 to make my chart more clearer.

If I not mistaken, this is a basic for DiNapoli indicators and we should know about this. In fact there is default template about DiNapoli indicator on MT4. For better comfort, you also can add some other indicators such as Bolinger Band, fractal, pivot indicator, DiNapoli detrended or something else that you think necessary for assist you.

To share with you, I always have 4 charts for each pair I trade. Each chart have different indicators to get more clearer chart. I'm comfortable with this kind of style. You can choose you own style.

The technique that I've mentioned before (Sive, please correct me if I'm wrong) is actually part of DiNapoli trading technique. Just make some revision on DiNapoli's book and you can realize it. Sometimes, market try to test 3x3 line (for buy trade), if market cannot close below it, normally the next bar will explode to take out previous high (use fractal indicator for better understanding). In fact, you can refer to your chart now about this technique. It happen every hour, dude!:)

Thanks and Best Regards
 
Last edited:
Stoploss: Just stick to our plan

Guys,

The reason why I told you (for those who didn't know yet) about this technique is to hold your stoploss position and make some other trades if it has been triggered. Do not too frustrated about your losses cause with this technique and with assisting of Sive analysis, together we can scalp our loss, hopefully. :D

But again, it is very difficult to act accordingly when it happen, in fact to me also. At least we try to not make it a habit.:unhappy:

Thanks and Best Regards.
 
Last edited:
Back
Top