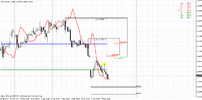
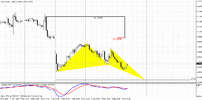
FOREX PRO Weekly May 07-11, 2012

daily chart

guys, price is neither piercing 61.8% node nor trend line and bottom of pennant (yellow) on daily. pennant has a 400 pips mast approx. so dare i say we might have a potential move up, trend continuation (trend started from the 2625 low), of about 400 pips... that's up to about 3380 or so?

does that make sense sive?
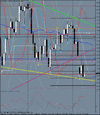
 

Attachments

  • eurusd_daily.gif
    eurusd_daily.gif
    53.5 KB · Views: 38
Asif< i am happy to hear that you do this full time. i will like to be in touch with you for advice and possibly mentoring. i am not exactly a novice trader as i have remain in a net profit position in the past one year. i need guidance on how to make the final transition to full time trading. and by the way, i would have put on my traditional dress, but am not so sure you will like it!
thought so looks great :)
I wish you the best in your trading,how long you been a trader? dont give up as its taken me since 2007/8 to become consistent and change my life,as i do this full time know with Thanks firstly as he will tell me off!!! thanks to Felix FPA and the great Coach Sive...

Asif
 
hi sive sir, its showing a butterfly on weekly chart i dont know its wrong or rite..!!View attachment 5406
kindly have look n correct me plz

actually it's a gartley 222 buy.

Hi Lolly,
Triantus is right - this is indeed Gartley "222". That's particularly why we still do not deny an idea of potential move to 1.37.
I suggest you to read our Forex Military school, particularly chapter, dedicated to Harmonic patterns. This will be nice guide with butterflies, AB=CD's, "222" and other patterns.
In general, since butterfly is reversal pattern, it has right wing always greater than left one, but this is not single condition.
 
Hi Ayoayo,

Lol come on!!!!!!! A guy pays a compliment to a lady! and sincerely wishes her luck,and get cheesy comments from some of you..whats the world coming to! :)

I am moving in the next 2 months to my new country and home in Cyprus.
Yes i dont no about mentoring as i have learnt all this from the school of HARD KNOCKS...
will be happy to let you know how i overcome my challenges..

i am sure your traditional costume is just fine... lol :))))

Asif
 
guys, price is neither piercing 61.8% node nor trend line and bottom of pennant (yellow) on daily. pennant has a 400 pips mast approx. so dare i say we might have a potential move up, trend continuation (trend started from the 2625 low), of about 400 pips... that's up to about 3380 or so?

does that make sense sive?
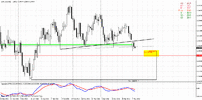
Hi Triantus,
The chart looks like spaghetti bowl-kind of giving me idea for lunch, but I am little confused...In any case I am watching closely what markets behavior will be around 1.29 level and IMHO price will shoot up to test 1.35-in agreement with your theory!
Cheers!
 
EUR/USD Daily Update, Wed 09, May 2012

Good morning,
on daily time frame we do not see any attempt to shift current downward breakout of triangle to failure breakout. Market is not even move above triangle's lower border but even could not close the gap totally. Also price stands below double pivot area. This makes me think that bear's power is significant.
Nearest destination is the same 1.29 area. Depending on how market will response there will give us the answer - should we expect move to 1.37 on weekly chart or not.

Most important for us currently are 4-hour and hourly TF. On 4-hour TF we see bearish dynamic pressure, since trend holds bullish but price action is not. Also there is the chance for Butterfly "buy". Take a look - potential reversal points stand accurately in the same 1.29 area.
Still market has formed another stop grabber pattern and it's destination could become a high marked by yellow circle. If you will take a look at hourly chart - you can see that we already have butterfly in progress. If 4-hour Stop grabber will work, then this batterfly will become wider, so, that current price action will become left wing and right wing will just ready to form.
If Stop grabber will fail - well, that hourly butterfly will be in progress. Anyway, despite the shape of butterfly,destination will be the same, since we have the same initial swing for both of them.

From weekly point of view, 1.29-1.2950 area is nice for searching buy opportunities. This is solid support level and even if we will become wrong, market probably will respect it. There is no need to say what will happen if we will be right. Butterfly "buy" is not bad pattern to follow in this circumstances, I suppose.
One thing that we do not want to see is a strong plunge down through 1.29. This could become a hint that market is following by bearish scenario. We also have discussed it in weekly research.
 

Attachments

  • eur_d_09_05_12.gif
    eur_d_09_05_12.gif
    33.2 KB · Views: 84
  • eur_4h_09_05_12.gif
    eur_4h_09_05_12.gif
    30.9 KB · Views: 96
  • eur_1h_09_05_12.gif
    eur_1h_09_05_12.gif
    28.7 KB · Views: 97
Hi Lolly,
Triantus is right - this is indeed Gartley "222". That's particularly why we still do not deny an idea of potential move to 1.37.
I suggest you to read our Forex Military school, particularly chapter, dedicated to Harmonic patterns. This will be nice guide with butterflies, AB=CD's, "222" and other patterns.
In general, since butterfly is reversal pattern, it has right wing always greater than left one, but this is not single condition.

Thank you sive sir, thanks Triantus Shango
 
Hi everyone,
Can anybody send me via private message the "Red line MACD derivative "indicator that Sive uses in his analysis?The one that I am using has slight difference from the one Sive uses...Thanks in advance!
 
Back
Top