acetraderfx
AceTrader.com Representative
- Messages
- 1,109
DAILY TECHNICAL OUTLOOK ON GBP/USD
Last Update At 12 Jun 2014 00:23GMT
Trend Daily Chart
Sideways
Daily Indicators
Turning up
21 HR EMA
1.6784
55 HR EMA
1.6782
Trend Hourly Chart
Sideways
Hourly Indicators
Rising
13 HR RSI
58
14 HR DMI
+ve
Daily Analysis
Choppy trading to continue
Resistance
1.6883 - May 27 high
1.6845 - Last Fri's high
1.6817 - Tue's high
Support
1.6838 - Y'day's low
1.6723 - Last Thur's low
1.6693 - May's 5-week low
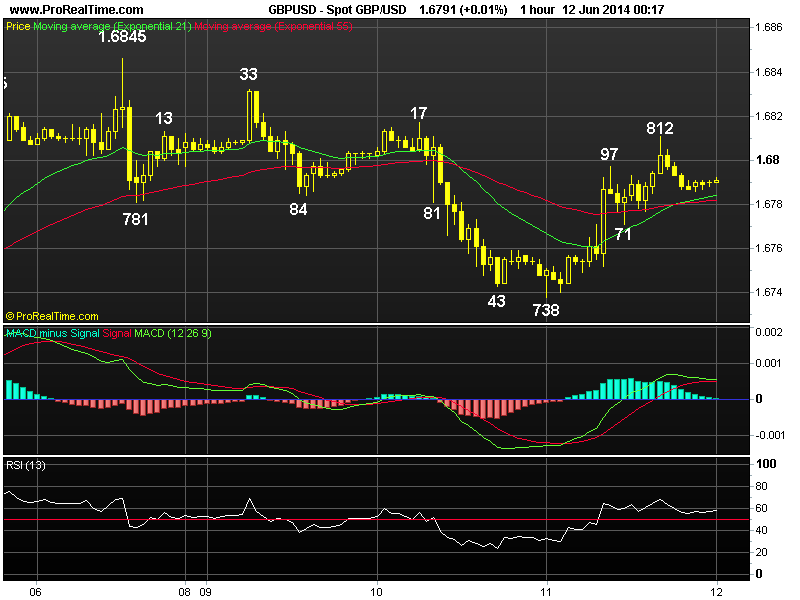
. GBP/USD - 1.6791... Despite cable dropped to 1.6738 shortly after Asian open on Wed. Price rallied to 1.6797 in European morning after jobs data showed U.K. unemployment fell to its lowest lvl since early 2009. Later, cable extended intra-day gain to session high of 1.6812 in NY b4 retreating.
. Looking at the hourly n daily charts, despite y'day's rebound fm 1.6838, as mentioned in previous update, the early selloff fm last Fri's high of 1.6845 signals correction fm May's 5-week trough at 1.6693 has ended there n as long as 1.6833 (Mon's high) holds, downside bias remains for another decline twd 1.6723 (last Thur's low) after consolidation, below wud yield re-test of aforesaid low at 1.6693 but break there needed to confirm early fall fm May's near 5-year peak at 1.6997 (Reuters) to retrace MT uptrend has finally resumed n yield weakness to 1.6657 n then 1.6595, being the Apr 15 low n 1.23 times extension of 1.6997-1.6732 measured fm 1.6923.
. Today, as cable is currently trading abv the 21-hr n 55-hr emas, suggesting near term upside bias remains, abv 1.6812 may yield gain to 1.6833 but only break of 1.6845 bring stronger retracement twd 1.6881 (61.8% r of 1.6997-1.6693).
Last Update At 12 Jun 2014 00:23GMT
Trend Daily Chart
Sideways
Daily Indicators
Turning up
21 HR EMA
1.6784
55 HR EMA
1.6782
Trend Hourly Chart
Sideways
Hourly Indicators
Rising
13 HR RSI
58
14 HR DMI
+ve
Daily Analysis
Choppy trading to continue
Resistance
1.6883 - May 27 high
1.6845 - Last Fri's high
1.6817 - Tue's high
Support
1.6838 - Y'day's low
1.6723 - Last Thur's low
1.6693 - May's 5-week low
. GBP/USD - 1.6791... Despite cable dropped to 1.6738 shortly after Asian open on Wed. Price rallied to 1.6797 in European morning after jobs data showed U.K. unemployment fell to its lowest lvl since early 2009. Later, cable extended intra-day gain to session high of 1.6812 in NY b4 retreating.
. Looking at the hourly n daily charts, despite y'day's rebound fm 1.6838, as mentioned in previous update, the early selloff fm last Fri's high of 1.6845 signals correction fm May's 5-week trough at 1.6693 has ended there n as long as 1.6833 (Mon's high) holds, downside bias remains for another decline twd 1.6723 (last Thur's low) after consolidation, below wud yield re-test of aforesaid low at 1.6693 but break there needed to confirm early fall fm May's near 5-year peak at 1.6997 (Reuters) to retrace MT uptrend has finally resumed n yield weakness to 1.6657 n then 1.6595, being the Apr 15 low n 1.23 times extension of 1.6997-1.6732 measured fm 1.6923.
. Today, as cable is currently trading abv the 21-hr n 55-hr emas, suggesting near term upside bias remains, abv 1.6812 may yield gain to 1.6833 but only break of 1.6845 bring stronger retracement twd 1.6881 (61.8% r of 1.6997-1.6693).
Last edited by a moderator: