AceTraderFx Jun 27: Weekly/ Daily Technical Outlook & Trading Ideals on USD/CHF

acetraderfx

AceTrader.com Representative
Messages
1,109
DAILY USD/CHF TECHNICAL OUTLOOK

Last Update At 27 Jun 2014 00:18GMT

Trend Daily Chart
Sideways

Daily Indicators
Turning down

21 HR EMA
0.8935

55 HR EMA
0.8935

Trend Hourly Chart
Sideways

Hourly Indicators
Neutral

13 HR RSI
49

14 HR DMI
+ve

Daily Analysis
Consolidation with mild upside bias

Resistance
0.9037 - Jun 05 3-1/2 month high
0.9013 - Last Mon's high
0.8975 - Last Fri's high

Support
0.8908 - Wed's n Jun 05 low
0.8867 - 50% r of 0.8698-0.9037
0.8821 - 06 May low


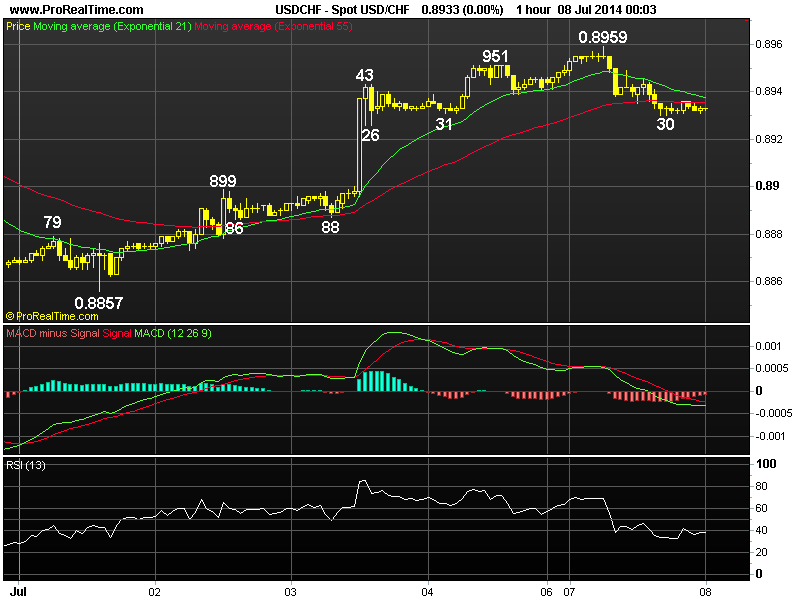
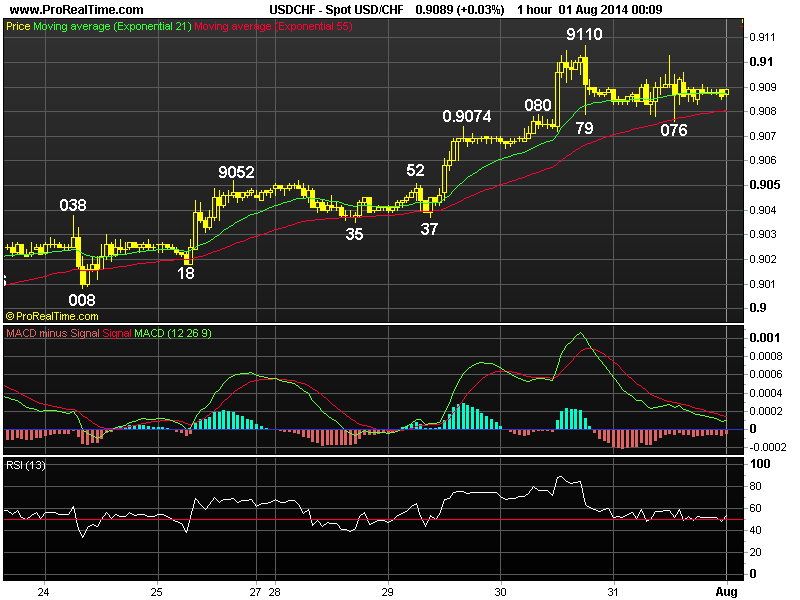
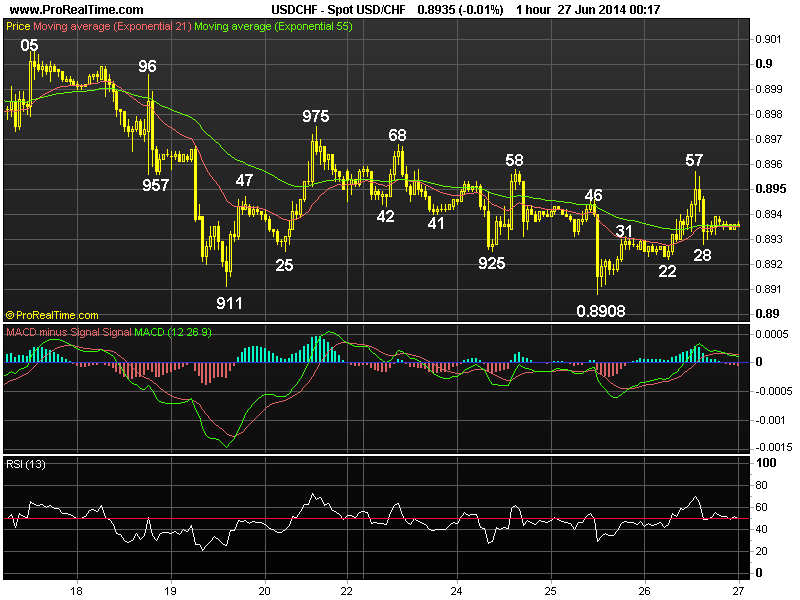
. USD/CHF - 0.8934... Although the greenback traded sideways in Asia y'day n edged lower to session low at 0.8922 at European open, renewed buying emerged there n price rose to an intra-day high at 0.8957 in NY morning on dlr's broadbased strength. Later, price retreated to 0.8941 b4 moving narrowly in NY.

. Looking at the hourly n daily charts, despite Wed's re-test of 0.8908 (reaction low fm 0.9037), failure to penetrate this near term key sup suggests further choppy 'sideways trading' inside the near 3-week range of 0.8908-0.9037 wud continue with mild upside bias n abv last Fri's high at 0.8975 wud extend marginally but res 0.9013 shud remain intact n yield another fall later. On the downside, below 0.8908 wud confirm the 3-legged rise fm Mar's near 2-1/2 year trough at 0.8698 has formed a temp. top at Jun's 3-1/2 month peak at 0.9037 n risk stronger retracement twds 0.8867, being the 'natural' 50% r of said move, however, sup at 0.8821/27 (May 06 low n 61.8% r resp.) shud hold.

. Today, we are holding a long position entered y'day for gain to 0.9000 n although below 0.8908 wud extend weakness, prominent 'bullish convergences' on hourly oscillators wud prevent steep fall n yield rebound.


CHF%20jun%2027.png
 
Last edited by a moderator:
AceTraderFx Jul 8: Daily Technical Outlook & Trading Ideals on USD/CHF

DAILY USD/CHF TECHNICAL OUTLOOK
Last Update At 08 Jul 2014 00:00GMT

Trend Daily Chart
Sideways

Daily Indicators
Turn up

21 HR EMA
0.8938

55 HR EMA
0.8935

Trend Hourly Chart
Sideways

Hourly Indicators
Falling

13 HR RSI
41

14 HR DMI
-ve

Daily Analysis
Initial weakness b4 one more rise

Resistance
0.9013 - Jun 16 high
0.8975 - Jun 20 high
0.8959 - Y'day's high

Support
0.8899 - Last Wed's high (now sup)
0.8857 - Last Tue's low
0.8821 - May 06 low


. USD/CHF - 0.8934... The greenback traded with a firm bias in Asia y'day n rose to session high at 0.8959 at European open, however, dlr pared intra-day gains n retreated to 0.8938 in European morning, then marginally lower to 0.8930 in NY due to dlr's broad-based retreat b4 stabilizing ahead of NY close.

. Looking at the daily chart, dlr's strg rebound fm last Tue's 6-week low at 0.8857 suggests the early fall fm Jun's 3-1/2 month high at 0.9037 has ended there n consolidation with upside bias wud be seen. A daily close abv 0.8968/75, this is the 'dynamic' 61.8% r of aforesaid decline n Jun 20 top respectively, wud add credence to this view n extend gain twds res 0.9013 (Jun 16 peak). However, reckon said 0.9037 res shud hold this week n yield retreat later. On the downside, only below 0.8857 wud revive bearishness of a stronger retracement of upmove fm Mar's 2-1/2 year trough at 0.8698 twds 0.8821/27 (May 06 low n 61.8% r of 0.8698-0.9037 respectively).

. Today, in view of abv analysis, we are buying dlr on intra-day decline in
anticipation for one more rise to 0.8895 n only below 0.8899 (prev. res, now
sup) wud abort n risk weakness to 0.8873 but sup at 0.8857 shud remain intact.

CHF%20jul%2008.png
 
Last edited by a moderator:
AceTraderFx Jul 15: Daily Technical Outlook & Trading Ideals on USD/CHF

DAILY USD/CHF TECHNICAL OUTLOOK

Last Update At 14 Jul 2014 23:58GMT

Trend Daily Chart
Sideways

Daily Indicators
Neutral

21 HR EMA
0.8919

55 HR EMA
0.8921

Trend Hourly Chart
Sideways

Hourly Indicators
Neutral

13 HR RSI
48

14 HR DMI
-ve

Daily Analysis
Consolidation with a neutral bias

Resistance
0.9013 - Jun 16 high
0.8975 - Jun 20 high
0.8959 - Last Mon's high

Support
0.8899 - Y'day's low
0.8857 - Jul low (1st)
0.8821 - May 06 low


. USD/CHF - 0.8918.. Although the greenback traded sideways in Asia y'day n edged up to session high at 0.8932 at European open, price fell sharply to an intra-day low at 0.8899 on euro's brief rally. However, dlr pared its losses n recovered to 0.8926 in NY session b4 stabilising.

. Looking at the hourly n daily charts, although y'day's retreat to 0.8899 suggests choppy trading below last Mon's high at 0.8959 has ended there n marginal weakness fm here can't be ruled out, as the early strg rebound fm Jul's low at 0.8857 signals the pullback fm Jun's 3-1/2 month peak at 0.9037 has possibly ended there, upside bias remains for a re-test of 0.8959. Abv wud add credence to this view n extend gain twds 0.8975 (Jun 20 peak) later this week, however, res 0.9013 (Jun 16 top) shud limit upside. On the downside, only below 0.8857 wud signal the decline fm 0.9037 has resumed instead n yield stronger retrace. of rise fm Mar's 0.8698 trough twds 0.8821 (May 06 low).

. Today, in view of abv analysis, we are trading dlr on both sides of the market n will sell on intra-day recovery for one more fall or buy the greenback on next decline in an anticipation of subsequent rebound.

CHFjul%2015.png
 
Last edited by a moderator:
AceTraderFx Jul 21: Weekly Technical Outlook & Trading Ideals on USD/CHF

WEEKLY USD/CHF TECHNICAL OUTLOOK

Last Update At 20 Jul 2014 23:45GMT

Trend Daily Chart
Sideways

Daily Indicators
Rising

21 HR EMA
0.8981

55 HR EMA
0.8976

Trend Hourly Chart
Up

Hourly Indicators
Bearish divergences

13 HR RSI
49

14 HR DMI
+ve

Daily Analysis
Consolidation with upside bias

Resistance
0.9082 - Feb 03 high
0.9037 - Jun 05 3-1/2 month high
0.9004 - Last Fri's high

Support
0.8967 - Last Thur's low
0.8959 - Jul 10 high
0.8899 - Last Mon's low


. USD/CHF - 0.8980... Despite dlr's brief retreat to last week's low of 0.8899 on Mon, renewed buying quickly emerged n lifted the pair, price then climbed to 0.8989 on Wed n later to a 1-month high of 0.9004 b4 easing in NY afternoon.

. Let's look at bigger picture 1st, dlr's strg rise fm Jul's 0.8857 low n breach of 0.8859 res (now sup) to 0.9004 confirms the early correction fm Jun's 3-1/2 month peak at 0.9037 has ended there n consolidation with upside bias remains for re-test of said res, abv wud extend MT the 3-legged rise fm Mar's 2-1/2 year trough at 0.8698 to next chart obj. at 0.9082. Having said that, as daily technical indicators wud display prominent 'bearish divergences' on such move, risk has increased for a major correction to take place later this month or in early Aug. On the downside, only below 0.8924/38 (prev. res) wud signal top is made n may risk possible weakness twd 0.8899.

. Today, although Fri's retreat fm 0.9004 suggests initial sideways move is in store, as long as 0.8963/67 sup area holds, marginal gain is likely but as hourly oscillators' readings have displayed 'bearish divergences', reckon 0.9037 shwud cap upside. Below 0.8938 aborts bullishness on dlr, risks 0.8900/10.

CHF%20jul%2021.png
 
Last edited by a moderator:
AceTraderFx Jul 28: Weekly Technical Outlook & Trading Ideals on USD/CHF

WEEKLY USD/CHF TECHNICAL OUTLOOK

Last Update At 27 Jul 2014 23:30GMT

Trend Daily Chart
Sideways

Daily Indicators
Rising

21 HR EMA
0.9041

55 HR EMA
0.9031

Trend Hourly Chart
Up

Hourly Indicators
Bearish divergences

13 HR RSI
66

14 HR DMI
+ve

Daily Analysis
Consolidation b4 upmove resumes

Resistance
0.9157 - Jan 21 high
0.9082 - Feb 03 high
0.9052 - Lst Fri's 5-1/2 mth high

Support
0.9038 - Last Thur's high
0.9008 - Last Thur's low
0.8972 - Mon's low


. USD/CHF - 0.9048... The pair moved in exact opposite direction to eur/usd last week. Price met renewed buying at 0.8972 on Mon n rallied to a 5-1/2 month peak of 0.9038 Thur. Despite a brief pullback to 0.9008, the pair later climbed to 0.9052 due to usd's broad-based strength in NY session on Fri.

. Let's look at the bigger picture 1st, dlr's break of Jun's 0.9037 high to 0.9052 Fri confirms the 3-legged MT upmove fm 2014 near 2-1/2 year bottom at 0.8698 (Mar) has resumed. As long as 0.9004/08 holds, aforesaid rise shud head to next daily obj. at 0.9082 (Feb's top), abv wud bode well for dlr to extend twd 2014 peak at 0.9156 (Jan high). Having said that, as the daily oscillators' readings wud be in o/bot territory on such move, upside wud be ltd to 0.9196, this is equality proj. of 0.8698-0.9037 measured fm 0.8857 n chart res at 0.9251 (Nov 2013 top) shud remain intact. On the downside, only a daily close below 0.8972 (last week's low) signals dlr's uptrend fm 0.8698 has made a temp. top.

. Today, as current price is trading abv 21-hr n 55-hr emas, buying on dips is favoured but 'bearish divergences' on the hourly indicators shud cap price at 0.9100/03 n risk has increased for a minor correction to take place later.


CHF%20jul%2028.png
 
Last edited by a moderator:
AceTraderFx Aug 1: Daily Technical Outlook & Trading Ideals on USD/CHF

DAILY USD/CHF TECHNICAL OUTLOOK

Last Update At 01 Aug 2014 00:15GMT

Trend Daily Chart
Sideways

Daily Indicators
Rising

21 HR EMA
0.9088

55 HR EMA
0.9081

Trend Hourly Chart
Up

Hourly Indicators
Turning down

13 HR RSI
52

14 HR DMI
-ve

Daily Analysis
Consolidation b4 uptrend resumes

Resistance
0.9194 - eq. proj. of 0.8698-0.9037 fm 0.8857
0.9157 - Jan 21 high
0.9110 - Wed's 6-month high

Support
0.9035 - Mon's low
0.9008 - Last Thur's low
0.8972 - Last Mon's low


. USD/CHF - 0.9088... Although dlr traded narrowly in tandem with eur/usd in Asia y'day n briefly edged lower to 0.9078 in European morning, the pair pared intra-day losses n rose to session high at 0.9103 at NY open. However, offers below 0.9110 top pressured price lower n dlr fell to 0.9076 in NY morning.

. The outlook remains similar to prev's update, where dlr's rally to a fresh 6-month high at 0.9110 on Wed confirms the 3-legged upmove fm Mar's 2-1/2 year trough at 0.8698 wud resume after consolidation b4 extending gain twds 2014 top at 0.9157 (Jan 21), abv wud yield marginal headway, however, as 'bearish divergences' on the hourly indicators wud appear on such a move, strg gain abv there is unlikely to be seen n reckon 0.9194 (equality proj. of 0.8698-0.9037 measured fm 0.8857) shud remain intact this week n bring a much-needed correction next week. On the downside, only below last Thur's low at 0.9008 wud confirm a temporary top has been made n risk stronger retracement twd 0.8972 (last Mon's low) in the early part of Aug.

. Today, we are holding a long position entered on Wed for gain to 0.9150 n only below Mon's 0.9035 wud risk stronger retracement twd 0.9008.

CHF%20aug%2001.png
 
Last edited by a moderator:
AceTraderFx Aug 27: Daily Technical Outlook & Trading Ideals on USD/CHF

DAILY USD/CHF TECHNICAL OUTLOOK
Last Update At 27 Aug 2014 00:08GMT

Trend Daily Chart
Up

Daily Indicators
Rising

21 HR EMA
0.9166

55 HR EMA
0.9155

Trend Hourly Chart
Up

Hourly Indicators
Bearish divergences

13 HR RSI
65

14 HR DMI
+ve

Daily Analysis
Marginal rise b4 retreat

Resistance
0.9251 - Nov 07 (2013)
0.9202 - 80.9% proj. of 0.9024-0.9146 fm 0.9104
0.9181 - Y'day's 9-month high

Support
0.9138 - Y'day's low
0.9104 - Last Fri's low
0.9088 - Last Wed's low


. USD/CHF - 0.9178... Despite initial dlr's decline fm 0.9164 (Asia) to
0.9138 at European open due to intra-day rebound in eur/usd, renewed weakness in
euro plus rebound in eur/chf cross helped the pair ratchet higher, dlr later
climbed one tick abv Mon top to a fresh 9-month high of 0.9181 in NY.

. Let's look at the daily picture 1st, y'day's rise to 0.9181 confirms the
3-legged MT upmove fm Mar's near 2-1/2 year bottom at 0.8698 has once again
resumed n further headway to 0.9200/02 (psychological lvl n 80.9% projection of
0.9024-0.9146 measured fm 0.9104 respectively) is seen. Abv said upside targets
wud extend marginally, however, anticipated 'bearish divergences' on the hourly
indicators wud prevent strg gain n reckon price wud hold well below daily res at
0.9251 (Nov '13) n yield a much-needed correction later this week. On the down-
side, only below 0.9104 wud indicate a temporary top has been made n risk stron-
ger retracement twd 0.9058 (last Wed's low), then twds 0.9024 (Aug 15 bottom).

. Today, in view of abv analysis, one can buy dlr on dips for marginal
gain after consolidation or sell on next intra-day upmove in expectation of a
minor correction to take place. Below 0.9138 signals temp. top made, 0.9104/07.

CHF%20aug%2027.png
 
Last edited by a moderator:
AceTraderFx Sept 2: Daily Technical Outlook & Trading Ideals on USD/CHF

DAILY USD/CHF TECHNICAL OUTLOOK
Last Update At 01 Sep 2014 23:58GMT

Trend Daily Chart
Up

Daily Indicators
Rising

21 HR EMA
0.9191

55 HR EMA
0.9179

Trend Hourly Chart
Up

Hourly Indicators
Bearish divergences

13 HR RSI
61

14 HR DMI
+ve

Daily Analysis

Consolidation b4 one more rise

Resistance
0.9298 - Sep 19 high (2013)
0.9251 - Nov 07 high (2013)
0.9198 - Last Fri's n Mon's fresh 9-mth high

Support
0.9163 - Last Fri's Euroepan morning high (now sup)
0.9126 - last Thur's low
0.9104 - Aug 22 low


. USD/CHF - 0.9194... Although the greenback opened higher n resumed its recent winning streak to a fresh 9-month high at 0.9198 in NZ, price retreated to 0.9177 in European morning on rebound in eur/usd. However, dlr found renewed buying in European session n climbed back to 0.9198 near Mon's closing.

. Looking at the hourly n daily charts, y'day's gain to 0.9198 signals the 3-legged rise fm Mar's 2-1/2 year trough at 0.8698 remains in progress n further gain twd daily res at 0.9251 (Nov '13) wud be seen this week, abv wud extend marginally, however, anticipated 'bearish divergences' on the hourly oscillators wud prevent strg gain abv there n reckon res 0.9898/00 (Sep 19 high n psychological lvl respectively.) shud remain intact this week n risk wud increase for a much-needed correction later. On the downside, only a daily close below sup at 0.9104 (Aug 22 trough) wud indicate a temporary top has been made n risk stronger correction twd chart sup at 0.9058.

. Today, in view of abv analysis, we are buying dlr on intra-day pullback for gain to 0.9215/20 n only below last Thur's low at 0.9126 wud abort daily bullishness n risk retracement twd 0.9104.

CHFSEP%2002.png
 
Last edited by a moderator:
AceTraderFx Nov 24: Weekly Technical Outlook & Trading Ideals on USD/CHF

WEEKLY USD/CHF TECHNICAL OUTLOOK
Last Update At 24 Nov 2014 00:05GMT

Trend Daily Chart
Up

Daily Indicators
Bearish divergences

21 HR EMA
0.9679

55 HR EMA
0.9638

Trend Hourly Chart
Up

Hourly Indicators
Easing fm o/bot

13 HR RSI
72

14 HR DMI
+ve

Daily Analysis
Possible resumption of MT uptrend

Resistance
0.9772 - 61.8% proj. of 0.9024-0.9690 fm 0.9360
0.9742 - Nov 07 fresh 1-year high
0.9714 - Intra-day high in NZ

Support
0.9664 - Hourly su9
0.9635 - Prev. hourly res (now sup)
0.9606 - Last Thur's high (now sup)

. USD/CHF - 0.9714... The greenback also swung wildly in tandem with euro in inverse direction last week. Despite ratcheting lower to a 3-week bottom of 0.9530 last Wed, price jumped on FRi to 0.9709 due to intra-day selloff in the euro after ECB Draghi's repeated dovish comments of launching stimulus measures.

. Let's look at the bigger picture 1st, dlr's aforesaid strg bounce fm 0.9530 to 0.9709 (Fri) signals pullback fm Nov's fresh 1-year peak at 0.9740 as ended there n re-test of this res lvl shud be forthcoming soon, break wud confirm MT uptrend fm 0.8698 (May's near 2-1/2 year low) has once again resumed n yield gain to next upside target at 0.9772, this is 61.8% proj. of intermediate rise fm 0.9024 to 0.9690 measured fm 0.9360. Having said that, as the daily technical indicators wud dispaly 'bearish divergences' on such move, strg gain may not be seen n reckon 0.9875 (61.8% proj. of 0.8857-0.9690 fm 0.9360) wud cap upside n risk has increased for a long-overdue correction to occur. On the downside, a daily close below 0.9530 signals temp. top is made n risks 0.9442.

. Today, price rose to 0.9731 in NZ is currently trading abv 21-hr & 55-hr emas, buying dlr on dips is the way to go for subsequent headway twd 0.9772.
CHF%20nov%2022%281%29.png
 
Last edited by a moderator:
AceTraderFx Nov 26: Daily Technical Outlook & Trading Ideals on USD/CHF

DAILY USD/CHF TECHNICAL OUTLOOK
Last Update At 27 Nov 2014 00:03GMT

Trend Daily Chart
Up

Daily Indicators
Bearish divergences

21 HR EMA
0.9624

55 HR EMA
0.9640

Trend Hourly Chart
Near term down

Hourly Indicators
Falling

13 HR RSI
40

14 HR DMI
-ve

Daily Analysis
Consolidation with downside bias

Resistance
0.9742 - Nov 07 fresh 1-year high
0.9698 - Tue's high
0.9666 - Y'day's high

Support
0.9595- Y'day's low
0.9554 - Last Thur's low
0.9530 - Last Thur's low

. USD/CHF - 0.9613... Dlr's intra-day choppy trading in Europe y'day later ended with subsequent losses. Despite staging a rebound fm 0.9622 to 0.9666 on sharp retreat in eur/usd in European morning, price quickly fell on broad-based weakness in the greenback, price later fell to 0.9595 after downbeat U.S. data.

. Looking at the bigger picture, despite Mon's higher open to 0.9731 in NZ, failure to re-test Nov's fresh 1-year peak at 0.9742 n y'day's sell off to 0.9595 has deferred our previous bullish prospect of a resumption of uptrend n further choppy trading below aforesaid peak is envisaged n weakness twd 0.9568 (80.9% r of 0.9530-0.9731) can't be ruled out, however, as long as 0.9530 (last Wed's reaction low fm 0.9742) holds, dlr's MT 3-legged up move fm Mar's 2-1/2 year bottom at 0.8698 wud resume n yield re-test of 0.9742 next week, abv wud extend gain twd 0.9772, being 61.8% projection of 0.9024-0.9690 measures fm 0.9690, how ever, as daily technical indicators wud display 'bearish divergences' on such move, strg gain abv there is unlikely n psychological res at 0.9800 shud hold.

. Today, we're standing aside initially n may sell dlr on intra-day recovery or buy on next decline in anticipation of a rebound.
CHF%20nov%2027%281%29.png
 
Last edited by a moderator:
Back
Top